Citation: Hasanat MA, et al. Serum Ferritin in Newly Detected Diabetes and Prediabetes. Diabetes Obes Int J 2017, 2(3): 000158.
*Corresponding author: Hasanat MA, Professor and Chairman, Department of Endocrinology, BSMMU, Dhaka, Bangladesh, Tel: +880 1711 670735; Email: hasanatdr@yahoo.com
Background: Changes in serum ferritin or iron stores may be associated with abnormal glucose tolerance (AGT).
Objective: To see serum ferritin and HbA1c in newly detected prediabetes and diabetes.
Materials and Methods: Cross sectional study over 200 participants categorized by American Diabetes Association (ADA) 2013 criteria were measured for serum ferritin by using N Latex ferritin and HbA1c by high performance liquid chromatography (HPLC).
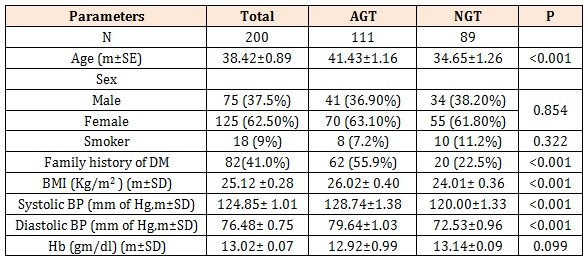
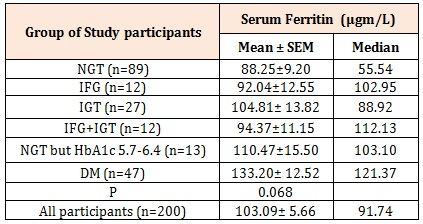
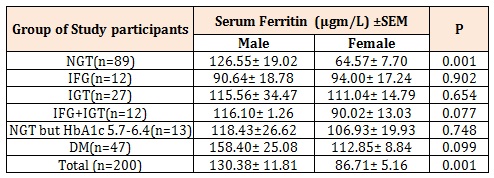
Results: AGT had significantly higher age (41.43±1.16 vs. 34.65±1.26, mean ±SEM; p<0.001) and body mass index (BMI, 26.02±0.40 vs. 24.01±0.36 kg/m2; p<0.001) with more frequent family history of diabetes than normal glucose tolerance (NGT, 55.9% vs. 22.5%, p<0.001). Mean and median ferritin were increased in subgroups of AGT [NGT: 88.25±9.2 and 55.54; impaired fasting glucose (IFG): 92.04±12.55 and 102.95, impaired glucose tolerance (IGT): 104.81±13.82 and 88.92; IFG-IGT: 94.37±11.15 and 112.13; NGT but HbA1c 5.7-6.4%: 110.47±15.50 and 103.10; diabetes mellitus (DM): 133.20±12.52 and 121.37µgm/L respectively; p=0.068]. All subgroups of AGT had HbA1c ≥ 5.7% while that for NGT was < 5.7%. Males had higher ferritin than females [(130.38±11.81 vs. 86.71±5.16 µgm/L, p=0.001); for NGT: 126.55±19.02 vs. 64.57± 7.70 µgm/L, p=0.001, IFG-IGT: 116.10±1.26 vs. 90.02±13.03 µgm/L, p= 0.077 and DM: 158.40±25.08 vs. 112.85±8.84 µgm/L, p=0.099]. Ferritin was higher in hypertensive than that in normotensive (111.89±10.98 vs. 96.23±6.53 µgm/L, p=0.058) as well as in obese AGT than that of obese NGT (118.41±10.25 vs. 76.08±10.47 µgm/L, p=0.009) but not in other weight categories. Both systolic and diastolic BP significantly correlated with ferritin in AGT (r=0.176, p=0.065 and r=0.180, p=0.059 respectively) but not in NGT (r=0.061, p=0.570 and r=0.021, p=0.842 respectively).
Conclusions: Serum ferritin level is higher in AGT especially if obese as well as in hypertension.
Keywords: Ferritin; Diabetes-Prediabetes; HbA1c
Diabetes mellitus (DM) is a metabolic disorder of multiple etiologies. Ferritin is an iron-phosphorusprotein complex which is an index of body iron stores. Scientific evidence has revealed that there exist influences between iron metabolism and Type 2 diabetes mellitus (T2DM). The relationship is bidirectional: iron affects glucose metabolism and glucose metabolism impinges on several iron metabolic pathway [1]. As a result, the association of high serum ferritin level and hyperglycemia in T2DM has become a topic of interest in recent years.
The pathophysiologic mechanism of increased serum ferritin in patients with T2DM remains unclear. Excess iron could theoretically be related to disturbed glucose homeostasis by affecting insulin synthesis and secretion in the pancreas and enhancing lipid oxidation of free fatty acids (FFA) as increased FFA oxidation diminishes glucose utilization in muscle tissue and increases gluconeogenesis in the liver, leading to increased insulin resistance [2]. In addition, accumulating iron could interfere with the insulin extracting capacity of the liver. Elevated ferritin concentrations in diabetes may represent elevated body iron stores, an acutephase reactant, and marker for inflammation [3].
Many studies revealed increased serum ferritin concentration in T2DM patients in the absence of a reciprocal decrease of soluble transferrin receptors in comparison with normal controls. It was found that iron depletion improves vascular dysfunction in T2DM patients with high ferritin concentration [4]. It has also been observed that serum ferritin levels can predict new onset T2DM [1]. Bae et al. found that diabetic microangiopathy is associated with elevated serum ferritin concentration [5].
The present study was aimed to see the serum ferritin level in newly detected diabetic and pre-diabetic individuals in Bangladesh.
Materials and MethodsThis cross-sectional study comprising of 200 newly detected diabetic and pre-diabetic categorized by American Diabetes Association (ADA) 2013 criteria (age, mean± SEM: 38.42±0.89 year; M/F: 75/125; BMI, (kg/m2): 25.12±0.28) was conducted in the department of Endocrinology, Bangabandhu Sheikh Mujib Medical University (BSMMU), Dhaka. The protocol was approved by Institutional Review Board (IRB), BSMMU. Informed written consent was taken from each subject. Patients having disorders like anemia, liver disease, kidney disease, haemochromatosis, chronic infection or inflammation that might interfere with ferritin metabolism were discarded. 5 ml venous blood was collected from each of the participants; serum separated by centrifugation and preserved under -300C until assay. The characteristics of the subjects are shown in Table 1.
Serum ferritin was measured using N Latex ferritin manufactured by Siemens. This is an in-vitro diagnostic reagent for the quantitative determination of ferritin in human serum or heparinized plasma by means of particle enhanced immunonephelometry using BN II and BN Pro Spec System. HbA1c was measured by ionexchange high performance liquid chromatography (HPLC) using the NGSP certified Bio-Rad D-10TM Hemoglobin A1C Program 220-0101, USA.
Statistical Analysis .Data were analyzed using computer based SPSS program (version 22.0). Results were expressed as frequencies (percentages) and/or mean (±SD/SE) as appropriate. Comparison of ferritin and HbA1c between subgroups was done by Student’s unpaired t-test while frequencies were compared by Chi-square test. Pearson’s correlation was used to see correlation among different variables. P value ≤0.05 was considered as significant.
ResultsParticipants with AGT had significantly higher age (41.43±1.16 vs. 34.65±1.26, mean ±SEM; p<0.001), body mass index (BMI), (kg/m2, 26.02±0.40 vs. 24.01±0.36; p<0.001) as well as higher systolic (129±1 vs. 120±1, mm Hg, p<0.001) and diastolic blood pressure (80±1 vs. 73±1, mm of Hg, p<0.001). Family history of diabetes was significantly more frequent in AGT than NGT (55.9% vs. 22.5%, p<0.001) (Table-I). Both mean and median values of ferritin were found increased in the subgroups with AGT (NGT: 88.25±9.2 and 55.54; IFG: 92.04±12.55 and 102.95, IGT: 104.81±13.82 and 88.92; IFG-IGT: 94.37±11.15 and 112.13; NGT but HbA1c 5.7-6.4: 110.47±15.50 and 103.10; DM: 133.20±12.52 and 121.37µgm/L, respectively). Level of ferritin among the subgroups was statistically different (p=0.068) (Table 2).
Comparison of serum ferritin level between male and female within each subclass showed that in most of the subclasses males had higher ferritin level than females which were statistically significant or near significant for NGT (126.55±19.02 vs. 64.57± 7.70 µgm/L, p=0.001), IFG-IGT (116.10±1.26 vs. 90.02±13.03 µgm/L , p= 0.077) and DM (158.40±25.08 vs. 112.85±8.84 µgm/L, p=0.099) as well as when all participants considered together (130.38±11.81 vs. 86.71±5.16 µgm/L, p=0.001) (Table 3).
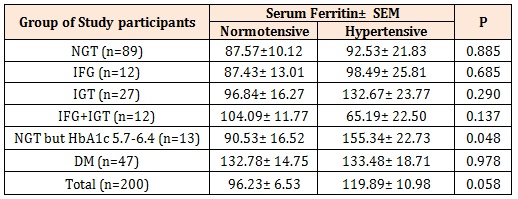
Ferritin level was found to be significantly higher in the hypertensive groups than that of normotensive (111.89±10.98 vs. 96.23±6.53 µgm/L, p=0.058) (Table 4). This was also observed for each subclass though not significant [hypertensive vs. normotensive; NGT: 92.53±21.83 vs. 87.57±10.12 µgm/L, p=0.885, IFG: 98.49±25.81 vs. 87.93±13.01 µgm/L, p=0.685, IGT: 132.67± 23.77 vs. 96.84±16.27 µgm/L, p=0.290, NGT but HbA1c- 5.7-6.4: 155.34±22.73 vs. 90.53±16.52 µgm/L, p=0.048 and DM: 133.48±18.71 vs. 132.78±14.75 µgm/L, p=0.978] while lower in hypertensive group in the subclass of IFG-IGT (65.15±22.50 vs. 104.09±11.77 µgm/L, p=0.137).
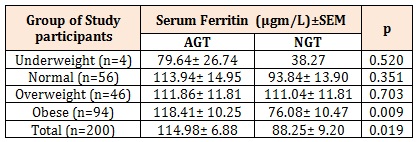
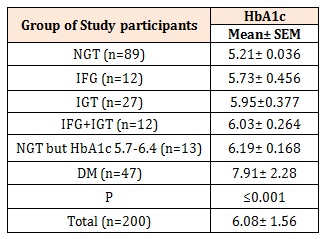
Ferritin level was significantly higher in obese AGT than obese NGT (118.41±10.25 vs. 76.08±10.47 µgm/L, p=0.009). For the ferritin level AGT vs. NGT in the underweight (79.64±26.74 vs. 38.27 µgm/L, p=0.520), normal weight (113.94±14.95 vs. 93.84±13.90 µgram/L, p=0.351) and overweight (111.86±11.81 vs. 111.04±11.81 µgm/L, p=0.703) were not significantly different (Table 5). All subgroups of AGT had HbA1c ≥ 5.7% while that for NGT was < 5.7% (Table 6).
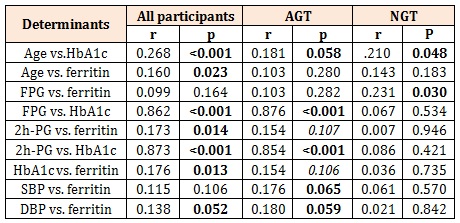
As shown in Table 7, age of the participants correlated with HbA1c (r=0.268, p<0.001) and ferritin (r=0.160, p=<0.023) for all participants but only with HbA1c in AGT (r=0.181, p=0.058) and NGT (r=0.210, p=0.048). HbA1c correlated with ferritin in all participants (r=0.176, p=0.013) and reached near significant level in AGT (r=0.154, p=0.106). Both systolic and diastolic BP significantly correlated with ferritin in AGT (r=0.176, p=0.065 and r=0.180, p=0.059 respectively) but not in NGT (r=0.061, p=0.570 and r=0.021, p=0.842 respectively).
DiscussionThe emerging concept of a causal relationship between high serum ferritin and insulin resistance in predisposing development of abnormal glucose tolerance has not yet been evaluated widely. Present study was intended to see the level of serum ferritin in participants undergoing OGTT for the diagnosis of AGT on an outpatient basis in a tertiary care hospital to assess the probable relationship of ferritin with prediabetes and diabetes along with related risk factor for development of glucose abnormality.
It was observed in the present study that serum ferritin increases with the deterioration of glycemic status in the pre-diabetes and diabetes participants. These findings are in agreement with the observations of some other investigator [6,7]. Serum ferritin positively correlated with HbA1c level in all participants but poorly in AGT; ferritin was found higher in participants with higher HbA1c which are similar to the findings of some investigators abroad [6]. Also serum ferritin was found to be higher with AGT irrespective of body mass index as was found by some others (Raj et al. 2013). Similar to the findings by [6,8,9], ferritin was higher in males than females irrespective of glycemic status. Presence of hypertension was associated with higher serum ferritin level without regard to glycemic status, that is also observed by other investigators [2,6] and in participants with family history of diabetes frequency of AGT and level of ferritin were observed to be higher.
Total enrolled participants were 200 who underwent OGTT and 111 were found to have some degree of AGT whereas 89 had normal glucose tolerance. Highest level of ferritin was observed in DM and subgroups of prediabetes had values below that of DM but above the level of ferritin found in the NGT group. Thus, it appears that the intensity of glucose intolerance may be proportionately related to the increased level of ferritin. This is also reflected by the findings that even in the NGT group FPG positively correlated with ferritin level (which may be applicable for the IFG group of AGT) and the 2h-PG value correlated near significantly with ferritin in AGT and significantly when all participants considered together. 2h-PG value of glucose also correlated with HbA1c in both AGT and in combined group; and HbA1c correlated not in NGT. This is to be explained on the basis that magnitude of glycemic intolerance varies from person to person and there is a linear relationship between two variables when all participants considered together and also in AGT groups. These findings are supported by the findings of other investigators who observed serum ferritin to be higher in the pre-diabetic and diabetic participants [6,7]. Apropos with this, it is to be mentioned that higher ferritin level is associated with insulin resistance which is one of the important factor for the development of AGT [9,10].
As expected HbA1c was found to have increasing trend with subclasses of increasing intensification of dysglycemia. On the other hand, it was found that serum ferritin concentration was higher in participants with HbA1c ≥ 5.7% than that with HbA1c <5.7% in all subclasses of AGT. Therefore, it is pertinent to assume that the increased level of serum ferritin is associated with higher HbA1c level which is an indicator for the assessment over dysglycemia. In agreement with this Sharifi et al. found similar findings of serum ferritin concentration that was higher in participants with increased HbA1c [6].
In the present study, age of the participants with AGT was higher than that of NGT and there was a positive relationship of age with HbA1c in all groups as: AGT, NGT and participants considered together. However, age did not show any significant correlation with serum ferritin either in AGT or in NGT individually despite an observed significant relationship when all participants considered together. Therefore, it is overall age-related increase of ferritin that happened to show relationship when considered in combined group; and should the increased age be the main factor for the abnormal glucose tolerance in AGT group, age should be strongly correlated with ferritin level in the AGT group. However, as mentioned above, age did not significantly correlate with ferritin either in AGT or in NGT. Therefore, increased age may be some factor for glucose abnormality but unlikely to be the causal factor for increased ferritin level observed in this AGT group.
This study observed males had higher serum ferritin concentration than that in females for all subclasses of glycemic status as well as when all participants considered together. Many studies observed similar findings who also found higher mean serum ferritin concentration in males than that in females [2,6,8,9]. Distribution of male and female participants happened to be statistically similar in AGT and NGT. Therefore, the higher ferritin level in AGT and its subclasses is unlikely to be attributable to the present finding of higher ferritin in males. It is wise to think that higher ferritin in AGT and that for males are separate entities. Moreover, ferritin in males is not a priority subject for the present study.
Frequency of positive family history of DM was significantly higher in the AGT than NGT. Serum ferritin level was also found to be higher in the participants with family history of DM signifying a contributory role of family history of DM for increased level of ferritin. Similar findings were also observed by Salem et al. and Psyrogiannis et al. [8,11]. Thus it will be wise to think that family history of DM is a predisposing factor for dysglycemia whereas higher serum ferritin is an association of the dysglycemic state.
BMI, an indicator of nutritional status and obesity, was higher in AGT (>25 kg/m2) than that in NGT (<25 kg/m2). Serum ferritin was found to be higher in AGT irrespective of BMI status (in all groups of underweight, normal weight and obese participants) than those values in the NGT group and the difference reached statistically significant level. Wrede et al. and others have noted higher ferritin level in AGT than that in NGT [2,9,12]. Therefore, it appears that increased level of ferritin is an association of the abnormal glycemic status rather than increased BMI; and overweightobesity may be a risk factor of development of dysglycemia. Serum ferritin was also observed to be higher in the hypertensive participants considered together, with AGT and its subgroups as well as in the NGT; however, level of significance was weak in NGT and DM. In agreement with this, some others have reported higher ferritin level in hypertensive participants [2,6]. On the other hand, systolic and diastolic blood pressure was significantly higher in the AGT group than that of NGT. As a matter of fact, both systolic and diastolic blood pressure strongly correlated with serum ferritin level in AGT group; but there was no such significant correlation of these two variables in the NGT group. Should ferritin be an intimate associated event with blood pressure, it should also show good correlation irrespective of glycemic status in NGT. Hence, it appears justified to constellate that hypertension may be associated with increment of ferritin like that with dysglycemia. Overall, it is followed that dysglycemia which might be predisposed by family history of DM is a central concern for prediabetes, diabetes, overweight-obesity, hypertension – a condition considered as metabolic syndrome.
In conclusion, present study estimated serum ferritin level in newly detected prediabetic and diabetic participants. It is observed that serum ferritin level is higher in participants with AGT and hypertension, whereas higher ferritin values with family history of DM and obesity seems to be an outcome product of these factors which acts as predisposing risk components for development of AGT. Findings of the present study need validation by investigation at wide scale.
AGT= Abnormal Glucose Tolerance, IFG= Impaired fasting glucose.
IGT= Impaired glucose tolerance
IFG+ IGT
HbA1c (5.7-6.4%)
DM= Diabetes Mellitus
NGT= Normal Glucose Tolerance
By Student’s t - test and Chi Square test
Statistical significance stands for AGT vs NGT
Within parenthesis are percentiles over column total
Table 1: Baseline characteristics of study participants (n=200).
IFG= Impaired fasting glucose; IGT= Impaired glucose tolerance;
DM= Diabetes Mellitus,
NGT= Normal Glucose Tolerance
By ANOVA test
Table 2: Serum ferritin level in participants with IFG, IGT, IFG-IGT, DM and NGT.
IFG= Impaired fasting glucose; IGT= Impaired glucose tolerance;
DM= Diabetes Mellitus,
NGT= Normal Glucose Tolerance
By Student’s t- test
Table 3: Serum ferritin (µgm/L) in males and females in different classes of glycemic status.
IFG= Impaired fasting glucose; IGT= Impaired glucose tolerance;
DM= Diabetes Mellitus,
NGT= Normal Glucose Tolerance
By Student’s t- test
Table 4: Serum Ferritin (µgm/L) in hypertensive and normotensive participants.
AGT= Abnormal Glucose Tolerance, IFG= Impaired fasting glucose;
IGT= Impaired glucose tolerance;
IFG+ IGT
HbA1c (5.7-6.4%)
DM= Diabetes Mellitus;
NGT= Normal Glucose Tolerance
By Student’s t – test
Table 5: Serum Ferritin (µgm/L) in different BMI group.
IFG= Impaired fasting glucose; IGT= Impaired glucose tolerance;
DM= Diabetes Mellitus,
NGT= Normal Glucose Tolerance
By ANOVA test
Table 6: HbA1c level in participants with IFG, IGT, IFG-IGT, DM and NGT.
AGT= Abnormal Glucose Tolerance, IFG= Impaired fasting glucose;
IGT= Impaired glucose tolerance;
IFG+ IGT
HbA1c (5.7-6.4%)
DM= Diabetes Mellitus;
NGT= Normal Glucose Tolerance
FPG= Fasting blood glucose
PG = Plasma glucose
SBP=Systolic blood pressure
DBP=Diastolic blood pressure
By Pearson co-relation coefficient test.
Table 7: Correlations.