Citation: Sani A and Hajara I. Total Phenolic Content of Three Samples from the Powdered Stem Bark of Detarium Microcarpum Guill. & Perr. (Fabaceae). Int J Pharmacogn Chinese Med 2017, 1(4): 000119.
*Corresponding author: Sani A, Department of Pharmacognosy and Drug Development, Ahmadu Bello University, Zaria, Nigeria, Tel: 08065619861; Email: sanimazab@gmail.com
Preliminary processing of the plant material was done. The stem cuttings were debarked and the barks dried in an open air under shade. The macroscopical examinations were done. The dried plant materials were powdered. Three different samples of the plant extracts/fraction were used in the determination and the UV-Visible Spectrophotometric Analysis method was adopted. Tannic acid was used as the standard. The absorbences were measured using the Jenway 630 UV-visible spectrophotometer at 570nm against water: methanol blank. The various absorbances obtained were plotted against the corresponding concentrations to obtain a standard calibration curve.
Keywords: Detarium. microcarpum, Absorbances, Calibration-curve, Phenolics, Samples, Spectrophotometer, Tannins
Abbreviations: MCE: Methanolic Plant Extract; RF: Residual Fraction; TF: Tannin Fraction; TAE: Tannic-Acid Equivalence; NILEST: Nigerian Institute of Leather And Science Technology
IntroductionDetarium. microcarpum Guill & perr. belongs to the family Fabaceae. It is commonly called Tallow tree in English. The Hausas from northern Nigeria call it Taura. It is a savannah tree, growing up to 9.114 m, with reddish-brown scaly bark; leaves glaucous beneath; flowers cream in dense inflorescences; fruits are edible, branchlets deciduous; it is a plant of the drier savannahs. Leaflets rounded and usually emarginated at apex, oblong-elliptic, 6-12, alternate: calyx in bud densely pubescent outside; inflorescences congested; leaflets thickly coriaceous, usually about 7-11cm broad, but sometimes smaller, with numerous translucid glanddots; fruits sub orbicular and flattened, about 4cm in diameter and 2.5cm thick, not very fleshy; often forming small abortive or galled fruits [1].
Phenols constitute a very large group of plant secondary metabolites. They are widespread in nature and found in most classes of natural compounds having aromatic moieties. They range from simple structures with one aromatic ring to highly complex polymeric substances such as tannins and lignins. They are important constituents of some medicinal plants and in the food industry eg in Olive oils and garlic (Allium sativum); they are effective antioxidants and utilized as coloring agents, flavourings, aromatizers [2-4]. Phenolic classes of pharmaceutical interest include: (1) simple phenolic compounds, (2) tannins, (3) coumarins and their glycosides, (4) anthraquinones and their glycosides, (5) naphthoquinones, (6) flavones and related flavonoid glycosides, (7) anthocyanidins and anthocyanins, (8) lignans and lignin Figure 1 [5].
Materials and MethodsThe plant material was collected from the wild in vegetation around the settlements in Giwa local Government Area located in Kaduna State, Nigeria. The collection was done in December 16th, 2008. About 1Kg of the stem cuttingswere collected [6]. Another fresh twig comprising all the essential parts used in the identification of plants was collected and taken to the Herbarium unit of the Department of Biological Sciences, Ahmadu Bello University, Zaria forauthentication. A voucher number, 900676 was assigned to the plant sample on 17th December, 2008 by the taxonomists in charge. Preliminary processing of the plant material was done. This includes eliminationof undesirable materials and contaminants, washing to remove soil, sorting andcutting. The bark was removed from the stem cuttings dried in an open air under shade. This wasthen powdered using mortar and pestle [5,6].
Extraction of Plant SamplesFirstly, 1000g of the powdered crude drug was defatted using 5 litre of petroleum ether (60-80°C).The marc obtained from this was subjected to extraction by cold percolation using 1litre of 70% methanol. The filterate obtained was divided into two portions. Tannins were precipitated from one portion using 1% solution of gelatin containing 10% NaCl.This was filtered to separate the precipitated tannins and a filtrate is obtained. The tannins were recovered from the residue by adding another 1 ltr of 99% MeOH to the precipitate obtained and filtered. This dissolves the tannins leaving a residue of gelatin and NaCl. The filterate contains the tannins while the gelatin and the NaCl remains in the precipitates as the residue (or the marc). The filtrate was concentrated over water bath at a controlled temperature and MUST NOT be charred as some phenolics are unstable at certain high temperatures. The resulting extract constitutes the tannin fraction (TF). The filtrate obtained after precipitating the tannins was also concentrated in an evaporating dish over a water bath. This constitutes the Residual Fraction (RF). The second portion of the filterate obtained after defatting was concentrated to obtain the crude extract (MCE) Figure 2.
Determination of Total PhenolicsThe total phenolics of the stem bark of D. microcapum were determined by the UV-Visible Spectrophotometric Analysis method. Here, tannic acid was used as the standard or reference. Five different concentrations of the tannic acid (4, 8, 12, 16, and 20) g/dm3 were prepared. Each was then reacted with a few drops of 1% FeCl3 solution in 50% Methanol at a pH of 7.12. The reaction mixture was allowed to stay at room temperature for about 8-10minutes after which the absorbances were measured using the Jenway 630 UVvisible spectrophotometer at 570nm against water: methanol blank. The various absorbances obtained were plotted against the corresponding concentrations to obtain a standard calibration curve. Thereafter, the plant sample was treated in the same way as the tannic acid [8].
A standard calibration curve of absorbencies against tannic acid concentrations (4-20 g/dm3) was plotted so as to determine the corresponding concentrations of the plant samples to be used in the determination procedure Table 1.
The total phenolic compounds were calculated by the following formula; T=CV/M
Where, T= total content of phenolic compounds in TAE/g
C= concentration of Extract established from the calibration curve in g/dm3
V= volume of extract in ml
M= weight of plant extract in grams
The results were expressed as mg of tannic acid equivalents (TAE)/1g of extract weight.
Results and DiscussionFrom the 1000g of the powdered plant sample, the extract and various fractions had the following yields: the petroleum ether faction (8.6%), Methanolic Crude Extract (41.2%), tannin fraction (10.4%), and the residual fraction (6.5%). The residue and other substances left after the extraction and fractionation processes makes up the remaining 33.3%. This is also shown in Table 2 below.
The graph below was used to determine the values of x (concentrations) from the values of y (absorbances) measured from the UV-VIS Spectrophometer Figure 3.
The R2 value being up to 0.5 is an indication that there is a strong relationship between the absorbance and the concentrations. This means that the absorbance vary with change in concentration or is dependent on the change in concentration. The crude methanolic plant extract (MCE) gave an absorbance of 1nm, tannin fraction (TF) had 0.87nm and the residual fraction (RF) had 0.44nm while the total phenolics were 16mgTAE/g, 15.86 mg TAE/g and 0.14 mg TAE/g respectively Table 3.
ConclusionThese total phenolics as determined in terms of Tannic-Acid Equivalence (TAE) are expressed as 16 mg TAE/g of crude extract weight, 09.86 mg TAE/g of tannin fraction weight and 6.14 mg TAE/g of residual fraction weight. This shows that the crude plant extract still has the highest phenolic content although only slightly different from the ones in the tannin fraction. The residual fraction has the least content of the phenolics. This obviously constitutes other phenolics apart from the tannins since the tannins have been separated from this fraction. This also indicates that amongst the other phenolic compounds, Detariummicrocarpumis richest in tannins as compared to its content of other phenolic compounds
AcknowledgementOur sincere and profound gratitude goes to Mr. Enyeribe Collins and Mr. Jerry Akawu both of Nigerian Institute of Leather and Science Technology (NILEST), Samaru, Zaria who guided immensely with the determination of the total phenolic content of the plant samples. Thank you very much.
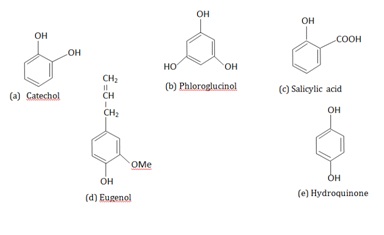
Figure 1: (a-e) Some Simple Phenolic Compounds [5].
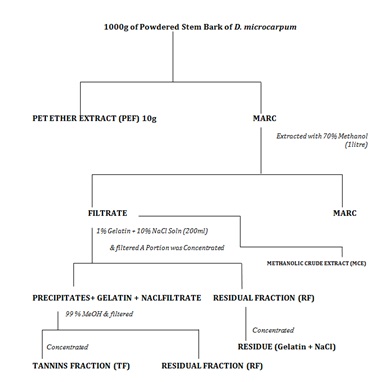
Figure 2: Flow Chart (General Procedure for Preparing Tannin Fraction, Residual Fraction and Crude Extract) [7].
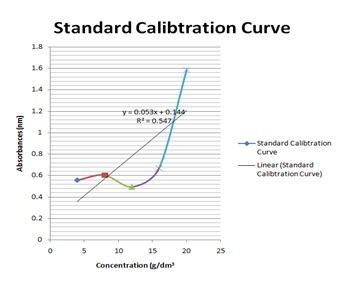
Figure 3: Graph of Absorbance against Concentration of the Samples.
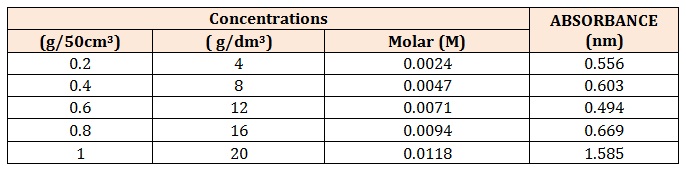
Table 1: Concentrations and Absorbances of the Stem Bark of D. microcarpum.
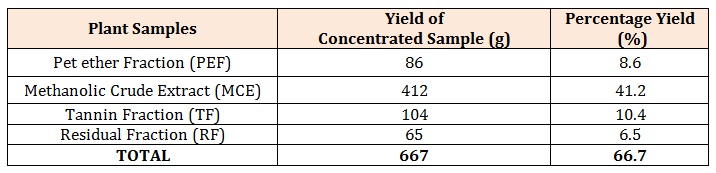
Table 2: Yields of the Extract and Fractions.
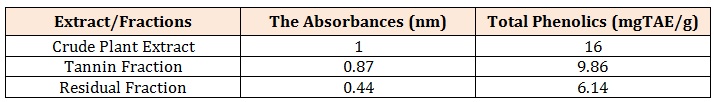
Table 3: Total Phenolics of the three Samples from Powdered Stem Bark of D. microcarpum.