Stroke Volume Variation-Guided Fluid Management Decreased Postoperative Pain in Patients Undergoing Spine Surgery
Background: This study was to evaluate whether stroke volume variation (SVV)-guided fluid management would improve postoperative pain perception, plasma lactate and glucose levels, in-hospital mortality and morbidity, and length of hospital stay, when compared with those guided by central venous pressure (CVP). Methods: Ninety-one patients scheduled for major lumbar spine surgery were randomized into two groups; SVV-guided and CVP-guided groups. Fluid management for the SVV-guided group was based on the SVV and stroke volume index level and the CVP-guided group was based upon the CVP. Repeated boluses of 5 mL/kg crystalloid was given to keep the SVV less than 13% or CVP between 8-13 mmHg, and bolus ephedrine 5 mg was administered to keep the mean blood pressure greater than 65 mmHg. Plasma lactate, glucose, electrolytes, hemoglobin levels, hemodynamic values, and postoperative major and minor complications were recorded. Postoperative pain intensity on movement was the primary outcome; morphine consumption and perioperative lactate levels were the secondary targets. Results: Lactate and glucose levels in both intraoperative and postoperative periods were lower in the SVV than CVP group (p < 0.05). Both pain intensities during movement and at rest were significantly lower in the SVV than CVP group; the trend lasted for three days postoperatively (p < 0.05) although the difference between groups did not be found regarding to the postoperative morphine consumption. The hospital stay was significantly longer in the CVP than SVV group (p < 0.05). Conclusion: SVV-guided fluid management resulted in an improved control of serum lactate and glucose level than in those CVP-guided patients. Three-day postoperative pain intensities and length of hospital stay were significantly lower and shorter, respectively, in the SVV-guided fluid management than in those with CVP-guided. The results suggest using reasonably SVVguided fluid strategy for major spine surgery may get relatively better postoperative pain, lactate, and glucose control.
Strengths and Limitations of this Study
Strengths
The study might be one of the first few studies focuses on the relationship between the goal-directed fluid therapy by protocol and postoperative pain management. SVV-guided fluid management resulted in an improved control of serum lactate and glucose levels lower three- day postoperative pain intensities, as well as shorter length of hospital stay than in those CVP-guided patients.
Limitations
The study design is prospective, non-double blind, and with modest sample size. High-risk patients were excluded from the protocol, which limited the extrapolation for the high-risk patient.
Introduction
The adequacy of intravascular fluid status is important for Anesthesiologists in order to maintain efficient cardiac output and tissue perfusion. Some textbooks suggest a protocol for perioperative fluid management in different kinds of patients to supply basic fluid requirements, replace preoperative deficits, and infuse intraoperative losses (blood loss, intravascular fluid shift, and evaporation) [1]. The strategy for infusing and monitoring fluid status preoperatively is based on the assumption of daily fluid needed, preoperative fasting duration, and the types of surgery, all of which might not been estimated clearly. Although central venous pressure (CVP) is traditionally regarded as a practical guide for fluid status, its sensitivity and specificity for the relationship with fluid responsiveness is poor when compared to other dynamic monitoring methods [2]. Recent publications suggested that goal-directed fluid management guided by perioperative dynamic monitoring reduces the related complication rate, the length of hospital stay, as well as the postoperative mortality rate, improve the healthcare quality and reduces medical cost [3, 4, 5]. These growing evidences on the benefits of perioperative fluid optimization gradually became and constructed one element of enhanced recovery after surgery (ERAS) program, which resulted in faster recoveries and better outcomes [6]. Stroke volume variation (SVV), one of hemodynamic measurement of pre-load responsiveness, derived from the minimally invasive arterial wave courter variations due to cyclically controlled mechanical ventilation-induced trans-pulmonary pressure changes. Its simplicity, accuracy and availability have been showed to provide a more accurate measure of fluid responsiveness than CVP does. Previous experiments have shown that optimization of fluid management, using goal-directed therapy in surgical patients is helpful in preventing or treating tissue hypoxia [7], ischemia- reperfusion injury, and furthermore decreasing postoperative infection and postoperative renal and gastrointestinal complications [4, 8]. Theoretically, once ischemia damages tissue, multiple chemical mediators release from the damaged tissue and inflammatory cells by nociceptive conditions. We hypothesized that optimizing the perioperative fluid management by goal- directed hemodynamic monitoring would improve the tissue perfusion and reduce the hypervolemia or hypovolemic induced hypoxia or ischemia, resulting in decreased postoperative pain intensity.
Methods
Patient population
This prospective, single blind, controlled study protocol received approval from the Ethics Committee of Kaohsiung Veterans General Hospital (approval number VGHKS13-CT4-07), where is 1500-beds teaching hospital, and registered retrospectively in a public website platform of ClinicalTrials.gov (Register number: NCT02245581 at 2014-09-18). Successive patients (American Society of Anesthesiologists physical status class I-III, from Mar-2013 to Nov-2013) scheduled for elective major posterior lumbar spine surgery (decompression only or simple fusion surgery of one to three disk levels in a single surgical approach) on prone position were included in the study. All participates gave a written informed consent prior to enrolling into the study. Patients with known significant cardiac myocardial infarction or arrhythmias, respiratory, or endocrine disease, younger than 20 years of age, older than 80 years of age, or body mass index (BMI) greater than 32 kg/m2, were excluded.
Randomization and intervention
Participants were randomized to either the SVV group or the CVP group by using computer-generated random number. A nurse anesthetist, who is not involved in the participants’ assignment, produced the randomization sequence using a computer-generated online random number program (www.randomization.com) with the block size of four with a 1:1 ratio for allocation. The allocation was sequentially numbered and sealed into an opaque envelope confidentially. When the patient was transferred to the operating room (OR), another nurse anesthetist, who was not involved in the study, opened the envelope and decided the participant’s group. The study is not double blind due to the anesthesiologist in charge at OR and the participates would know which group they were allocated from the location of either arterial or venous catheter insertion wound.
Anesthesia
For all patients, anesthesia was induced with protocol 2-4 mg/kg, Fentanyl 2-4 μg/kg, and atracurium 0.4-0.6 mg/kg to provide skeletal muscle relaxation and facilitate endotracheal intubation. The anesthesia depth was maintained with sevoflurane 2.1-4.2% (1-2 minimal alveolar concentration), Fentanyl 1-2 μg/kg/h, and atracurium 0.05-0.1 mg/kg/h. The patients were ventilated by volume-control mode to give 8-10 mL/kg of tidal volume without positive end-expiration pressure, and the inspiration/expiration ratio was set at 1:2. The ventilation frequency was set at 8-12 cycles/min to keep end-tidal CO2 around 30-35 mmHg. We continuously monitored patients’ heart rate, blood pressure, and oxygen saturation using an anesthesia machine (AESTIVA 5™; Datex Ohmeda Inc, Madison, WI). A 20-G catheter (B. Braun, Arteriofix 20-G 80mm) was inserted in right or left radial artery for continuous arterial blood pressure monitoring in all patients. A central venous access catheter (Certofix® Duo, B. Braun, Double-Lumen Central Venous Catheter, 7 F) was placed in right internal jugular vein in patients in the CVP-guided groups after the endotracheal tube placement and hemodynamic stabilization. Patients in the SVV-guided group were monitored with the Vigileo/Flo Trac device (Edwards Life Sciences, Irvine, CA, USA) with third-generation software (version 3.06) connected to the radial arterial catheter, allowing for automatic and continuous monitoring of stroke volume (SV).
Fluid management
We used the SVV to guide intraoperative fluid management in SVV-guided group; its sensitivity and specificity have been established on cardiac output and fluid responsiveness. For the patients in the SVV-guided group, 500 mL lactated Ringer’s solution was given during induction of anesthesia and further infusion of 2-3 mL/kg/h of lactated Ringer’s solution for maintenance. After the patient was placed to prone position on a modified Relton–Hall frame, supporting patient’s chest and pelvis with abdomen free, the following fluid management was guided by the SVV levels. If SVV was consistently greater than 13% for five consecutive data records (about 100 seconds, acquiring each data record about 20 seconds) when the patients was kept prone and stable without surgical manipulation, a bolus of 5 mL/kg lactate Ringer’s solution was given during the course of ten minutes. The infusion was repeated every 10 minutes if SVV levels remained greater than 13%. If the SVV levels was kept at less than 13% and the stroke volume index (SVI) at less than 40 mL/m2, repeated bolus dose of in otropic with epinephrine 50 μg intravenously was given as needed to maintain the SVI at greater than 40 mL/m2.In contrast, repeated bolus doses of diuretic with fur osemide 5 mg intravenously were given every 15 minutes as needed to avoid the SVI at greater than 50 mL/m2. If SVV levels was kept at less than 13% and the SVI was also kept at between 40-50 mL/m2, repeated bolus doses of ephedrine 5 mg was given intravenously to keep the mean blood pressure (MBP) at greater than 65 mmHg. The algorithm was modified from McGee et al. [9] (Figure 1).
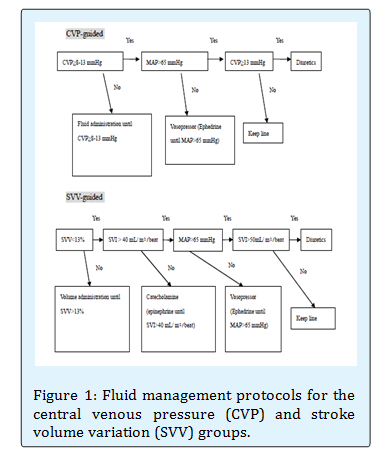
For the patients in the CVP-guided group, an identical fluid infusion protocol was given during the induction of anesthesia as in the SVV-guided group. When the patient was moved to a stable prone position, repeated bolus doses of 5 mL/kg lactated Ringer’s solution was given every 10 minutes to keep the central venous pressure at 8-13 mm Hg. The measurement of CVP was performed when the patients was prone, stable, and without surgical manipulation at the end-expiration end-diastolic phase. Repeated bolus doses of furosemide 5 mg were given every 15 minutes if the CVP level was over 13 mmHg. When CVP levels were kept between 8-13 mmHg, repeated bolus doses of ephedrine 5 mg were given intravenously to keep the MBP at greater than 65 mmHg. The algorithm was modified from Trzeciak et al. [10] (Figure 1).
Outcomes
Arterial blood was withdrawn at the time before skin incision, two hours after skin incision, and one hour after the end of surgery. Those blood samples were sent for the analysis of the electrolytes, hemoglobin, plasma partial pressure of oxygen (PaO2) and carbon dioxide (PaCO2) of the arterial blood, plasma glucose, and lactate concentrations by using an NOVA CCX analyzer (Nova Biomedical, Waltham, MA, USA). Intraoperative hemoglobin level was continuous monitored by a non- invasive Pulse CO-Oximetry™ (Masimo Corp., Irvine, CA). Repeated packed red blood cell 250 mL was transfused to keep the perioperative hemoglobin higher than 10 mg/dl for each patient. After surgery, each patient received a standardized intravenous Patient-controlled Analgesia (PCA)with an Abbott infusion pump (Aim® plus, Abbott Laboratories, USA), which was programmed to administered 2.5 mL/bolus (1 mg of morphine per bolus) with a 20 mg (50 mL) morphine limit for4-hoursand lockout 5 minutes among boluses. A loading dose of morphine 4mg (10 mL) was given intravenously to each patient. The regimen for PCA was prepared under a sterile hood with laminar flow in the Pharmacy Department. Patients used PCA continuously for three postoperative days (POD1 to POD3).The pain intensities during coughing or movement (VASM) and at rest (VASR) were evaluated and recorded using the visual analogue scales (VAS: 0-10) scoring system daily. Opioid-related side effects, such as nausea, vomiting, pruritus, and dizziness, were recorded and treated. Severe nausea or vomiting was treated with 5 mg dexamethasone intravenously, and severe pruritus was treated with 10 mg chlorphenir amine male ate intravenously every 8 hours as required. In patients with respiratory depression (respiratory rate ≤ 8 breaths/min), the PCA was discontinued from the patient and nalox one 0.01 mg/kg was administered intravenously at 5 minute intervals. Each sedation level was recorded according a 4-point scale (0 = awake and alert; 1 = mildly sedated, easily aroused; 2 = moderately sedated, aroused by shaking; 3 = deeply sedated, difficult to arouse even by shaking). Patient satisfaction with the pain management using the VAS score (0-10) was recorded at the end of the PCA. When patients discharge from the postoperative room, a nurse anesthetist removed the arterial catheters of the patients in the SVV group and the central venous catheters of the patients in the CVP group. Postoperative lactated Ringer’s solution was infused at a rate of 1.0-1.5 mL/kg/h for each patient. A postoperative care nurse anesthetist, who was blind as to the patient grouping, identified, collected, and recorded events of postoperative complications and hospital length of stay during the period after surgery. Major complications included the diagnosis of acute myocardial infarction, respiratory failure, pulmonary embolism, pneumonia of known or unknown origin, or strokes were recorded on the hospital chart. Minor complications included incision wound bleeding, hematoma, disruption of the operative incision, or wound infection. Pain intensity as measured by visual analog scale during movement (VASM) was the primary outcome. Morphine consumption administrated through patient-controlled analgesia (PCA) and perioperative blood measurements, such as lactate and glucose concentrations, were the secondary outcomes.
Statistical Analysis
A pilot study involving 10 patients (5 patients per group) was executed for the power analysis. 20% improvement of the primary outcome (pain intensity during movement at postoperative day one) was considered as clinically significant. A sample size of at least 45 patients per group was calculated for anα error of 0.05 (2-sided) with a power of 90%.Data are expressed as means ± standard deviations (SD) or numbers (percentage). Student's t test was used to compare normally distributed continuous parametric variables. The Mann-Whitney U test or Kruskal-Wallis test was used to examine the nonparametric data. The changes of VASR and VASM in each group were analyzed by one-way ANOVA for multiple comparisons procedure. Χ2 or Fisher's exact test, as appropriate, was used to compare categorical data. Homogeneity of variances was verified using the Levine’s test. A P value <0.05 was considered statistically significant. Data were analyzed using SPSS for Windows (Statistical package for Social Sciences, 16.0; SPSS Inc., Chicago, IL, USA).
Results
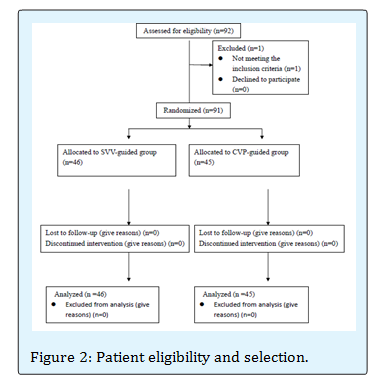
Ninety-two patients were enrolled into the study. One patient did not meet the inclusion criteria due to moderate chronic obstructive pulmonary disease; 91 patients were included in the study analysis. No patient withdrew from the protocol. There were 46 and 45 patients in the SVV and CVP-guided groups, respectively. (Figure 2) Table 1 shows the patients' demographic data and history.
There was no difference between the SVV-guided and the CVP-guided group in age, weight, height, gender, ASA classification, or the patient history of hypertension, cigarette smoking, or alcohol ingestion. Table 2 lists the perioperative measurements and comparisons between the two groups. There was no differences in the total volume of fluid infused, total blood loss, total blood volume infused, total urine output, and duration of surgery between the two groups. There was a statistically significant difference in the average hospital length of stay (days) between groups (SVV vs. CVP-guided group; 5.3 ± 1.3days vs. 7.2 ± 1.4 days, respectively, P = 0.003). There were no differences in the preoperative baseline measurements. However, the intraoperative and postoperative measurements from arterial blood showed that lactate and glucose levels were significantly lower in the SVV-guided group than in the CVP-guided group (P < 0.05). The incidence of minor complications did not differ between the two groups, and no patient encountered a major complication during the hospitalization. Table 3 shows postoperative pain intensity and cumulative morphine consumptions between the two groups. During movement or at rest, the postoperative pain intensities were significantly lower in the SVV-guided group than in the CVP-guided group from postoperative day one (POD1) until day three (POD3), nonetheless, the cumulative morphine consumption showed no difference between the groups. The incidence of postoperative nausea and vomiting (PONV) was similar between the groups.
- SVV-guided group
- CVP-guided group
- Mean
- SD
- Mean
- SD p-value
- Age (years)
- 63.8
- 13.8
- 63.1
- 10.9
- 0.820
- Weight (kilograms)
- 64.8
- 9.7
- 63.7
- 9.2
- 0.605
- Height (centimeters)
- 160.8
- 8.0
- 155.8
- 7.5
- 0.055
- Gender Male/Female
- 22/24
- 25/20
- 0.299
- ASA I/II/III
- 5/26/15
- 3/23/19
- 0.687
- Personal history Hypertension
- Yes/No
- 21/25
- 22/23
- 0.461
- Cigarette smoking
- Yes/No
- 4/42
- 5/40
- 0.478
- Alcohol drinking
- Yes/No
- 8/38
- 7/38
- 0.519
Table 1: Demographic data.
| SVV-guided group | CVP-guided group | |||||||||
|---|---|---|---|---|---|---|---|---|---|---|
| Mean | SD | Mean | SD | p-value | ||||||
| Intraoperative fluid infusion (mL) | 1483.1 | 830.1 | 1679.3 | 913.0 | 0.643 | |||||
| Total blood infusion (mL) | 630.0 | 188.2 | 536.3 | 154.5 | 0.440 | |||||
| Total blood loss (mL) | 960.5 | 260.8 | 985.7 | 200.9 | 0.502 | |||||
| Total urine output (mL) | 903.8 | 283.6 | 732.9 | 374.6 | 0.206 | |||||
| Surgery duration (hour) | 3.6 | 1.6 | 3.3 | 1.8 | 0.515 | |||||
| Hospital length of stay (day) | 5.3 | 1.3 | 7.2 | 1.4 | 0.003* | |||||
| Preoperative measurements | ||||||||||
| Serum lactate (mmol/L) | 1.2 | 0.4 | 1.3 | 0.4 | 0.700 | |||||
| Total Bilirubin(mg/dL) | 0.6 | 0.3 | 0.6 | 0.1 | 0.898 | |||||
| Creatinine (mg/dL) | 1.5 | 0.2 | 0.9 | 0.2 | 0.319 | |||||
| Serum pH | 7.4 | 0.1 | 7.4 | 0.1 | 0.670 | |||||
| Serum paCO2 (mmHg) | 35.9 | 4.2 | 36.3 | 4.8 | 0.211 | |||||
| Serum paO2 (mmHg) | 266.4 | 60.3 | 249.7 | 62.7 | 0.231 | |||||
| Serum Hemoglobin (g/dL) | 12.2 | 1.6 | 12.3 | 1.0 | 0.782 | |||||
| Serum Na (mmol/L) | 137.4 | 2.9 | 138.4 | 2.5 | 0.113 | |||||
| Serum K (mmol/L) | 3.8 | 0.5 | 3.8 | 0.4 | 0.868 | |||||
| Serum Ca (mmol/L) | 1.7 | 1.2 | 1.8 | 1.2 | 0.945 | |||||
| Serum Glucose (mg/dL) | 178.9 | 44.0 | 195.3 | 41.1 | 0.246 | |||||
| Intraoperative measurements | ||||||||||
| Serum lactate (mmol/L) | 1.4 | 0.7 | 2.1 | 0.7 | 0.017* | |||||
| Total Bilirubin(mg/dL) | 0.7 | 0.5 | 0.6 | 0.4 | 0.257 | |||||
| Creatinine (mg/dL) | 2.1 | 0.2 | 0.8 | 0.2 | 0.530 | |||||
| Serum pH | 7.4 | 0.1 | 7.4 | 0.1 | 0.894 | |||||
| Serum paCO2 (mmHg) | 35.7 | 4.0 | 35.2 | 3.8 | 0.528 | |||||
| Serum paO2 (mmHg) | 236.9 | 80.2 | 238.5 | 85.7 | 0.934 | |||||
| Serum Hemoglobin (g/dL) | 11.2 | 1.4 | 11.0 | 1.2 | 0.688 | |||||
| Serum Na (mmol/L) | 138.7 | 2.6 | 139.2 | 2.5 | 0.401 | |||||
| Serum K (mmol/L) | 3.6 | 0.4 | 3.8 | 0.7 | 0.187 | |||||
| Serum Ca (mmol/L) | 1.4 | 0.4 | 1.1 | 0.1 | 0.237 | |||||
| Serum Glucose (mg/dL) | 136.2 | 47.7 | 169.3 | 53.3 | 0.035* | |||||
| Postoperative measurements | ||||||||||
| Serum lactate (mmol/L) | 1.1 | 0.3 | 1.8 | 0.2 | 0.047* | |||||
| Total Bilirubin(mg/dL) | 0.7 | 0.2 | 0.6 | 0.1 | 0.854 | |||||
| Creatinine (mg/dL) | 1.4 | 0.2 | 0.8 | 0.2 | 0.147 | |||||
| Serum pH | 7.4 | 0.1 | 7.4 | 0.1 | 0.906 | |||||
| Serum paCO (mmHg) 2 | 37.9 | 4.1 | 38.3 | 4.0 | 0.283 | |||||
| Serum paO (mmHg) 2 | 135.4 | 40.3 | 129.7 | 32.6 | 0.132 | |||||
| Serum Hemoglobin (g/dL) | 12.5 | 1.1 | 12.8 | 1.7 | 0.819 | |||||
| Serum Na (mmol/L) | 136.2 | 2.0 | 139.4 | 2.1 | 0.313 | |||||
| Serum K (mmol/L) | 3.9 | 0.3 | 3.9 | 0.4 | 0.861 | |||||
| Serum Ca (mmol/L) | 1.8 | 0.5 | 1.7 | 0.4 | 0.957 | |||||
| Serum Glucose (mg/dL) | 160.0 | 44.0 | 193.0 | 35.1 | 0.048* | |||||
| Minor complications | 2/46 | 4.3% | 3/45 | 6.7% | 0.613 | |||||
| Major complications | 0/46 | 0% | 0/45 | 0% | N/A | |||||
| Data are presented as mean and SD or number and percentile.*P< 0.05; N/A: not | applicable. | |||||||||
| SVV-guided group | CVP-guided group | |||||||||
| Mean | S.D. | Mean | S.D. | P-value | ||||||
| POD 1 | VASM | 4.8 | 0.7 | 5.9 | 1.0 | 0.029* | ||||
| VASR | 2.2 | 0.6 | 3.6 | 0.9 | 0.005* | |||||
| CMD (ml) | 71.0 | 15.1 | 66.5 | 21.9 | 0.730 | |||||
| PONV | 11/46 | 13/45 | 0.640 | |||||||
| POD 2 | VASM | 3.5 | 0.7 | 4.9 | 1.0 | 0.007* | ||||
| VASR | 1.3 | 0.5 | 2.6 | 0.6 | < 0.001* | |||||
| CMD (ml) | 108.9 | 39.1 | 126.0 | 34.7 | 0.451 | |||||
| PONV | 7/46 | 8/45 | 0.784 | |||||||
| POD 3 | VASM | 2.5 | 0.8 | 4.1 | 0.8 | 0.022* | ||||
| VASR | 1.0 | 0.4 | 2.1 | 0.4 | 0.010* | |||||
| CMD (ml) | 140.2 | 63.1 | 162.5 | 45.1 | 0.604 | |||||
| PONV | 3/46 | 2/45 | 1.000 | |||||||
| Satisfaction | 8.8 | 0.7 | 8.6 | 0.7 | 0.276 | |||||
| POD : postoperative day one; POD : postoperative day two; POD : postoperative day three. 1 2 3 | ||||||||||
| VASM: Visual analogue scale during movement. | ||||||||||
| VASR: Visual analogue scale at rest. | ||||||||||
| CMD: cumulative morphine dose, 1 ml = 0.4 mg | ||||||||||
| PONV: postoperative nausea and vomiting |
| Discussion |
We found that SVV guided perioperative fluid management for the major posterior spine surgery resulted in perioperative infusion of similar fluid volumes and lower plasma lactate and glucose levels during and after surgery. The postoperative pain intensities during movement and at rest were lower in the SVV-guided group than the CVP-guided group on postoperative day one to three. Many benefits are recognized for the goal- directed fluid therapy in the surgical patients. We employed perioperative goal-directed fluid therapy in major spine surgery and specifically utilized postoperative pain intensity as the main primary outcome. We found that SVV-guided fluid management improved postoperative pain condition (Table 3) and decreased intraoperative and postoperative lactate and glucose levels (Table 2). Although the underlying mechanism for reduced pain intensity with the SVV- guided fluid management patient is unclear and likely complex, recent studies suggest that an ischemic pain mechanism is a potential mechanism [11]. In animal studies, tissue acidosis and lactate increased in the incision wounds facilitated nocicept or activation and enhanced pain behaviors [12]. Previous studies have shown that optimization of hemodynamic and fluid management, using goal-directed therapy, in high risk patients is helpful in preventing and treating tissue hypoxia, thus reducing mortality and morbidity [7]. Additionally, tissue microcirculation and oxygen tension were improved by goal-directed colloid fluid infusion when compared to restrictive fluid infusion in both healthy and anastomosis colon [13]. We did not measure patients’ wound tissue pH or lactate due to the potential for increasing wound infection, nonetheless, we supposed optimizing haemodynamic with SVV-guided goal-directed fluid therapy in surgical patients would improves the tissue circulation, prevent ischemia-reperfusion injury, and thus, decrease postoperative pain intensity. Excessive postoperative pain intensities after major surgeries in adult’s leads to delayed ambulation, increased pulmonary complications, hospital lengths of stay, and lasting functional impairment [14, 15]. Our results show that pain intensity of the patients in the SVV-guided group was lower than in the CVP-guided group, regardless rest or movement. The results imply the approach to fluid optimization by goal-directed management decrease hypervolemia induced ischemia or hypervolemia induced edema, and thus, decrease pain intensity. It is unclear the reason why the postoperative morphine consumption by patients of the SVV-guided group demonstrated no significant difference when compared with those of CVP- guided group during postoperative three days even if the pain intensity showed significant difference between groups. The small sample size (the calculation based on the power of 0.8 and the measure for pain intensity on movement decreased by 20% during the postoperative day one) and the small effect size (= 0.24 for the morphine consumption at POD1) might make us hard to distinguish the effect from the random. In addition, as the pain intensity at rest (VASR) was consistently lower than three during the study period and the overall satisfaction score higher than 8.5, the better-than-average pain management would further limit the postoperative morphine consumption by patients. The position change from supine to prone might infer to an underlying physiologic and hemodynamic variations. Different prone positions also have different impact on the measurement of hemodynamic values [16]. However, Biais et al. demonstrated that only a slightly increase for pulse pressure variation or stroke volume variation has been observed during the change from the supine to the prone position, its accuracy and reliability did not be altered to predict the fluid responsiveness during the prone position [17]. The optimal threshold value or trigger value for the prone position is not yet been defined conclusively in the literatures, Biais et al. suggested 14% might be provide a better sensitive and specificity in their study with 30 participates. There is no significant modification with the trigger value in the supine position; we continued to use 13% as the trigger value as we do in the supine position. Our results showed no difference in the total volume of fluid infused between the two groups. The total perioperative volume of fluid infusion was primarily related to the duration of surgery, baseline fluid status of patient, the goals of the health provider set, and the volume and timing of blood loss/blood transfused. Previous literatures indicated that with SVV goal-directed fluid management the patients received more colloid during elective intra-abdominal surgery as compared to fluid management by traditional routine [18]. Additionally, Lopes et al. demonstrated that the average volume of fluids infused intra-operatively was greater in the group guided by pulse pressure variation [19]. On the contrary, Forget and colleagues found that intraoperative crystalloids and total volume infused were significantly lower in the goal-directed pulse oximetry plethysmography variability index-guided group [20]. The inconclusive results regarding fluid volume infused perioperative might be explained by the types and durations of different surgery, or by the variation of patient’s fluid status; hypervolemia in some patients and hypervolemia in other patients, or by the use of different protocols/algorithms, in which the fluid infusion rate varied at times. Lactate is the product of tissue hypo- perfusion or hypoxia-induced anaerobic glycol’s is. It provides an indirect but sensitive indicator of tissue perfusion and is obviously related with the sufficiency of intravascular fluid volume, organ hypoxia, and energy failure from blood flow reperfusion [21]. Lactate concentrations would bede creased by optimizing the fluid status and cardiac preload [4, 19]. High plasma lactate level (≥ 2 mmol/L) is associated with 2-5 fold increase in 28-days mortality rate as compared to those patients with lactate level ≤ 2 mmol/L [22]. Thus, serum lactate became a potentially useful indicator of tissue perfusion especially in sepsis or shock patients. Our results showed that the lactate concentration was lower in the SVV-guided group for intraoperative and postoperative measurements than in the CVP-guided group; though most lactate level were less than 2 mmol/L. Perioperative infusion of lactated Ringer’s solution has less of an effects on plasma lactate level, even in patients with impaired lactate clearance [23] Our protocol used the lactated Ringer’s solution as baseline and supplemental solution throughout the operative procedure in relatively health patients at a rate of 2-3 mL/kg/h during a period of 3-5 hours of surgery, which volume was expected had no inferential bias on serum lactate measurements. Glucose provides sufficient energy and prevents hypoglycemia during the perioperative period. Maintenance of glucose homeostasis is a major concern for health providers. Some authors suggest hyperglycemia and glucose variability are predictive of postoperative mortality and morbidity in pediatric patients [24]. Excessive oxidative stress overproduction, mitochondrial damage, or/ and coagulation impairment induced by hyperglycemia are potential mechanisms of action [25]. More strict glucose control is discussed, it remains controversial, with issues of safety and efficacy for the “intensive glucose control” (defined as target plasma blood glucose, 80-110 mg/dL) [26]. Our study was based on the traditional liberal blood glucose control and no patients received insulin therapy during anesthesia. Our results showed that the blood glucose concentration was modestly lower in the SVV-guided group than in the CVP-guided group (Table 2); and most patients’ blood glucose were be controlled less than 200 mg/dL in both groups, which means that optimizing fluid management guided by SVV during surgery provided better glucose control. Recent experiment reported that perioperative “high glucose control” with plasma glucose concentrations greater than 200 mg/Dl suppresses various aspects of immune function. These included chemo taxis, phagocytosis, and generation of reactive oxygen species, intracellular killing of bacteria, and increased circulating inflammatory cytokine concentration [27]. All of these conditions led to poor outcomes. The suggestion for perioperative glucose concentration has not yet been conclusive, further randomized controlled studies are necessary to explore the issues. The average length of hospital stay for major spine surgery was significantly different between the two groups (SVV-guided vs. CVP-guided group; 5.3 ± 1.3 vs. 7.2 ± 1.4 days, respectively, P = 0.003). A reduction of hospital stay would lead to health care cost savings. However, the criteria for patient administration and discharge are confounded by the individual surgeon decision-making, preoperative physical and economic conditions of the patient, and post-discharge factors [28]. A hospital related total budgets payment system in Taiwan would further impact the decision making for the timing of patient discharge from hospital. Our study has a few limitations. We did not include high-risk patients with major cardiac or pulmonary disease; thus, our results should not be extrapolated to those high-risk patients. Since the introduction of blood pressure-based or stroke volume-based variation into clinical use to monitor the fluid management in 1990, the possibility of “learning contamination” of individual anesthesiologist might be a potential source of bias [29]. In conclusion, the use of SVV-guided fluid management was associated with better control for lactate and glucose levels, and reduced postoperative pain at rest and on movement for the first postoperative three days after major spine surgery. The hospital length of stay was shorter in the SVV-guided group than CVP-guided group. The results suggest that SVV-guided fluid management leads to optimal fluid volume compared with CVP-guided and avoids the cascades of tissue hypo perfusion.
References
-
Kaye AD (2011) 23 Fluid Management. Basics of Anesthesia: Expert Consult 2(40): 364.
-
Cavallaro F, Sandroni C, Antonelli M (2008) Functional hemodynamic monitoring and dynamic indices of fluid responsiveness. Minerva Anestesiol 74(4): 123-135.
-
Hamilton MA, Cecconi M, Rhodes A (2011) A systematic review and meta-analysis on the use of preemptive hemodynamic intervention to improve postoperative outcomes in moderate and high-risk surgical patients. Anesth Analg 112(6): 1392-1402.
-
Dalfino L, Giglio MT, Puntillo F, Marucci M, Brienza N (2011) Haemodynamic goal-directed therapy and postoperative infections: earlier is better. A systematic review and meta-analysis. _C_rit Care 15(3): R154.
-
Lawson EH, Hall BL, Louie R, Ettner SL, Zingmond DS, et al. (2013) Association between occurrence of a postoperative complication and readmission: implications for quality improvement and cost savings. Annals of surgery 258(1): 10-18.
-
Lassen K, Soop M, Nygren J, Cox PB, Hendry PO, et al. (2009) Consensus review of optimal perioperative care in colorectal surgery: Enhanced Recovery After Surgery (ERAS) Group recommendations. Archives of surgery 144(10): 961-969.
-
Gurgel ST, do Nascimento P Jr (2011)Maintaining tissue perfusion in high-risk surgical patients: a systematic review of randomized clinical trials. Anesth Analg 112(6): 1384-1391.
-
Giglio MT, Marucci M, Testini M, Brienza N (2009)Goal-directed haemodynamic therapy and gastrointestinal complications in major surgery: a meta-analysis of randomized controlled trials. Br J Anaesth 103(5): 637-646.
-
McGee WT (2009) A simple physiologic algorithm for managing hemodynamics using stroke volume and stroke volume variation: physiologic optimization program. Journal of Intensive Care Medicine 24(6): 352-360.
-
Trzeciak S, Dellinger RP, Abate NL, Cowan RM, Stauss M, et al. (2006) Translating research to clinical practice: a 1-year experience with implementing early goal-directed therapy for septic shock in the emergency department. Chest 129(2): 225-232.
-
Pogatzki-Zahn EM, Zahn PK, Brennan TJ (2007) Postoperative pain--clinical implications of basic research. Best Pract Res Clin Anaesthesiol 21(1): 3- 13.
-
Kim TJ, Freml L, Park SS, Brennan TJ (2007)Lactate concentrations in incisions indicate ischemic-like conditions may contribute to postoperative pain. J Pain 8(1): 59-66.
-
Kimberger O, Arnberger M, Brandt S, Plock J, Sigurdsson GH, et al. (2009)Goal-directed colloid administration improves the microcirculation of healthy and perianastomotic colon. Anesthesiology 110(3): 496-504.
-
Feldt KS, Oh HL (2000) Pain and hip fracture outcomes for older adults. Orthopaedic nursing / National Association of Orthopaedic Nurses 19(6): 35-44.
-
Shea RA, Brooks JA, Dayhoff NE, Keck J (2002) Pain intensity and postoperative pulmonary complications among the elderly after abdominal surgery. Heart & lung : the journal of critical care 31(6): 440-449.
-
Edgcombe H, Carter K, Yarrow S (2008) Anaesthesia in the prone position. British Journal of Anaesthesia 100(2): 165-183.
-
Biais M, Bernard O, Ha JC, Degryse C, Sztark _(_2010)F Abilities of pulse pressure variations and stroke volume variations to predict fluid responsiveness in prone position during scoliosis surgery. British Journal of Anaesthesia104(4): 407-413.
-
Benes J, Chytra I, Altmann P, Hluchy M, Kasal E, et al. (2010) Intraoperative fluid optimization using stroke volume variation in high risk surgical patients: results of prospective randomized study. Crit Care 14(3): R118.
-
Lopes MR, Oliveira MA, Pereira VO, Lemos IP, Auler JO Jr, et al. (2007) Goal-directed fluid management based on pulse pressure variation monitoring during high-risk surgery: a pilot randomized controlled trial. Crit Care 11(5): R100.
-
Forget P, Lois F, de Kock M (2010)Goal-directed fluid management based on the pulse oximeter-derived pleth variability index reduces lactate levels and improves fluid management. Anesth Analg 111(4): 910-914.
-
Valenza F, Aletti G, Fossali T, Chevallard G, Sacconi F, et al. (2005) Lactate as a marker of energy failure in critically ill patients: hypothesis. Crit Care 9(6): 588- 593.
-
Mikkelsen ME, Miltiades AN, Gaieski DF, Goyal M, Fuchs BD, et al. (2009) Serum lactate is associated with mortality in severe sepsis independent of organ failure and shock. Crit Care Med 37(5): 1670-1677.
-
Marino PL, Sutin KM (2012)The ICU Book: Wolters Kluwer Health.
-
Hirshberg E, Larsen G, Van Duker H (2008) Alterations in glucose homeostasis in the pediatric intensive care unit: Hyperglycemia and glucose variability are associated with increased mortality and morbidity. Pediatric critical care medicine : a journal of the Society of Critical Care Medicine and the World Federation of Pediatric Intensive and Critical Care Societies 9(4): 361-366.
-
Du XL, Edelstein D, Rossetti L, Fantus IG, Goldberg H, et al. (2000) Hyperglycemia-induced mitochondrial superoxide overproduction activates the hexosamine pathway and induces plasminogen activator inhibitor-1 expression by increasing Sp1 glycosylation. Proceedings of the National Academy of Sciences of the United States of America 97(22): 12222-12226.
-
Lipshutz AK, Gropper MA (2009) Perioperative glycemic control: an evidence-based review. Anesthesiology 110(2): 408-421.
-
Montori VM, Bistrian BR, McMahon MM (2002)Hyperglycemia in acutely ill patients. JAMA 288(17): 2167-2169.
-
Wright SP, Verouhis D, Gamble G, Swedberg K, Sharpe N, et al. (2003) Factors influencing the length of hospital stay of patients with heart failure. European journal of heart failure 5(2): 201-209.
-
Roizen MF, Toledano (1994) A Technology assessment and the "learning contamination" bias. Anesth Analg 79(3): 410-412.
- Editorial on Multimodal Analgesia
- Surgical Incision Site Local Anaesthetic Infiltration and Superior Hypogastric Plexus Block in Total Abdominal Hysterectomy Under General Anaesthesia- A Placebo-Controlled, Randomized Clinical Trial
- Supraglottic Airway Insertion in Semi Fowler Position Due to Severe Thoracic Hyperkyphosis: A Case Report
- Anaesthetic Management of Cardiac Myxoma Patient with Systemic Involvement: A Case Report
- Current Problems in Pulmonary Respiratory Distress Syndrome (Literature Review)
- Evolution of Perioperative Hemodynamic Monitoring from the Hand on Pulse to Hypotension Prediction Index