A Numerical Analysis of Mechanical Ventilation in Newborns
Background: Mechanical ventilation can be lifesaving procedure but has also been associated with lung injury. In order to better understand the application mechanical ventilation to newborns a numerical study has been performed based on a physiological/physical model. The model consists of the time integration of a quasi-static engineering pressure loss approach to simulate dynamic respiratory parameters during pressure control mode mechanical ventilation. The effects of pressure target, inhalation:exhalation ratio, lung compliance, and endotracheal tube (ETT) size on peak inspiratory and expiratory flow rates, tidal volume and tidal volume retained at the end of exhalation are determined. Also simulations of an ETT obstruction and a comparison of pressure to volume control mode are performed. In an appendix in vivo measurements and the results of a numerical analysis of the effects of fluid property variation on dynamic ventilation parameters in pressure control mode during xenon anesthesia are compared, thus providing a validation of the numerical method. The in vivo measurements were taken prior to surgery during the wash-in phase of xenon anesthesia in adults. This in silico study provides quantitative insight to mechanical ventilation of newborns, a vulnerable patient group where in vivo data are often difficult to obtain.
Caillibotte5
in vivo data are often difficult to obtain.
mode Conceptual Paper
tube; PEEP: Positive end expiratory pressure; CFD: Computaional Fluid Dynamics
Introduction
Mechanical ventilation to alleviate the work of breathing or for controlled respiration during anesthesia has been widely used for several decades. In spite of this experience, ventilator design and management can still be challenging and inappropriate ventilation can result in injury to the lungs or respiratory muscles and worsen morbidity and mortality. For intubated patients the challenges include delivering lung-protective ventilation to prevent ventilator-induced lung injury, maintaining adequate gas exchange in severely hypoxaemic patients, avoiding the development of ventilator-induced diaphragm dysfunction, and diagnosing and treating the many pathophysiological mechanisms that impair liberation from mechanical ventilation [1]. The challenges of mechanical ventilation are heightened when treating newborns [2, 3, 4, 5, 6, 7]. Early lung injury in the neonatal lung is often provoked due to the immature morphology, inducing defective alveolar septation, impaired angiogenesis and pathologic extracellular matrix remodeling resulting in lung growth impairment. In the long term, these changes result in neonatal chronic lung disease (nCLD), also known as Bronchopulmonary Dysplasia (BPD), frequently complicating the course of preterm or risk term birth. nCLD is one of the most common chronic lung diseases in children, whose incidence is reported to be as high as 77% in neonates born at less than 32 weeks of gestation.
The fundamental mechanisms of injury are complex [8] and follow as a consequence of the physical interaction of gases and the solid but deformable surfaces of the respiratory tract, including the very thin membranes in the alveoli where gas exchange occurs. From the clinicians' point of view, the inputs are the ventilator parameters that must be controlled or monitored to ensure adequate respiration consistent with maintaining lung safety while dealing with major difficulties associated with an unknown complicated morphology and intersubject variability. The use of in silico, numerical biomechanics models that consider the fluid mechanics and morphology can add insight through their ability to perform perfectly controlled and parameterized experiments, and to provide more complete ways to view the resulting data; for example, the pressure distribution from the breathing circuit through the endotracheal tube (ETT) into the respiratory tract to the alveoli. Numerical modeling can especially be helpful to understand the mechanical ventilation of neonates because in vivo data are difficult to obtain in this vulnerable population (e.g., see Ethical Considerations for Clinical Trials On Medicinal Products Conducted with The Paediatric Population from the European Medical Agency [9]).
Results from parameterized numerical experiments are presented in this paper based on an engineering pressure loss model [10, 11, 12] specifically extrapolated to account for the morphology and breathing characteristics of newborns. Variables considered include ETT size, lung compliance, respiratory rate, pressure control mode target, inspiratory:expiratory ratio, ETT obstruction, all during pressure control mode, the traditionally recommended ventilator mode used for neonates [4]. A comparison between pressure and volume control ventilation modes for a control case is also performed. An appendix provides comparisons of the model to measurements in adults from mechanical ventilation in pressure control mode, thus providing a validation of the numerical method.
Methods
Numerical Model
The numerical model is described in detail in a previous paper [11]. Briefly, a quasi-steady mechanical energy balance on flow and the pressure at any location in the respiratory tract compared to the alveolar pressure is
$$p - p_{adv} = \rho \sum h - \rho \left( \alpha \frac{V^2}{2} \right),$$
where $p$ and $V$ are the pressure and average velocity at each location, $\rho$ is the gas density, and $\alpha$ is a coefficient that modifies the kinetic energy term to account for different flow profiles: $\alpha=1$ for a blunt (turbulent) velocity profile and $\alpha=2$ for a parabolic (laminar) profile. The summation on the right-hand-side of Equation 1 is called the head loss, which represents the sum of all the resistive energy losses per unit mass in the flow path.
In this typical engineering approach, the head losses in all of the straight flow conduits are called "major," and a summation of all the components that change the velocity distribution (acceleration or deceleration of fluid particles), are called "minor." The minor loss occurs in laminar as well as turbulent flow. The summation of head losses is
$$\sum h = \sum_{major} f \frac{L}{D} \frac{V^2}{2} + \sum_{minor} K \frac{V^2}{2},$$
Where f is called the friction factor for each straight conduit of length L and diameter D, and K is a minor loss coefficient for each component (e.g., the bifurcations in the respiratory tract). For laminar fully developed flow f is analytically determined as
64 = f , (3) Re
Where Re is the Reynolds number based on D and the density and viscosity of the fluid, ρ and μ, respectively, µ VD ρ = Re . (4) After substituting Equations 2-4 into Equation 1 it can be shown that the major loss is independent of density for laminar flow. For turbulent pipe flow f has historically been determined empirically. For smooth tubes the correlation derived by Blasius can be used:
25 0 316 0 . f =
(5) . Re The criterion used herein for differentiating laminar and turbulent flow was Re≥2000. The minor loss coefficients representing the effects of airway bifurcations were previously calculated based on computational fluid dynamics (CFD) simulations for inhalation and exhalation. [11]. The minor loss coefficients were calculated on the bases of the local Reynolds number of the flow entering the bifurcation. Thus, the use of CFD provided an estimate of the complex flow fields within the respiratory tract. In the present work the patient interface is broken into two components, the filter and the ETT, and their minor loss coefficients were determined through bench top experiments [10]. Equation 1 was solved over a range of flow rates, for both inhalation and exhalation, and for each gas and ETT combination before fitting to equations of the form BQ AQ plung + = Δ 2 . (6) For exhalation it is also necessary to calculate the pressure losses from the Y-piece of the breathing circuit through the ventilator, including the valve to produce positive end expiratory pressure (PEEP). An empirical relationship, excluding PEEP, based on major and minor losses was employed based on the adult ventilator used to obtain the clinical measurements (see Appendix).
Q B Q A pvent μ ρ + = Δ 2
(7) For pressure in units of N/m2, Q in l/min, ρ in kg/m3, μin kg/s-m(x105), A=0.25 and B=1. To account for PEEP the recorded value was simply added to the calculated pressure values. Property values at 1 atm and 37°C for an enriched nitrogen-oxygen mixture of 50%/50% N2/O2 were used in the simulations (density of 1.179 kg/m3 and viscosity of 1.961x10⁻⁵ kg/s.m).
Neonate Morphology Model
There is very little neonate morphological data (e.g., airway dimensions) in the literature. For the analysis performed herein we adopted the morphology model previously used to study unsteady surfactant-laden liquid plug propagation in neonatal airways [13]. Based on the Weibel representation of the lung as a symmetric dichotomous tree, [14] the neonate model assumes that the trachea has the same dimensions as the 7th generation of the adult model and continues the adult sub-tree to its conclusion at generation 23 resulting in a neonate model from generations 0-16. Furthermore, the minor loss coefficients for each of the generations for the adult model are used for the neonate model. As the adult model assumes no minor losses in the pulmonary region (below generation 16) minor losses are assumed to be negligible after generation 9 in the neonate model. The dimensions of the neonate morphology model are given in Table 1.
| Diameter (mm) | Length (mm) | |
|---|---|---|
| 0-Trachea | 3.57 | 23.81 |
| 1 | 2.83 | 18.90 |
| 2 | 2.25 | 15.00 |
| 3 | 1.78 | 11.91 |
| 4 | 1.42 | 9.45 |
| 5 | 1.12 | 7.50 |
| 6 | 0.89 | 5.95 |
| 7 | 0.71 | 4.72 |
| 8 | 0.56 | 3.75 |
| 9 | 0.45 | 2.98 |
| 10 | 0.35 | 2.36 |
| 11 | 0.28 | 1.88 |
| 12 | 0.22 | 1.49 |
| 13 | 0.18 | 1.18 |
| 14 | 0.14 | 0.94 |
| 15 | 0.11 | 0.74 |
| 16 | 0.09 | 0.59 |
Table 1: Neonate morphology model dimensions.
Numerical Integration
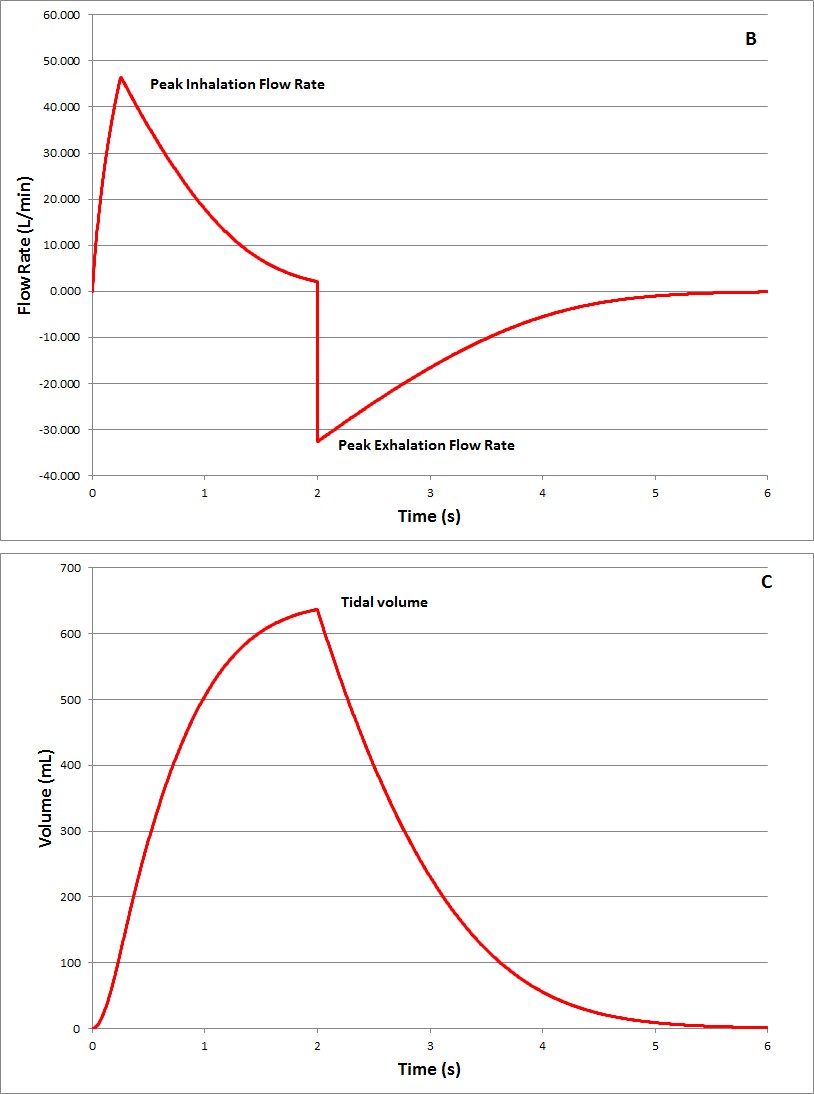
The parametric variables considered were respiratory rate (RR), pressure target during pressure control mode ventilation, ratio of inhalation/exhalation time, lung compliance, and ETT diameter. The numerical test cases are listed in Table 2, where the control case is specifically identified. The PEEP for all of the cases is 5 cm H2O. The rise time for the pressure to reach the target was chosen as 0.25 s. The output variables used to compare the different cases are defined in the schematics based on an adult case shown in Figure 1 and listed on Table 2. The example of an obstruction in the ETT was based on a numerical representation of the Rp50 resistor [15] which is the smallest resistance value provided for use with an infant test lung (Michigan Instruments, USA) [16].
For inhalation, equation 6 was evaluated in time using Excel (Microsoft, USA). At each new time step (2000 steps per ventilation cycle) the alveolar pressure was calculated based on the compliance and volume at the previous time step. With the boundary condition of applied pressure at the ventilator Y-Piece, equation 6 can be solved for Q. Similarly, for exhalation at each new time step equation 6, with the outflow pressure at the ventilator determined using equation 7, is solved for Q based on the alveolar pressure calculated using the lung compliance and lung volume from the previous time step.
Numerical Experiments
| Tidal | |||||||||||||||||||||||||||||
|---|---|---|---|---|---|---|---|---|---|---|---|---|---|---|---|---|---|---|---|---|---|---|---|---|---|---|---|---|---|
| Pressure | I | nhalation | : | ( | ETT | ) | Peak | F | Peak | ) | Tidal | ||||||||||||||||||
| Variable | RR | Lung Compliance | Volume | ||||||||||||||||||||||||||
| Target | Exhalation | Size | Inspiratory | Expiratory | Volume | ||||||||||||||||||||||||
| Modified | (bpm) | (ml/cmH2O) | Retained | ||||||||||||||||||||||||||
| (cmH2O) | ratio | mm | Flow (l/min) | low (l/min | (ml) | ||||||||||||||||||||||||
| (ml) | |||||||||||||||||||||||||||||
| RR | 20 | 15 | 1:1 | 3 | 3 | 4.0 | 6.6 | 29.8 | 0.01 | ||||||||||||||||||||
| Control | 30 | 15 | 1:1 | 3 | 3 | 4.0 | 6.4 | 28.5 | 0.19 | ||||||||||||||||||||
| RR | 40 | 15 | 1:1 | 3 | 3 | 4.0 | 6.0 | 26.3 | 0.67 | ||||||||||||||||||||
| RR | 50 | 15 | 1:1 | 3 | 3 | 4.0 | 5.6 | 23.8 | 1.32 | ||||||||||||||||||||
| Pressure | 30 | 10 | 1:1 | 3 | 3 | 2.1 | 3.7 | 14.3 | 0.07 | ||||||||||||||||||||
| Pressure | 30 | 20 | 1:1 | 3 | 3 | 5.8 | 8.5 | 42.6 | 0.35 | ||||||||||||||||||||
| Ratio | 30 | 15 | 1:2 | 3 | 3 | 4.0 | 5.8 | 25.1 | 0.02 | ||||||||||||||||||||
| Compliance | 30 | 15 | 1:1 | 2 | 3 | 3.4 | 6.6 | 19.8 | 0.01 | ||||||||||||||||||||
| Compliance | 30 | 15 | 1:1 | 4 | 3 | 4.3 | 6.1 | 35.7 | 0.91 | ||||||||||||||||||||
| Compliance | 30 | 15 | 1:1 | 6 | 3 | 4.7 | 5.4 | 46.0 | 4.33 | ||||||||||||||||||||
| ETT | 30 | 15 | 1:1 | 3 | 2.5 | 3.3 | 5.1 | 27.8 | 0.31 | ||||||||||||||||||||
| ETT | 30 | 15 | 1:1 | 3 | 3.5 | 4.5 | 7.5 | 29.2 | 0.07 | ||||||||||||||||||||
| ETT | 30 | 15 | 1:1 | 3 | 4 | 5.0 | 8.4 | 29.5 | 0.03 | ||||||||||||||||||||
| Obstruction | 30 | 15 | 1:1 | 3 | 3 | 1.0 | 0.9 | 13.5 | 3.01 | ||||||||||||||||||||
| Vol Control Mode | 30 | NA | 1:1 | 3 | 3 | 1.7* | 6.4 | 28.5** | 0.00 |
Table 2: Test cases and results.
Results
The results of the parametric study are given in Table 2. The characteristics of pressure control mode ventilation can be observed in Figure 1. First, a rise in pressure occurs, during a rise time, to a pressure target that is maintained until the exhalation period begins. Exhalation is passive, as flow is driven by the elasticity of the lungs through the breathing circuit to eventually reach ambient pressure, though an elevated PEEP pressure can be maintained by the ventilator. Two quantitative values that characterize the ventilation are the peak inhalation and exhalation flow rates. Another important characteristic of the ventilation is the tidal volume inhaled and the extent of exhalation, specifically recorded as the retained tidal volume.
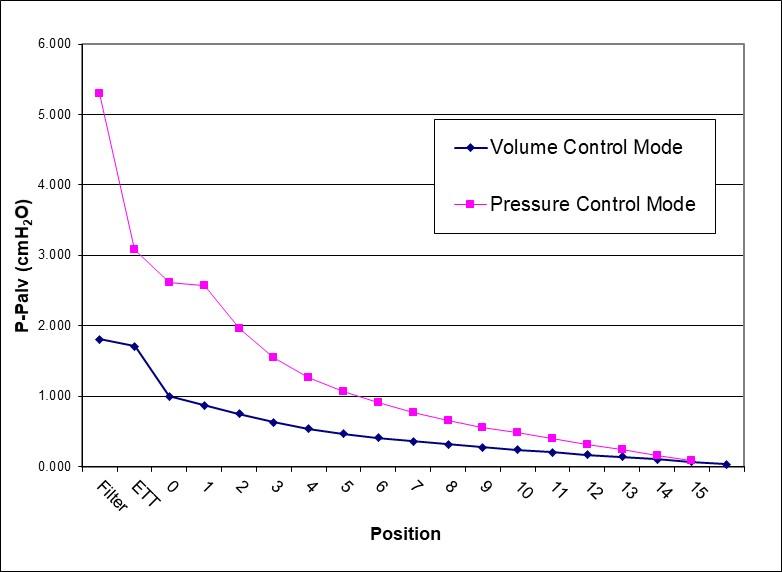
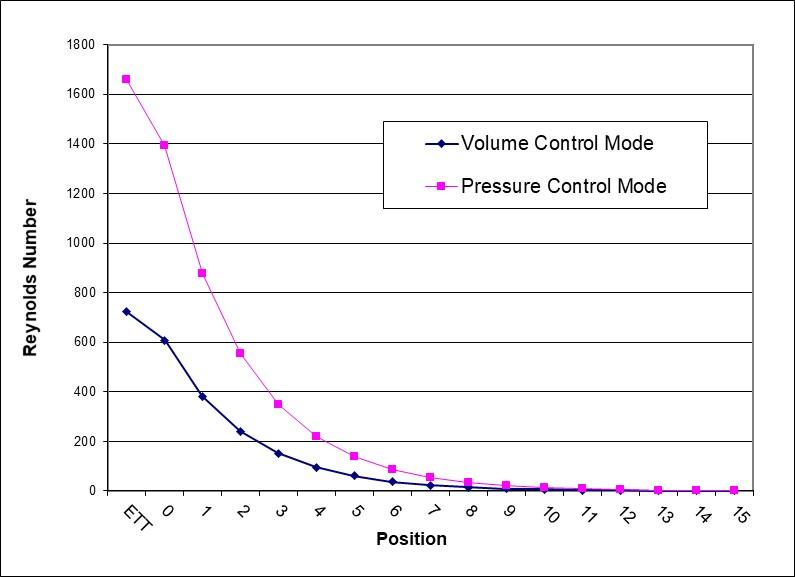
The effect of increase in RR, a reduction in the time for inhalation and exhalation, is to reduce tidal volume and increase the retained tidal volume at the end of exhalation. Increasing the pressure target increases tidal volume and flow rates. There are negligible differences in flow rates, tidal volume, or tidal volume retained between the control case with a 1:1 ratio and a 1:2 ratio. The important effect due to lung compliance is to reduce the tidal volume when using the same pressure target in pressure control mode. Furthermore, for very compliant lungs the tidal volume retained becomes significant. Decreasing ETT diameter increases airway resistance. The result can be seen in the reduced magnitude of peak flow rates. The increased resistance could become problematic if for other reasons ventilation or oxygenation is restricted, such as the obstruction considered next. For the Rp50 ETT obstruction modeled there is a major reduction in peak flow rates and the tidal volume, while there is a tremendous volume retained. This level of obstruction would certainly require corrective action. A comparison of pressure control mode to the equivalent volume control mode; i.e., that results in the same tidal volume, indicates that the peak inhalation flow rate is almost three times greater. Exhalation is essentially the same in both cases. The pressure distribution curves shown in Figure 2 from the ETT through the respiratory tract indicate that almost half of the drop occurs in the ETT for both ventilation modes. Figure 3 provides similar Re distribution curves. In the ETT Re almost reaches 1500 for peak inhalation flow in pressure control mode. This is below the critical value for the onset of turbulence in straight tubes, and by further investigation in the literature specifically for ETTs, [17] turbulence is not expected for clean tubes.
Discussion
In this paper a numerical engineering pressure loss model has been used with a neonate lung morphology model to analyze mechanical ventilation in newborns. The development of such a model, simple to implement in Excel, with the ability to change parameters including properties for the inhaled gas, provides a tool for easier understanding of potential hazards; especially for researchers in the development phase of new gas therapies. For example, if the use of xenon anaesthesia were ever extended to newborns this model could be easily adapted to provide insight before actually administering the gas.
In terms of accuracy, calculations of airway resistance, including the endotracheal tube, for the control case is 50.5 to 78.6 cm H2O/L/s for 0.3 to 5 L/min, respectively. This range of values compares well to a published range of 50-150 cmH2O/L/s for a normal 3 kg infant [2].
In a previous paper the engineering pressure loss model was compared to in vivo data during mechanical ventilation in volume control mode in adult patients [18]. In an appendix model results are compared to in vivo data specifically to assess its capabilities to account for the dynamics of the respiratory cycle during mechanical ventilation in pressure control mode. The direct comparisons of model and experimental time histories of Y-piece pressure and flow rate indicate that with knowledge of the gas composition, ETT size, and lung compliance the dynamic ventilatory parameters can be predicted.
The safety concerns related to mechanical ventilation can be organized into two broad categories, 1) lung injury and 2) adequate respiration. Regarding 1) lung injury, a detailed discussion of the anatomical and physiologic causes is beyond the scope of this paper, but the reader is directed to a reference that addresses the concept of lung stress/strain as applied to the whole lung or specific pulmonary regions in context of mechanical ventilation [19]. The current paper has presented data expressed by parameters such as flow rate, pressure, and volume that are intended to guide researchers and clinicians specifically for the difficult cases of newborns by providing parametric results covering several variables. It is noted that pressure control mode can normally avoid barotraumas by limiting the alveolar pressure. However, the higher peak inhalation flow rate compared to volume control mode could pose problems because the strain rate due to high inspiratory flow has also been shown to cause lung injury in piglets [20] while a reduction of inspiratory flow has been shown to provide lung protection in sheep [21]. Regarding 2) adequate respiration, a key factor is to obtain adequate tidal volume. Variables such as RR, lung compliance, and the ETT size can affect the tidal volume, but of the simulations performed in this study, the development of an obstruction in the ETT would pose the greatest challenge to providing adequate tidal volume and respiration. Occlusion is a recognized hazard of prolonged endotracheal intubation resulting from deposition of secretions on the inner surface of the ETT. When volume- controlled ventilation is used, progressive ETT occlusion may be detected by monitoring the difference between peak and plateau airway pressures. In pressure- controlled modes, however, inspiratory airway pressures are preset and thus cannot act as a warning indicator. Instead, changes in delivered tidal volumes may aid in the identification of ETT occlusion [22]. Furthermore, the high tidal volume retained would eventually result in a less compliant lung. With a partial occlusion it is much more likely that turbulent flow would occur in the ETT that would be convected downstream, thus also affecting airway resistance in the lung.
There are several limitations to this study. There exists very limited morphological data for neonate lungs in the literature. Thus, the morphology model is somewhat speculative. The lung morphology is considered to be perfectly rigid, an assumption that is shown to cause errors as lung compliance increases (see appendix), so it is expected that peak inhalation flow rates calculated in this study are higher than would be seen on the ventilator. The ventilator model utilized is based on the adult experiments described in the appendix. The exhalation pressure drop, rise time, and general ventilator performance will depend on the make and model. The parametric study has considered a representative range of parameters but not all possible combinations. The Rp50 resistance modeled for the obstruction is a purely inertial resistance such that pressure drop increases with the square of flow rate (thus termed a parabolic resistance) and proportionally to the density. Obstructions might also occur that in effect reduce the lumen of the ETT, resulting increased pressure loss proportional to the flow rate and the viscosity. The response to a linear resistance increase can be inferred from the results on the smaller caliber ETTs.
In conclusion, this paper has presented a numerical study of mechanical ventilation in newborns with the goal of providing insight to this potentially dangerous clinical procedure in a vulnerable patient group where in vivo data are difficult to obtain. In addition, results of the adult version of the model are compared with data from downloaded ventilator data of the administration of xenon anesthesia.
Competing Interests
The authors have no competing interests to declare.
Data Availability
The data presented in this study is available from the corresponding author upon request.
Funding
This study was funded by Air Liquide Santé International.
References
-
Goligher EC, Ferguson ND, Brochard LJ (2016) Clinical challenges in mechanical ventilation. The Lancet 387(10030): 1856-1866.
-
Baldoli I, Cuttano A, Scaramuzzo RT, Tognarelli S, Ciantelli M, et al. (2015) A novel simulator for mechanical ventilation in newborns: MEchatronic REspiratory System SImulator for Neonatal Applications. Proc Inst Mech Eng 229(8): 581-591.
-
Craig BT, Jackson GP (2017) Physiologic Considerations for Minimally Invasive Surgery in Infants and Children 1-10.
-
Garcia Fernandez J, Castro L, Belda FJ (2010) Ventilating the newborn and child. Curr. Anaesth. Crit. Care 21(5-6): 262-268.
-
Itagaki T, Chenelle CT, Bennett DJ, Fisher DF, Kacmarek RM (2017) Effects of Leak Compensation on Patient-Ventilator Synchrony during Premature/Neonatal Invasive and Noninvasive Ventilation: A Lung Model Study. Respir Care 62(1): 22-33.
-
Shahriari A, Sheikh M (2016) Is the Pressure Control Mode for Pediatric Anesthesia Machines Really Required? Anesthesiol Pain Med 6(2): e35350.
-
Yaroshenko A, Pritzke T, Koschlig M, Kamgari N, Willer K, et al. (2016) Visualization of neonatal lung injury associated with mechanical ventilation using x- ray dark-field radiography. Sci Rep 6: 24269.
-
Gattinoni L, Protti A, Caironi P, Carlesso E (2010) Ventilator-induced lung injury: the anatomical and physiological framework. Crit Care Med 38: S539- 548.
-
European Medicines Agency - Multidisciplinary - Investigation of medicinal products in the term and preterm neonate.
-
Katz IM, Martin AR, Feng CH, Majoral C, Caillibotte G, et al. (2012) Airway pressure distribution during xenon anesthesia: the insufflation phase at constant flow (volume controlled mode). Appl Cardiopulm Pathophysio 16: 5-16.
-
Katz IM, Martin AR, Muller P-A, Terzibachi K, Feng C- H, Caillibotte G, et al. (2011) The ventilation distribution of helium–oxygen mixtures and the role of inertial losses in the presence of heterogeneous airway obstructions. J Biomech 44(6): 1137-1143.
-
Gouinaud L, Katz I, Martin A, Hazebroucq J, Texereau J, et al. (2015) Inhalation pressure distributions for medical gas mixtures calculated in an infant airway morphology model. Comput Methods Biomech Biomed Engin 18(12): 1358-1366.
-
Olgac U, Muradoglu M (2013) Computational modeling of unsteady surfactant-laden liquid plug propagation in neonatal airways. Phys Fluids 25(7): 071901.
-
Ewald R, Weibel (2017) Morphometry of the Human Lung. Springer.
-
Martin AR, Katz IM, Terzibachi K, Gouinaud L, Caillibotte G, et al. (2012) Bench and mathematical modeling of the effects of breathing a helium/oxygen mixture on expiratory time constants in the presence of heterogeneous airway obstructions. Biomed. Eng online 11: 27.
-
(2017) Adult-Infant Training & Test Lung Device from Michigan Instruments. Mich Instrum.
-
Jarreau PH, Louis B, Dassieu G, Desfrere L, Blanchard PW, et al. (1999) Estimation of inspiratory pressure drop in neonatal and pediatric endotracheal tubes. J Appl Physiol 87(1): 36-46.
-
Katz IM, Majoral C, Daviet C, Bazin JE, Georges Caillibotte (2017) _In silico_ Simulations Compared to _In vivo_ Measurements of the Effects of Fluid Properties on Dynamic Ventilation Parameters during Xenon Anesthesia. Appl Cardiopulm Pathophysiol 21: 3-17.
-
Luciano G, Alessandro P, Pietro C, Eleonora C (2017) Ventilator-induced lung injury: The anatomical and physiological framework. Critical Care Medicine 38(10): S539-S548.
-
Protti A, Maraffi T, Milesi M, Votta E, Santini A, et al. (2016) Role of strain rate in the pathogenesis of ventilator-induced lung edema. Crit. Care Med 44(9): e838-845.
-
Rich PB, Reickert CA, Sawada S, Awad SS, Lynch WR, et al. (2017) Effect of rate and inspiratory flow on ventilator-induced lung injury. J. Trauma Acute Care Surg 49(5): 903-911.
-
Tung A, Morgan S (2002) Modeling the Effect of Progressive Endotracheal Tube Occlusion on tidal volume in pressure control mode. Anesthesia & Analgesia 95(1): 192-197.
- Editorial on Multimodal Analgesia
- Surgical Incision Site Local Anaesthetic Infiltration and Superior Hypogastric Plexus Block in Total Abdominal Hysterectomy Under General Anaesthesia- A Placebo-Controlled, Randomized Clinical Trial
- Supraglottic Airway Insertion in Semi Fowler Position Due to Severe Thoracic Hyperkyphosis: A Case Report
- Anaesthetic Management of Cardiac Myxoma Patient with Systemic Involvement: A Case Report
- Current Problems in Pulmonary Respiratory Distress Syndrome (Literature Review)
- Evolution of Perioperative Hemodynamic Monitoring from the Hand on Pulse to Hypotension Prediction Index