Comparison of Smoking Dependence Levels by their Effects on Acute Postoperative Pain in Lower Extremity Fractures
Objectives: There are many studies investigating the effects of acute postoperative pain and smoking addiction levels. However, there is no study in the literature comparing these effects of smoking addiction in general or regional anesthesia. The aim of this study is to demonstrate the effects of smoking addiction levels on postoperative pain in patients. Methods: 120 patients with ASA scores of 1-2 and between the ages of 18-65 who underwent lower extremity fracture surgery were included. Patients separated 6 groups; general and regional anesthesia control groups (n=20, n=20), general anesthesia heavy and light smokers (n=20, n=20), spinal anesthesia heavy and light smokers (n=20, n=20). Age, gender, ASA scores, anesthesia type, weight, height and BMI, Fagerstrom scores, VAS scores, Bromage scores were recorded. Results: VAS scores were founded higher in heavy smokers on postoperative hours in both anesthesia types. There was no difference between the regional anesthesia heavy and light smoker groups in tramadol consumption, but that were found high in heavy smoker group compared with light smoker group in general anesthesia patients. Also there was no difference between general and regional anesthesia in the use of additional analgesics but it was found higher in heavy smoker groups than light smoker groups. Discussion: PCA provided adequate analgesia in postoperative period both general and regional anesthesia groups but VAS levels started to increase after 4 hours. We suppose that lower VAS levels can be achieved by choosing epidural PCA instead of intravenous, and further studies are required on this subject.
Introduction
Acute postoperative pain occurs due to tissue damage caused by surgical trauma [1]. This leads to depression and anxiety in the patient. The aim of the treatment is to provide effective analgesia. When the treatment is insufficient; the patient recovery, length of hospital stay, and the morbidity and mortality rates are affected. Not every patient feels the same level of pain after surgery. Although the factors affecting the postoperative pain include age, gender; psychological, pharmacokinetic, and pharmacodynamics factors; administered premedication and the anesthetic agents, and the pain threshold of the patient; the major one is the location of surgery [2]. A well-administered intraoperative analgesia is important, too, to ensure the effectiveness of postoperative analgesia. General and regional anesthesia display some differences in regards to the evaluation of their analgesic efficacy. The aim of postoperative pain management is not only to ensure pain control but also to prevent disruptions in respiratory and gastrointestinal system functions and to enable early mobilization of the patient. A continuously administered and balanced analgesia in the postoperative period reduces the harmful effects of the stress response (such as delayed wound healing) as well [3].
The multimodal analgesia method has recently been recommended for the relief of postoperative pain, combining different analgesics with different mechanisms of action. This method allows for using a lower dose of analgesics owing to the additive and synergistic effect of analgesic agents, resulting in lower rates of side effects and effective analgesia.
The effects of smoking on anesthesia and pain are complex and poorly understood. However, it is known that cigarettes contain nicotine, which is well known to have analgesic properties. This property of nicotine was first demonstrated in visceral pain models in cats. Since then it has been supported by numerous human and animal studies [4]. Studies have shown that chronic nicotine use increases pain perception but acute nicotine use provides analgesic effects [4, 5]. Hyperalgesia occurs and pain threshold decreases following a sudden cessation of smoking after surgery or a painful stimulation.
The aim of this study was to investigate the relationship of heavy and light smoking dependence with the general and regional anesthesia in American Society of Anesthesiologists (ASA) risk classification 1-2 patients in the age range from 18 to 65 years, who were operated for the treatment of lower extremity fractures. Demonstration of postoperative complications and the pattern of analgesic consumption were defined as the secondary objectives.
Materials and Methods
This is a randomized, controlled, double-blind, and prospective observational study. Eligible patients with lower extremity fractures admitted to the orthopedic service in the period from January 2017 - to March 2018 were enrolled in this study after their informed consents were obtained. This study was conducted with the approval of the local ethics committee.
A total of 120 patients in the age range from 18 to 65 years with preanesthetic ASA risk classification scores of 1 or 2; who were planned to undergo a lower extremity fracture surgery, were included in the study after they read the informed consent forms for volunteers and after they provided their consents. Forty non-smokers (20 individuals in the general anesthesia control group and 20 individuals in the regional anesthesia control group) were enrolled to comprise the control group. The patients who received general anesthesia were named as Group I and the patients who were administered regional anesthesia were named as Group II. Of the study participants, all smokers were administered the “Fagerstrom Nicotine Dependence Test” [6]. The patients with a total score of 5 and lower were included in the light-smokers (low-dependence) group, whereas, the patients with a total score of 6 or higher were included in the heavy smokers (heavy-dependence) group; resulting in a total of four groups, consisting of 20 patients in each. “Group I-Light” composed of light smokers receiving general anesthesia, “Group II-Light” composed of light smokers receiving regional anesthesia, “Group I-Heavy” composed of heavy smokers receiving general anesthesia, and “Group II-High composed of heavy smokers receiving regional anesthesia (Table 1).
| Group I (general anesthesia), n | Group II (regional anesthesia), n | |
|---|---|---|
| Heavy Dependence (H) | Group I H, 20 | Group II H, 20 |
| Light Dependence (L) | Group I L, 20 | Group II L, 20 |
Table 1: The study groups and the number of individuals in each of these six groups.
Patients; who did not accept to participate in the study, who were known to have tramadol allergy, who received psychotropic drugs, who used alcohol or substance, who had morbid obesity or chronic pain were excluded from the study. In the preoperative period; the age, height, weight, body mass index (BMI), ASA, duration of operation, and the Fagerstrom score of the participants were recorded. Electrocardiography (ECG) monitoring started using the standard DII lead; along with the motorization of the heart rate (HR), noninvasive systolic arterial pressure (SAP), diastolic arterial pressure (DAP), mean arterial pressure (MAP), and peripheral oxygen saturation (SpO2). The baseline values of these parameters at the beginning of the motorization were recorded. A peripheral vascular access was established with a 20-Gauge cannula and intravenous (i.v.) fluid treatment was initiated.
All patients, who would receive spinal anesthesia, were placed in the sitting position. The puncture site was disinfected with 10% povidone iodine as the antiseptic solution and covered with sterile gauze pads. After entering the subarachnoid space with a 25-G Quincke spinal needle at the level of the L3-L4 intervertebral disc space and observing the drainage of cerebrospinal fluid (CSF) with a clear appearance; the local anesthetic agent was administered intrathecally. All patients were placed in the supine position after the procedure.
In the general anesthesia groups; 1-2 mg midazolam was administered for sedation. Then, 1-1.5 mg/kg fentanyl, 1-2 mg/kg lidocaine, and 2-3 mg/kg propofol were administered intravenously for anesthesia induction. Rocuronium, at a dose of 0.6 mg/kg was administered to the intubated patients for muscle relaxation. For the maintenance of anesthesia, sevoflurane and remifentanil (0.05-0.2 µg/kg/ min) were administered. The intubated patients received an additional 10 mg dose of rocuronium at a dose of 10 mg was administered as needed to maintain muscle relaxation.
Every 15 minutes during the operation and postoperative awakening; HR, SAP, DAP, and MAP values were recorded. An approximate 100 mg dose of tramadol was administered to all groups intravenously within the last 30 minutes of the operation. For postoperative analgesia; all patients were connected to an i.v. patient-controlled analgesia (PCA) device (500 mg tramadol in 150 cc of 0.9% isotonic sodium chloride, given at a basal infusion rate of 4 mg/hour; with a bolus dose of 4 mg and locked-in periods of 20 min) at the end of the operation. Consumption of analgesics and the patients requirement for additional analgesia were measured.
The visual analog scale (VAS) levels of the patients were measured in the postoperative wake-up unit in the 1st, 4th, 8th, 12th, and 24th hours. The Bromage scale was administered in the spinal anesthesia group. Any emerging adverse effects or complications were noted. Any requirement for analgesics in addition to patient-controlled analgesia (PCA) was recorded in the postoperative 24 hours.
Statistical Analysis
The data were analyzed with the IBM SPSS 24.0 statistical package program (Chicago, IL, USA). Descriptive statistical methods (frequency, percentage, mean, and standard deviation) were used to evaluate the data. Pearson Chi-Square test, Yates Chi-Square test or Fisher’s Chi- Square test was used in order to compare the qualitative data. The data conformity for normal distribution was tested with the Kolmogorov-Smirnov and Shapiro-Wilk tests. The Independent Samples t-test was used for making comparisons between groups (t-test for independent groups) and One-Way ANOVA (one-way analysis of variance) was used for making intra-group comparisons (between the subgroups). The relationships between the variables were evaluated with Pearson correlation test. Probability values lower than a p-value of 0.05 (α=0.05) were accepted as significant, indicating a difference between the groups; while, the higher values were accepted as nonsignificant and that there was no difference between the groups.
Results
Comparisons between the groups revealed that there were no statistically significant differences in gender, age, height, weight, BMI, ASA, duration of operation, and Fagerstrom scores (p>0.05). In intragroup comparisons; we found a statistically significant difference in weight (kilograms) between the subgroups (control group, heavy smokers, light smokers) of both Group I and Group II (p<0.05). However, the BMI values were statistically significantly different between the subgroups only in Group II (p<0.05) (Table 2).
| Group I (n=60) | Group II (n=60) | p | ||
|---|---|---|---|---|
| Gender | ||||
| Control (C) | Females | 13 (65.0%) | 13 (65.0%) | 1.000a |
| Males | 7 (35.0%) | 7 (35.0%) | ||
| Heavy | Females | 7 (35.0%) | 2 (10.0%) | 0.127b |
| Males | 13 (65.0%) | 18 (90.0%) | ||
| Light | Females | 10 (50.0%) | 6 (30.0%) | 0.333a |
| Males | 10 (50.0%) | 14 (70.0%) | ||
| Total | Females | 30 (50.0%) | 21 (35.0%) | 0.097c |
| Males | 30 (50.0%) | 39 (65.0%) | ||
| Age | ||||
| Control (n=40) | 34.4±13.7 | 35.2±12.7 | 0.840d | |
| Heavy (n=40) | 40.7±15.1 | 40.8±12.4 | 0.982d | |
| Light (n=40) | 37.4±13.4 | 40.0±14.2 | 0.547d | |
| Total (n=120) | 37.5±14.1 | 38.7±13.1 | 0.630d | |
| p** | 0.369e | 0.351e | ||
| Height (cm) | ||||
| Control (n=40) | 167.4±9.1 | 167.9±9.2 | 0.864d | |
| Heavy (n=40) | 171.7±8.2 | 175.0±8.7 | 0.217d | |
| Light (n=40) | 170.4±9.9 | 172.8±9.4 | 0.437d | |
| Total (n=120) | 169.8±9.1 | 171.9±9.4 | 0.221d | |
| p** | 0.313e | 0.064e | ||
| Body weight (kg) | ||||
| Control (n=40) | 64.2±9.4 | 65.0±10.0 | 0.796d | |
| Heavy (n=40) | 73.5±13.1 | 77.3±10.7 | 0.326d | |
| Light (n=40) | 69.0±11.3 | 72.9±13.1 | 0.326d | |
| Total (n=120) | 68.9±11.8 | 71.7±12.2 | 0.205d | |
| p** | 0.041e | 0.004e | ||
| Difference | Between C and H | Between C and H | ||
| BMI (kg/m2) | ||||
| Control (n=40) | 22.8±2.0 | 22.9±2.0 | 0.848d | |
| Heavy (n=40) | 24.8±3.3 | 25.1±2.3 | 0.734d | |
| Light (n=40) | 23.7±3.4 | 24.2±2.8 | 0.602d | |
| Total (n=120) | 23.8±3.0 | 24.1±2.5 | 0.535d | |
| p** | 0.112e | 0.020e | ||
| Difference | -- | Between C and H | ||
| ASA | ||||
| Control (C) | I | 15 (75.0%) | 15 (75.0%) | 1.000b |
| II | 5 (25.0%) | 5 (25.0%) | ||
| Heavy | II | 20 (100.0%) | 20 (100.0%) | -- |
| Light | II | 20 (100.0%) | 20 (100.0%) | -- |
| Total | I | 15 (75.0%) | 15 (75.0%) | 1.000a |
| II | 45 (225.0%) | 45 (225.0%) | ||
| Duration of Operation | ||||
| Control (n=40) | 115.8±48.5 | 99.3±28.2 | 0.196d | |
| Heavy (n=40) | 107.3±38.7 | 111.0±45.0 | 0.779d | |
| Light (n=40) | 100.8±33.0 | 105.5±33.8 | 0.655d | |
| Total (n=120) | 107.9±40.3 | 105.3±36.0 | 0.703d | |
| p** | 0.507e | 0.595e | ||
| Fagerstrom Score | ||||
| Control (C) | -- | -- | -- | |
| Heavy (n=40) | 7.1±1.0 | 7.5±1.3 | 0.231 | |
| Light (n=40) | 2.1 ±1.6 | 1.2±1.3 | 0.051 | |
| Total | 4.6±2.8 | 4.3±3.5 | 0.725 | |
| p* | 0 | 0 |
Table 2: Comparison of Demographic Characteristics. Group I: General Anesthesia, Group II: Regional Anesthesia a: Yates Chi-Squar
Intergroup comparisons revealed that; between the groups, there were no statistically significant differences in none of the corresponding HR values measured at all-time points until the postoperative period (p>0.05). However; in the postoperative period, there was a statistically significant difference in the mean HR between the light and heavy smoker subgroups (p<0.05). The values indicating a difference were found to be higher in all measurements in Group I compared to Group II.
Intragroup comparisons showed that the corresponding HR values measured at all times were not statistically significantly different between the subgroups (the control group, heavy smokers group, and the light smokers group) in Group I or Group II (p>0.05).
Intergroup comparisons revealed that there were no statistically significant differences between the groups in the corresponding SAP values measured at all times until the postoperative period (p>0.05); whereas, there was a statistically significant difference in the SAP values in the light smokers subgroup between the groups (p<0.05). The values indicating a difference were found to be higher in all measurements in Group I compared to Group II (Figure 1).
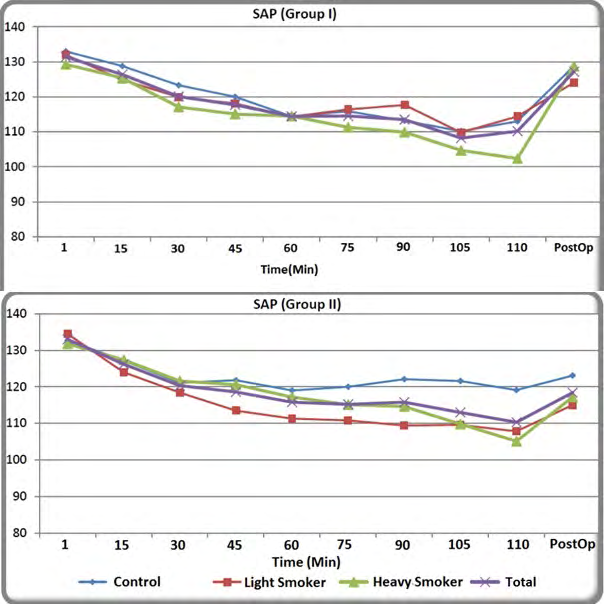
Intragroup comparisons showed that all of the corresponding SAP values at all time points were not statistically significantly different between the subgroups (the control group, heavy smokers group, and the light smokers group) in Group I or Group II (p>0.05).
Intergroup comparisons revealed that there were no statistically significant differences between the groups in the corresponding DAP values measured at all time points until the postoperative period (p>0.05); whereas, in the postoperative period, there was a statistically significant difference between the groups in the DAP values in the light smokers subgroup (p<0.05). The values indicating a difference were found to be higher in all measurements in Group I compared to Group II (Figure 2).
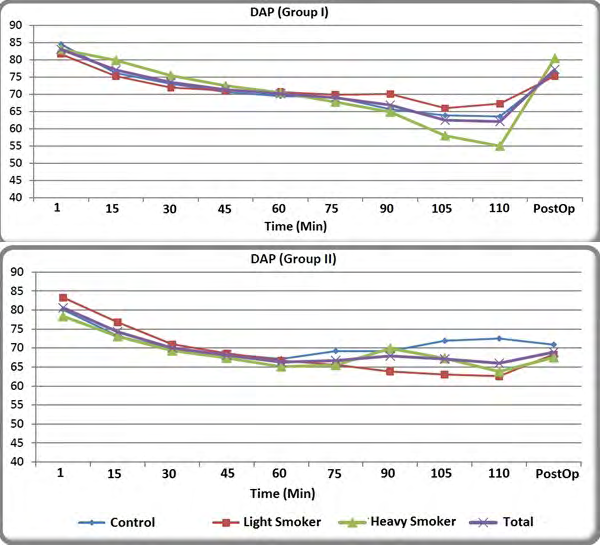
Intragroup comparisons showed that the corresponding DAP values were not statistically significantly different between the subgroups (the control group, heavy smokers group, and the light smokers group) in Group I or Group II (p>0.05).
Intergroup comparisons revealed that there were no statistically significant differences between the groups in the corresponding MAP values measured at all times until the postoperative period (p>0.05); whereas, in the postoperative period, there was a statistically significant difference in the MAP values between the groups generally (p<0.05). The values indicating a difference were found to be higher in all measurements in Group I compared to Group II.
Intragroup comparisons showed that all of the corresponding MAP values at all-time points were not statistically significantly different between the subgroups (the control group, heavy smokers group, and the light smokers group) in Group I and Group II (p> 0.05).
The comparisons of the peripheral oxygen saturation (SpO2) values showed no statistically significant differences neither between the groups nor between the subgroups (p>0.05).
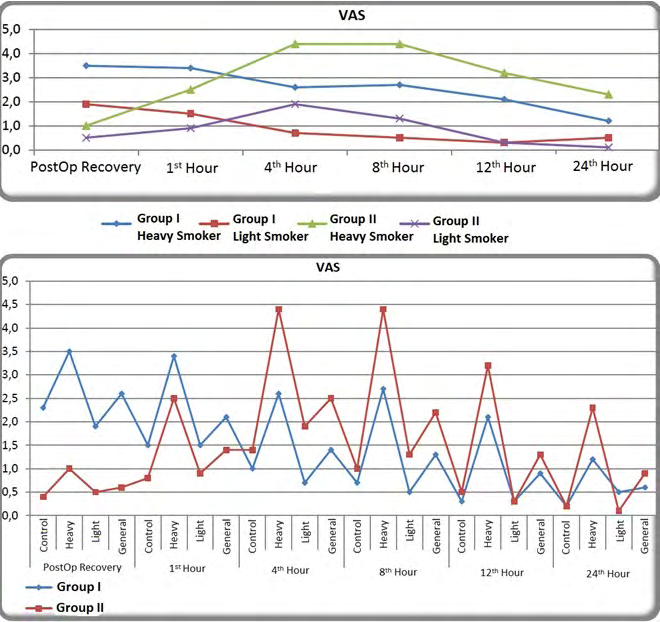
The intergroup comparison of the VAS values revealed that (Figure 3);
- In the postoperative recovery period, the VAS scores were found to be statistically significantly different between the groups generally and between each of the subgroup pairs (p<0.05), with Group I having the higher values compared to Group II,
- In the hour zero, there was a statistically significant difference in the general VAS scores between the groups (p<0.05), with Group I having the higher values compared to Group II,
- In the hours 4 and 8, statistically significant differences were found in the VAS scores between the heavy smoker and light smoker subgroups (p<0.05) and generally between the groups, with Group II having the higher values compared to Group I,
- In the 8th hour, there was a statistically significant difference in the VAS scores between the heavy smoker and light smoker subgroups and generally between the groups (p<0.05), and Group II values were higher compared to Group I,
- In the hours 12 and 24, it was observed that the VAS scores in the heavy smokers group was statistically significantly different between the groups (p<0.05), and the values in Group II were found to be higher.
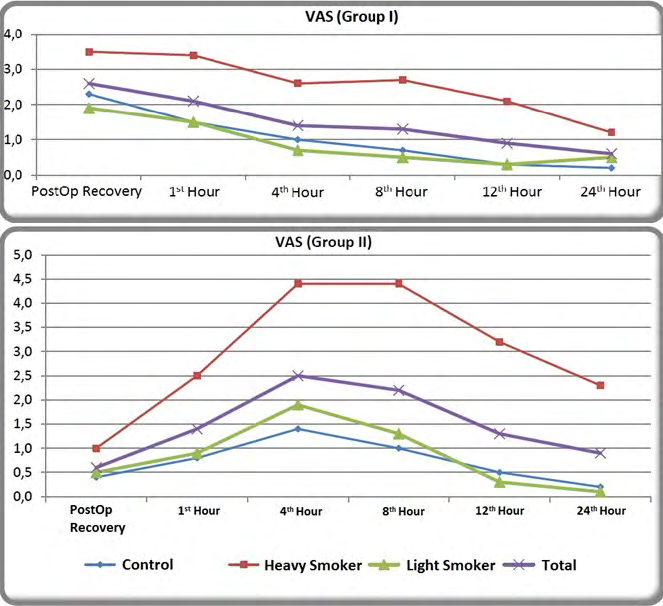
Intragroup comparison of the VAS scores demonstrated that (Figure 4, Table 3);
- In the postoperative recovery period, no statistically significant differences were found in the VAS scores of the subgroups (control group, heavy smokers, and light smokers) of Group II (p>0.05); however, the VAS scores were found to be statistically significantly different in the subgroups (control group, heavy smokers, and light smokers) of Group I (p<0.05). Sub-tests (post-hoc) were performed to find out, between which subgroups / groups the difference occurred, revealing a statistically significant difference between the heavy and light smoker subgroups. The VAS scores were higher in the heavy smoker subgroup.
- In the 1st, 2nd, 4th, 8th, 12th, and 24th hours; there was a statistically significant difference in the VAS scores between the sub-groups (control group, heavy smokers, and light smokers) both in Group I and Group II (p<0.05). Sub-tests (post-hoc) were applied to find out, between which subgroups/ groups the difference occurred. It was found that there was a statistically significant difference in all time points between the heavy smoker group and all other subgroups in both Group I and Group II, with the VAS scores being higher than the values in the other subgroups.
| Group I(n=60) | Group II(n=60) | p* | |||
|---|---|---|---|---|---|
| Postop. Recovery | Control (C) | 2.3±2.1 | 0.4±0.7 | 0 | |
| Postop. Recovery | Heavy | 3.5±2.2 | 1.0±1.4 | 0 | |
| Postop. Recovery | Light | 1.9±1.4 | 0.5±0.9 | 0 | |
| Postop. Recovery | General | 2.6±2.0 | 0.6±. | 0 | |
| Postop. Recovery | p** | 0.028 | 0.178 | ||
| Postop. Recovery | Difference | Between L and H | -- | ||
| Postop. Recovery | Hour 1 | Control (C) | 1.5±1.4 | 0.8±1.2 | 0.092 |
| Heavy | Hour 1 | 3.4±1.4 | 2.5±1.9 | 0.112 | |
| Light | Hour 1 | 1.5±1.6 | 0.9±1.0 | 0.175 | |
| General | Hour 1 | 2.1±1.7 | 1.4±1.6 | 0.019 | |
| p** | Hour 1 | 0 | 0 | ||
| Difference | Hour 1 | Between H and C-L | Between H and C-L | ||
| Hour 4 | Control (C) | 1.0±1.3 | 1.4±1.5 | 0.375 | |
| Hour 4 | Heavy | 2.6±1.8 | 4.4±2.1 | 0.004 | |
| Hour 4 | Light | 0.7±1.1 | 1.9±1.6 | 0.01 | |
| Hour 4 | General | 1.4±1.6 | 2.5±2.2 | 0.002 | |
| Hour 4 | p** | 0 | 0 | ||
| Hour 4 | Difference | Between H and C-L | Between H and C-L | ||
| Hour 8 | Control (C) | 0.7±1.1 | 1.0±1.5 | 0.543 | |
| Hour 8 | Heavy | 2.7±1.9 | 4.4±2.3 | 0.016 | |
| Hour 8 | Light | 0.5±0.7 | 1.3±1.7 | 0.047 | |
| Hour 8 | General | 1.3±1.6 | 2.2±2.4 | 0.014 | |
| Hour 8 | p** | 0 | 0 | ||
| Hour 8 | Difference | Between H and C-L | Between H and C-L | ||
| Hour 12 | Control (C) | 0.3±0.7 | 0.5±1.1 | 0.475 | |
| Hour 12 | Heavy | 2.1±1.9 | 3.2±1.5 | 0.041 | |
| Hour 12 | Light | 0.3±0.6 | 0.3±0.8 | 0.819 | |
| Hour 12 | General | 0.9±1.5 | 1.3±1.8 | 0.144 | |
| Hour 12 | p** | 0 | 0 | ||
| Hour 12 | Difference | Between H and C-L | Between H and C-L | ||
| Hour 24 | Control (C) | 0.2±0.5 | 0.2±0.6 | 0.778 | |
| Hour 24 | Heavy | 1.2±1.8 mm | 2.3±1.6 | 0.043 | |
| Hour 24 | Light | 0.5±0.7 | 0.1±0.4 | 0.064 | |
| Hour 24 | General | 0.6±1.2 | 0.9±1.4 | 0.268 | |
| Hour 24 | p** | 0.014 | 0 | ||
| Hour 24 | Difference | Between H and C-L | Between H and C-L |
Table 3: Inter and Intragroup Comparisons of the VAS scores. Group I: General Anesthesia, Group II: Regional Anesthesia *Independ
Table 3: Inter and Intragroup Comparisons of the VAS scores. Group I: General Anesthesia, Group II: Regional Anesthesia *Independent Samples t-test, **One-Way ANOVA When the relations between the Fagerstrom and VAS scores were examined, statistically significant relationships were found (Table 4);
- Between the Fagerstrom and postoperative recovery VAS scores positively, at the level of r=0.252,
- Between the Fagerstrom and the 1st hour VAS scores positively, at the level of r=0.431,
- Between the Fagerstrom scores and the 4th hour VAS scores positively, at the level of r=0.456,
- Between the Fagerstrom Score and the 8th hour VAS scores positively, at the level of r=0.524,
- Between the Fagerstrom and the 12th hour VAS scores positively, at the level of r=0.633,
- Between the Fagerstrom scores and the 24th hour VAS scores positively, at the level of r=0.508
| VAS | Fagerstrom Score | |
|---|---|---|
| r | p* | |
| Postop. Recovery | 0.252 | 0.024 |
| Hour 1 | 0.431 | 0 |
| Hour 4 | 0.456 | 0 |
| Hour 8 | 0.524 | 0 |
| Hour 12 | 0.633 | 0 |
| Hour 24 | 0.508 | 0 |
Table 4: The relationships between the Fagerstrom and VAS Scores. *: Pearson Correlation Test In other words; the higher the Fage
The Bromage scores were zero in the postoperative 4th hour in all patients receiving regional anesthesia.
Comparisons of the postoperative i.v. tramadol consumption revealed that there was not a statistically significant difference (p>0.05) between the postoperative i.v tramadol consumption levels in Group II; whereas there was a statistically significant difference in Group I (p<0.05), showing that the consumption rates were higher in the heavy smoker subgroup (25.0%). Additional analgesic use was statistically significantly different between Group I and Group II (p<0.05); with a higher extent (45.0%) in the heavy smoker groups in both groups.
Intergroup comparisons revealed that there was a statistically significant difference in the general complication rates between the groups during the 15-minute postoperative awakening period (p<0.05) and that the complication rates (16.7%) were higher in Group I. No statistically significant differences were found in the rest of the evaluation times.
Intragroup comparisons showed no statistically significant differences in the complication rates between the subgroups (control group, heavy smoker and light smoker group) of Group I and Group II at all measurement times (p>0.05).
Discussion
The aim of this dissertation study was to investigate the effects of smoking and dependence levels on the acute postoperative pain levels in patients operated for lower extremity fractures and to compare the general and regional anesthesia methods to find out whether the latter would show any superiority. In our country, regular tobacco users are in the age ranges from 25 to 34 (34.9%) and from 35
to 44 (36.2%) years. While the rate of individuals aged 15 and over, who use tobacco and tobacco products daily or occasionally is 27% in our country; this rate is 23% in the USA. Most of these patients undergo surgery and receive anesthesia [7]. Therefore; creating an awareness about the effects of nicotine addiction, which is an important public health problem, on anesthesia and the intensity of perceived pain is critical in the patient management processes.
Smoking causes various changes via the effects of nicotine. Although animal studies report that nicotine has analgesic properties, it is a risk factor for chronic pain. The analgesic properties of nicotine probably become manifest by its action on the central and peripheral nicotinic acetylcholine receptors (nAChRs). These receptors mediate antinociception via various receptor subtypes in the central and peripheral nociceptive regions. This diversity of neuronal substrates and nAChR subtypes provides a rich environment for analgesic drug development. The extensive need for analgesics increases the costs and untoward effects. Combination of selective positive allosteric agonists will provide an effective strategy to target specific receptor populations and optimize their physiological effects [8].
On the other hand, it has been demonstrated that smokers suffer more from back pain and other types of chronic pain, complicating the patient management and selecting the analgesic medication regimens in smokers in the clinical practice of anesthesia practice. The ways of patient management and analgesic medication regimens in smokers has not been fully understood, yet [9]. Our study found out that the postoperative pain, which is an example of acute pain, was higher in the smokers compared to the nonsmokers; however, the study patients were not followed up for evaluating chronic pain. In addition, smoking has been associated with increased rates of postoperative cardiorespiratory diseases, higher rates of nausea and vomiting, longer lengths of hospital stay, and increased need for admission to intensive care units. It has been reported that these negative data related to smoking decreased by the cessation of smoking 4 weeks before surgery [10].
Comprehensive warnings about the dangers of tobacco use can change attitudes towards smoking, especially among patients who will undergo surgery. Therefore, the preoperative period provides an excellent opportunity to address smoking-related health risks. Studies have shown that patients often seek information about the effects of smoking on anesthesia and emergence of surgical risks. It was found that; compared to non-smokers, the probability of developing major morbidities and mortality increased by 40% in smokers, who underwent a non-cardiac surgery in the first 30 days postoperatively [11]. Another issue investigated in this study was to determine the relationship between the levels of pain and smoking dependence of the participants. The level of nicotine dependence can be measured by the ‘Fagerstrom Dependence Test’; which allows for determining whether the level of nicotine dependence is heavy or light in smokers.
A one-year follow-up study on patients, who had undergone microdiscectomy due to lumbar disc hernia, demonstrated that low back pain and leg pain was higher in smokers [12]. Furthermore, the authors found that the heavy smokers (high level of dependence) who underwent lower extremity surgery under general anesthesia required perioperative analgesia more and that chronic nicotine use increased the incidence of perioperative pain [13]. Total intraoperative and postoperative analgesic requirement for meperidine was significantly low in the nonsmoker group; however, no significant differences were observed in the requirement for diclofenac sodium use. In this study, the VAS scores were higher in heavy smokers both in the general and regional anesthesia groups compared to light and non- smokers.
Another study on patients undergoing thoracic surgery demonstrated that heavy smokers experienced more severe levels of postoperative pain and received more sufentanil after thoracic surgery compared to light smokers. The combination of sufentanil and dexmedetomidine (0.04 μg/ kg/hour) was found to be associated with less analgesic requirement, better analgesic effects, and patient satisfaction in the patients with low levels of nicotine-dependence [14].
Steinmiller, et al. administered opioids with PCA to the patients for 24 hours after spinal anesthesia and recorded the pattern of opioid use. After questioning nicotine use before surgery, they administered PCA to all patients postoperatively. Smokers received more analgesics in the recovery unit before PCA use and these patients required postoperative opioid infusions more [15].
Another study administered PCA postoperatively for 24 hours to all patients receiving regional anesthesia for cesarean section and recorded the level of postoperative pain. Before morphine loading, pain scores were found to be high in the smokers. Pain levels became similar after morphine loading. However, after 24 hours of PCA treatment, the severity of pain was significantly higher in the smokers compared to non-smokers [16].
In our study; compared to spinal anesthesia, the frequency of complications in the postoperative awakening period and the VAS scores in the first 4 hours of the postoperative period were higher with general anesthesia and the VAS scores were higher. These findings were supported by the high levels of HR, SAP, DAP, and MAP values in the early postoperative period in the general anesthesia group. When the sensory block of regional anesthesia was eliminated, higher levels of pain were observed compared to those observed with regional anesthesia, suggesting that epidural PCA should be administered instead of intravenous PCA. Furthermore, there is a need for further studies investigating the combined spinal-epidural anesthesia method.
Conclusion
The level of postoperative pain and requirement for analgesics increases with high levels of smoking dependence. The VAS scores of 4 and lower in the patients receiving postoperative PCA suggest that general or regional anesthesia can be used for these types of surgeries.
References
-
Chapman CR, Vierck CJ (2017) The Transition of Acute Postoperative Pain to Chronic Pain: An Integrative Overview of Research on Mechanisms. J Pain 18(4): 359. e1-359.e38.
-
Gramke HF, de Rijke J, Kleef MV, Kessels AGH, Peters ML, et al. (2009) Predictive Factors of Postoperative Pain After Day-case Surgery. Clin J Pain 25(6): 455-460.
-
Desborough JP (2000) The stress response to trauma and surgery. Br J Anaesth 85(1): 109-117.
-
Aceto MD, Awaya H, Martin BR, May EL (1983) Antinociceptive action of nicotine and its methiodide derivatives in mice and rats. Br J Pharmacol 79(4): 869- 876.
-
Ditre JW, Heckman BW, Zale EL, Kosiba JD, Maisto SA (2016) Acute Analgesic Effects of Nicotine and Tobacco in Humans: A Meta-Analysis. Pain 157(7): 1373-1381.
-
Fagerstrom KO, Heatherton TF, Kozlowski LT (1990) Nicotine addiction and its assessment. Ear Nose Throat 69(11): 763-765.
-
Yararbaş G, Havaçeligi Atlam D (2015) Evaluation of opinions and attitudes of cigarette use in police vocational high school students. Ege J Med 54(3): 114- 119.
-
Umana IC, Daniele CA, McGehee DS (2013) Neuronal nicotinic receptors as analgesic targets: It’s a winding road. Biochem Pharmacol 86(8): 1208-1214.
-
Shi Y, Weingarten TN, Mantilla CB, Hooten WM, Warner DO (2010) Smoking and Pain: Pathophysiology and Clinical Implications. Anesthesiology 113(4): 977-992.
-
Ren C, Zhang X, Liu Z, Li C, Zhang Z, et al. (2015) Effect of Intraoperative and Postoperative Infusion of Dexmedetomidine on the Quality of Postoperative Analgesia in Highly Nicotine-Dependent Patients After Thoracic Surgery: A CONSORT-Prospective, Randomized, Controlled Trial. Medicine 94(32): e1329.
-
Turan A, Mascha EJ, Roberman D, Turner PL, You J, et al. (2011) Smoking and Perioperative Outcomes. Anesthesiology 114(4): 837-846.
-
Madsbu MA, Salvesen O, Werner DAT, Franssen E, Weber C, et al. (2018) Surgery for Herniated Lumbar Disc in Daily Tobacco Smokers: A Multicenter Observational Study. World Neurosurg 109: e581-e587.
-
Zanaty OM (2014) Nicotine smoking: Influences on perioperative pain management. Egyptian J Anaesth 30(4): 373-376.
-
Ren C, Zhang X, Liu Z, Li C, Zhang Z, et al. (2015) Effect of Intraoperative and Postoperative Infusion of Dexmedetomidine on the Quality of Postoperative Analgesia in Highly Nicotine-Dependent Patients After Thoracic Surgery. Medicine (Baltimore) 94(32): e1329.
-
Steinmiller CL, Diederichs C, Roehrs TA, Hyde Nolan M, Roth T, et al. (2012) Postsurgical patient-controlled opioid self-administration is greater in hospitalized abstinent smokers than nonsmokers. J Opioid Manag 8(4): 227-35.
-
Marco AP, Greenwald MK, Higgins MS (2005) A Preliminary Study of 24 Hour Post Cesarean Patient Controlled Analgesia: Postoperative Pain Reports and Morphine Requests/Utilization Are Greater in Abstaining Smokers than Non-Smokers. Med Sci Monit. 11(6): 255-261.
- Editorial on Multimodal Analgesia
- Surgical Incision Site Local Anaesthetic Infiltration and Superior Hypogastric Plexus Block in Total Abdominal Hysterectomy Under General Anaesthesia- A Placebo-Controlled, Randomized Clinical Trial
- Supraglottic Airway Insertion in Semi Fowler Position Due to Severe Thoracic Hyperkyphosis: A Case Report
- Anaesthetic Management of Cardiac Myxoma Patient with Systemic Involvement: A Case Report
- Current Problems in Pulmonary Respiratory Distress Syndrome (Literature Review)
- Evolution of Perioperative Hemodynamic Monitoring from the Hand on Pulse to Hypotension Prediction Index