A Forensic Evaluation: the use of Mercury and Stable Isotope analysis of Museum Bone Samples to Monitor if Environmental Changes are affecting the Eating Patterns of Red and Arctic Foxes
Global climate changes can potentially impact the ecosystems of the red foxes (Vulpes vulpes) and Arctic foxes (Alopex lagopus) on a regional scale. This research takes a forensic approach at investigating certain health and dietary indicators in museum preserved bone of red foxes of Bethel Alaska and Arctic foxes from the Yukon Territory in Canada. This study attempts to 1) measure the mercury (THg) concentration levels, 2) estimate a diet using carbon stable isotopes (δ13C) and 3) establish a trophic level using nitrogen stable isotopes (δ15N), from bones of these sentinel species. This study examines two Arctic foxes and three red foxes of unknown age and origin. The Yukon Territory Arctic foxes bone THg concentrations were 0.017 and 0.025 mg/kg. The red foxes bone THg concentrations were 0.010, 0.036 and 0.073 mg/kg. The δ13C levels were -21.13 and -21.36‰ for Arctic foxes and -20.05, -20.08, and -23.12‰ for red foxes. Their δ15N levels were 5.59 and 7.22‰ for the Arctic foxes and 6.10, 6.57 and 6.66‰ for red foxes. These Arctic and red Yukon Territory foxes indicate a trophic level similar to Arctic terrestrial omnivores. This type of forensic study is useful to establish past ecosystems of the Arctic. In understanding past ecosystems we can then monitor the effects of climate change and its impact on human health and the health of terrestrial animals.
Introduction
Forensic science uses observations and analytical techniques to measure data from wildlife remains. The commonly used techniques include toxicology and stable isotope analysis of animal bone [1, 2]. Since the impact of mercury (THg) to the environment is increasing, it’s ability to build up in organisms and food webs has a significant influence on the health of animals. Therefore, understanding THg contamination in the environment can help prevent ecological effects on biological diversity which lead to damage of ecosystems in the Arctic region [3]. The stable isotopic (δ13C and δ15N) composition of animal tissues can establish a relationship between diet, geographic location and trophic levels in archaeological and palaeodietary studies [1, 2].
The slower decay rates of proteins and nucleic acids in bone make it more readily available than soft tissues for analysis [4, 5, 6]. The baseline study of THg concentrations [7] and stable isotopes [8] in modern red fox bones from Alaska in animal bones has been useful in evaluating current toxicant levels, diets, and trophic levels in the far North. Since bones are available in museum collections around the North, they can be used to understand the past diets of wildlife.
These established baselines will help to monitor future toxicant and dietary changes due to climate changes facing our Northern environment.
An important resource for exploring diets of past wildlife populations is archival bones from museums. Museum bones can establish baselines for different areas of the world, and be used to predict future dietary changes of wildlife populations. This research tries to determine if contaminants, such as THg, are possibly increasing due to climate changes in the Arctic, and to establish a historical baseline for contaminants based upon the age of the bones. It is important to establish such a baseline as the release of THg into the environment, with potential methylation, the foxes tissues will likely accumulate THg concentrations, causing damage to the animals organ systems [7]. Lanocha, et al. [9] is another example of THg in wild northern red fox omnivore bones. Where Lanocha and colleagues [9] report on the THg concentrations in bones and the effects on the osseous–articular system.
Over the last several decades, stable isotopes have been developed as tools for studying animal migration patterns, as well as movements of elements through the biosphere. Stable isotopes of carbon and nitrogen levels are used to reconstruct the dietary life history of individual animals [5, 10, 11] to inform wildlife management policy. Stable isotope tracers in environmental research can incorporate stable isotope signals into landscape maps [12, 13]. In addition, stable isotopes have been useful in studying the feeding habits of species, and are valuable chemical descriptors of niche space, food web organization, nutritional shifts, and community ecology [13, 14, 15, 16, 17]. Bone collagen has been used in several diet studies to determine if an animal is eating from an exclusive marine environment or not [18, 19, 20, 21]. One paleoecology study used bone collagen to predict trophic levels in red deer [21]. Another study used ancient and modern bone collagen from a lynx and wolf, from Bialowieza primeval forest in Poland, to predict trophic levels [22]. Growth studies, faunal analysis, and paleopathology are just a few of the nutritional assessment studies that provide information of past diets by stable isotope analysis of bone collagen [23, 24].
Diagenesis of bone is the breakdown of bone and its interaction with the local physical, chemical and biological environment over time [25]. These processes modify the bone’s original structural and chemical properties and can either preserve or destroy the bone. Physical factors such as soil and climate, and chemical factors such as deterioration of the organic and mineral phases, as well as biological factors such as alterations that take place on the bone itself in a burial context, all are part of the diagenesis process [26]. Of note, during diagenesis mercury on the surrounding environment can invade the porosity portion of bone [6].
Bones are not in equilibrium with the soil solution of a particular environment and therefore undergo chemical deterioration [25, 27]. Bone exposed to moist environmental conditions, a key agent of change in diagenesis, is altered in the proportions of the inorganic components (e.g. calcium, hydroxyapatite, magnesium) and the organic component (e.g. collagen). Various types of soil components also absorb onto the bone surface and cause the components of bone to leach out [26, 28]. Some studies have described techniques for the preservation of bone, classification of soil environment, and detection of the factors in the environment which affect the preservation of bone [27, 29].
In one forensic study in Japan, mercury was detected in excavated bones [30]. Under dry conditions, δ13C and δ15N values change less than 0.4‰ during the critical first 195 hours; and, in the presence of excess water, δ13C and δ15N values change up to 1.0‰ and 0.5‰, respectively [31]. On the other hand, Schoeninger, et al. [32] argue that a low yield of collagen does affect stable isotope values. Hare, et al. [33] demonstrated that bone with less than a 5% protein content has a basically non-collagenous amino acid composition, and therefore suggested not to be used.
The study presented here starts an example from a museum bone collection for the Red and Arctic fox relating to climate and industrialization changes in the far North. It is a collaborative study, with graduate student Garrett Savory, who has reported on Arctic foxes [34, 35] to examine the application of wildlife forensics using THg and δ13C and δ15N stable isotope analysis from museum samples. We examined archived museum samples from “The Yukon Fossil Collection”, supplied by Dr. Grant Zazula, a Yukon Paleontologist with the Heritage Resources Unit, Cultural Services Branch, Department of Tourism & Culture, Government of Yukon. The age of the bones are unknown, and could range from historic to modern. Thus, we are using the term ‘fossil’ when referring to these museum bones from the Yukon Territory in Canada per Dr. Zazula’s estimations. We report the THg accumulation and δ13C and δ15N levels of two Arctic and three red fox bone samples, to compare the fox’s past feeding ecology and trophic levels in their changing environment. The red foxes from the Yukon Fossil Collection are compared to that of the modern red fox bones from Bethel Alaska in a previous study on THg concentrations [7] and stable isotopes [8].
Material and Methods Study area
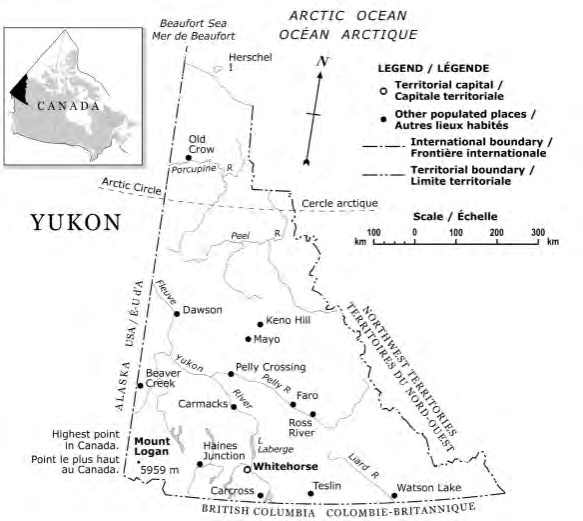
The Arctic and red fox bones that were found in the Yukon Territory in Canada (Figure 1), are part of the Yukon Fossil Collection (Table 1). Herschel Island, part of the Yukon Territory, is a cultural site located in the Beaufort Sea, which is part of the Arctic Ocean. It is approximately five kilometers from the coast of the Yukon at the most northern region of the territory [36]. Allgold Creek is a small body of running water, a stream, in the Yukon Territory in Canada [37]; where as, Quartz Creek is a tributary of the Indian River Drainage (part of Bering Sea drainage basin and a tributary of the Yukon River) in the Yukon Territory in Canada [38]. Both creeks, Quartz Creek in the Klondike district and Allgold Creek in Dawson City area, have a history of gold mining [39, 40]. While Herschel Island is a coastal tundra ecosystem, the Yukon River drainage is considered a Boreal Forest.
| Species | Specimen Type | Locality | |
|---|---|---|---|
| YG 12.49 | Alopex lagopus | right femur | Hershel Island |
| YG 155.2 | Alopex lagopus | right mandible | Hershel Island Beach |
| YG 97.3 | Vulpes vulpes | right tibia | Allgold Creek |
| YG 97.4 | Vulpes vulpes | left femur | Allgold Creek |
| YG 130.65 | Vulpes vulpes | right femur | Quartz Creek |
Table 1: Yukon Fossil Collection shows the THg concentrations in milligrams per kilogram (mg/kg) for individual samples and stabl
Sample Preparation and Mercury Analysis
Bones were cored under a fume hood while wearing a 3M™ particulate respirator N95. The bone cores were obtained by using a Dremel™ glass diamond drilling bit, 1/4″(6.350 mm), 663DR, drill speed #23. Each bone was drilled at three locations to produce six cores. The periosteum and any trabecular bone were removed from each core using a Dremel™ glass diamond taper point sander 3/32″ (2.381 mm), #7144. Total core mass was determined for each individual for a total wet weight (ww). The cores were stored at -20°C in acid-washed (5% HNO3) vials prior to degreasing.
Prior to mercury analysis, bone cores were degreased with a series of chloroform treatments in a chemical fume hood [18, 41, 42, 43, 44]. Enough chloroform (Chloroform, Reagent ACS, Sciencelab.com) was added to each vial to completely cover bone core samples. Each vial was then loosely capped. Samples were treated for a total of 16 hours, changing chloroform after 8 hours. After chloroform treatments, samples were rinsed several times with ultrapure water. Zwanziger [44] suggested that freeze drying bone results in decreased THg concentrations, thus degreased samples were air-dried in the fume hood for four days. Bone was homogenized for analysis using a Wig-L-Bug™ (Crescent Dental Company Chicago) with a 9.5 mm stainless steel ball bearing (~10 s).
Approximately 30 mg of homogenized powdered bone was analyzed for THg using a 3-cell low detection DMA-80 Direct Mercury Analyzer (Milestone Inc., Shelton, Connecticut, USA; USA EPA method 7473). The low detection DMA-80 was calibrated using a 6 point linear calibration curve from 0.25 ng to 6.00 ng; R2 = 0.9999, resulting in a minimum detection limit of 0.008 μg/g. All analytical runs included measurement of blanks, liquid standards (1 μg/g, 0.1 μg/g, 0.01 μg/g) and a reference material, SRM 1486 [7].
Sample preparation and stable isotope analysis
Bones were cored under a fume hood while wearing a 3M™ particulate respirator N95. Each bone was cored using a Dremel™ glass diamond drilling bit, ¼″ (6.350mm), 663DR, drill speed #23. Each femur was drilled completely through the shaft in three locations to produce six cores. Four cores were used in a similar study of total mercury [7], and the remaining 2 cores were used in this stable isotope study. The periosteum and any trabecular bone were removed using a Dremel™ glass diamond taper point sander, 3/32″ (2.381mm), #7144. The cores were stored at -20˚C in acid- washed (5% HNO3) vials prior to degreasing. The degreasing method used is as follows: bone core samples were sonicated in deionized water in order to remove any debris. Next, they were soaked in chloroform for two 8 hour periods to remove any lipids, then finally rinsed with deionized water and air- dried under a fume hood for 3 days.
The bone collagen extraction was a variation of the methods set forth by Matheus [45]. The method is as follows: bone samples were demineralized by soaking in an HC1- H2O solution until they were translucent. After which they were rinsed with deionized water. In order to separate the collagen from other organic compounds and proteins, the bone samples were gelatinized by placing the collagen samples, with an HC1-H2O solution (pH between 3.0 and 4.0) in a culture tube. The tube was heated to 70°C, under a stream of nitrogen, to dissolve the collagen. The supernatant was lyophilized to retrieve the collagen after centrifugation.
Between 0.1 and 0.2mg of bone collagen samples were placed in tin capsules then loaded into an autosampler. Samples were analyzed for stable carbon and nitrogen isotopes at the Alaska Stable Isotope Facility at the University of Alaska Fairbanks. A continuous-flow isotope ratio mass spectrometry with a Costech ECS4010 Elemental Analyzer (Costech Analytical Technologies Inc., Valencia, CA, USA) interfaced to a Finnigan Delta Plus XP isotope ratio mass spectrometer via the Conflo III interface (Thermo Fisher Scientific, Waltham, MA, USA) was used for analyzing.
The laboratory standard was measured multiple times between samples to evaluate the accuracy and precision of analyses. Accuracy and precision was assessed using multiple peptone standards. Precision was within 0.3‰ and accuracy was within 0.1‰ for both δ13C and δ15N values. Isotope ratios are presented as stable isotope abundances relative to the international standard (delta (δ) notation) in parts per thousand (permil (‰):
δX = ((Rsample/Rstandard)-1) × 103, ‰
where, element X = 13C or 15N and R is the molar ratios of heavy to light isotope of the sample and the standard [16]. These isotope ratios are expressed in delta notation of per mil relative to the Vienna PeeDee Belemnite international standards for carbon, and atmospheric N for nitrogen. These standard values are measured using a laboratory standard (peptone) calibrated against several certified reference materials [16].
Statistical Analysis
The Yukon Fossil Collection consists of a small sample size of two red fox bones, and three Arctic fox bones; therefore, statistical methods should not be applied nor can statistical inference be made on the basis of such a small sample size. Because a statistical method could not be applied, we only reported the THg concentrations and δ13C and δ15N stable isotope values of this collection. The findings for the THg concentrations and for the δ13C and δ15N stable isotope values are presented in both Tables & Figures. The two Arctic fox bones from the Yukon Fossil Collection will not be compared to any study, and are added to the red fox Tables & Figures for a visual analysis only.
Results
The THg concentrations for the Yukon Fossil Collection are shown in Table 2; and the δ13C and δ15N stable isotope values for the Yukon Fossil Collection are also shown in Table 2.
| Identification | Species | Specimen Type | Locality | THg | δ13C | δ15N |
|---|---|---|---|---|---|---|
| YG 12.49 | Alopex lagopus | right femur | Hershel Island | 0.017 | -21.13 | 5.59 |
| YG 155.2 | Alopex lagopus | right mandible | Hershel Island Beach | 0.025 | -21.36 | 7.22 |
| YG 97.3 | Vulpes vulpes | right tibia | Allgold Creek | 0.036 | -20.18 | 6.1 |
| YG 97.4 | Vulpes vulpes | left femur | Allgold Creek | 0.073 | -20.05 | 6.66 |
| YG 130.65 | Vulpes vulpes | right femur | Quartz Creek | 0.01 | -23.12 | 6.57 |
Table 2: Yukon Fossil Collection shows the THg concentrations in milligrams per kilogram (mg/kg) for individual samples and stabl
Yukon Fossil Collection THg Concentrations and δ13C and δ15N Stable Isotope Values
The THg bone samples vary slightly from 0.010 mg/kg to 0.073 mg/kg for the red foxes and 0.017 mg/kg and 0.025 mg/kg for the Arctic foxes. The stable isotope bone samples also vary slightly from -20.05‰ to -23.12‰ for the red foxes δ13C values and -21.13‰ to -21.36‰ for the Arctic foxes δ15N values.
Yukon Fossil Collection Verses Bethel, Alaska for THg and δ13C and δ15N Stable Isotopes
The THg concentrations in modern red foxes from Bethel, Alaska study [7] was compared to the Yukon Fossil Collection bones of red foxes from Yukon, Canada. The two red fox bones from the Yukon Fossil Collection, YG 97.3 and YG 97.4 had a THg concentration of 0.036 mg/kg and 0.073 mg/kg, respectively. These THg concentrations were higher than the Bethel, Alaska red foxes at 0.010 mg/kg. On the other hand, the Arctic foxes from the Yukon Fossil Collection, YG 12.49 and YG 155.2 had THg concentrations of 0.017 mg/ kg and 0.025 mg/kg respectively.
The δ13C and δ15N stable isotope values in modern red foxes from Bethel, Alaska study [8] were compared to the Yukon Fossil Collection bones of red foxes from Yukon, Canada. In comparing both red fox collections we see that the Yukon red foxes δ13C values (Table 2) are higher than those of the Bethel, Alaska study. The Arctic foxes, from the Yukon Fossil Collection, δ13C values were -21.13‰ for YG 12.49 and -21.36‰ for YG 155.2. The δ15N values for the Yukon, Canada red fox samples (Table 2), are lower than those in the Bethel, Alaska study. The Arctic foxes, from the Yukon Fossil Collection, δ15N values were 5.59‰ for YG 12.49 and 7.22‰ for YG 155.2.
Discussion
The red fox bone samples from the Yukon Territory Fossil Collection, are few and not well documented for such a large territory (Figure 1). There is no background information about these fox bones housed at the Department of Tourism & Culture with the Government of Yukon museum. Consequently, many forensic questions are unanswered. Were the bones found along the beach? Just sitting on the ground? Any soil samples associated with these bones? How were they handled before taken to the museum? How were they stored at the museum? How old are the bones? Do different bones, (i.e. femur, tibia, mandible) yield different THg concentrations and/or δ13C and δ15N values? Additionally, the three red foxes and two Arctic foxes bones come from four (4) different areas in the Yukon Territory, Canada. Also there is no indication of the sex of these fox bones.
These many unanswered questions prevent making statistical analyses and assessments. Therefore, we can only provide a visual comparison in Figures 2 & 3 and speculate with the caution that we have only five samples from four different locations in the Yukon Territory (Table 2). Our assessment about THg concentration levels as well as δ13C and δ15N levels for dietary and trophic levels is a general estimation. Overall, Figures 2 & 3 demonstrate that these five Yukon fossil samples fall within the variation of the values reported for the red foxes in the Bethel region of Alaska [7].
![Figure 2: δ13C stable isotope values of bone collagen as an indication of diet. Blue colored squares are Yukon Territory Arctic foxes. Open large circles are Yukon Territory red foxes. Potential food sources data from Hobson, et al., Neil and Cornwell, Roth, et al., Schmutz and Hobson, Wilkinson, et al. [8,46-50].](/fulltextimages/7526/fig_2.png)
![Figure 3: δ15N stable isotope values of bone collagen an indication of trophic level. Blue colored squares are Yukon Territory Arctic foxes (n=2). Open large circles are Yukon Territory red foxes (n=3). Large green triangle with red border represents Bethel red foxes (n=65). Marine and terrestrial trophic level data from Hobson, et al., Neil and Cornwell, Roth, et al., Schmutz and Hobson, Wilkinson, et al. [46-50], and Anthropogenic (representing humans eating C4 plants) data from Leconte, et al. [51].](/fulltextimages/7526/fig_3.png)
Figure 3: δ15N stable isotope values of bone collagen an indication of trophic level. Blue colored squares are Yukon Territory Arctic foxes (n=2). Open large circles are Yukon Territory red foxes (n=3). Large green triangle with red border represents Bethel red foxes (n=65). Marine and terrestrial trophic level data from Hobson, et al., Neil and Cornwell, Roth, et al., Schmutz and Hobson, Wilkinson, et al. [46, 47, 48, 49, 50], and Anthropogenic (representing humans eating C4 plants) data from Leconte, et al. [51].
In comparing both red fox collections we see the Yukon Territory red foxes THg concentrations, as seen in Table 2, are ten times higher in mercury than the average reported for the Bethel red foxes of 0.004 mg/kg [7]. Two Yukon Territory red foxes, YG 97.3 and YG 97.4, seem to be eating at a higher trophic level than their counterparts, the same northern Arctic foxes of the Yukon Territory. A possible explanation is that one red fox in particular, YG 97.4, having 0.073 mg/kg THg concentration, is obtaining mercury from it’s surrounding environment since it was found in Allgold Creek old mining area. In the North this often leads to mercury and other metal accumulation [52]. The Yukon Territory red fox, YG 97.3, also from Allgold Creek area, and with 0.036 mg/kg THg concentration level, also has higher mercury concentrations from the same mining area. Additionally, these two red foxes could also be eating trash, from the mining area, which could contain fish, such as canned tuna, an aquatic source usually higher in mercury.
The Yukon Territory red fox, YG 130.65, as well as both Yukon Territory Arctic foxes, YG 12.49 and YG 155.2, seem to be eating a less THg contaminated diet at Quartz Creek. Even though Quartz Creek is another mining area in the Yukon Territory, this red fox has the lowest THg level (Table 2). This lower THg level may be indicative of this particular bone found before the mine was established. In addition, by one red fox having a low THg of .010 mg/kg at Quartz Creek, in contrast to the two red foxes, YG 97.3 and YG 97.4, having higher THg levels at Allgold Creek, we have demonstrated that a forensic approach can provide evidence of THg concentration differences in two different localities, yet two similar gold mining areas, in the Yukon Territory of Canada.
One solution to identify any THg uptake in an animal’s diet is to collect soil samples. Soil samples would help identify the toxicants that might be affecting plant life; thus, ultimately affecting the health of wildlife that consumes any of these contaminated plants and/or berries. One would also ask, is the increased localized contamination due to industrial activity? Are the wastes from industrialization spreading further out in the environment or contained within a specific area? With bones from various time frames, and in the same general location, as well as surrounding soil to analyze, it can be shown that it is possible to determine if the environment is changing [53, 54]. This would help to answer the following future questions: Are the animals migrating north due to a changing environment? If so, are movement patterns of animals affecting their diet? Does this new diet affect the trophic positions of the red and Arctic fox?
At Quartz Creek, fox YG 130.65, has a higher δ13C stable isotope value (Table 2 and Figure 2). The δ13C stable isotope of this Quartz Creek red fox is clearly similar in grouping as the Bethel Alaska red foxes, tending toward a terrestrial mammal diet, such as voles. In contrast, Figure 2 shows the δ13C values for both the Yukon Territory Arctic foxes and the two Allgold Creek red foxes, YG 97.3 and YG 97.4, tend toward a salmon migration or aquatic diet.
For δ15N values, there is a tendency to have an increase of 2.00-4.00‰ at each trophic level, however, this depends on the tissue being examined [55, 56, 57]. Bone collagen, because of its isotopic composition being reflective of a diet over a lifetime, has a δ15N enrichment value (between predator and prey) around 2.00‰ [22]. Other factors that can influence the δ15N composition is the environment, seasons, and physiological factors of animals (e.g. hair growth and muscle fitness) [16, 55]. For example, in moister and cooler ecosystems plants would retain δ15N and thus have a lower 14N/15N ratio [16, 57]. The δ15N indicates that the red foxes from Bethel, Alaska are eating at a lower trophic level which could indicate a herbivore influence [7]. The δ15N values of the Yukon Territory red and Arctic foxes are in line with a trophic level of Arctic terrestrial omnivores like wolves [58], and may tend toward a slight salmon diet.
Stable isotope data can explain the mercury levels, which can be influenced by changes in seasonal diet of the red fox. The THg study of the Bethel, Alaska red foxes reported in Dainowski, et al. [7] along with this stable isotope data has shown that as δ15N increases so does THg. These isotope values of the red fox’s diet items versus the THg concentrations implies that the THg may be coming through the mixed lemming/aquatic/avian pathway (likely fish or other fish eating birds) for those foxes with the higher mercury contents [59, 60].
Identifying the trophic positions of the red and Arctic fox populations allows for risk assessment of contaminants. Mercury is not a problem now (based upon Bethel, Alaska red fox study) or possibly in the past (based upon unknown sources of contamination in the Yukon Territory bones). But as climate change warms and impacts the physical and biological composition of ecosystems, the situation might change suggesting continued monitoring of these species.
Conclusion
There are only three red foxes and two Arctic foxes in the Yukon Fossil Collection and by no means can this be a definitive analysis of all foxes in the Yukon Territory of Canada. Even though the museum sample numbers were very small, this study provided a good starting point using a forensic method to make predictions of diet and trophic levels during climate changes in the Arctic. And, since the samples in this study were poorly characterized only limited interpretation was possible. However, we showed that museum specimens are valuable because 1) metals can be detected, 2) bone collagen from fossil bones is preserved and thus stable isotopes can be detected and 3) comparisons to extant populations can be determined. While limited, this study supports the concept of red foxes as a useful sentinel species distinguishing between climate change in the North and industrial contamination. This study also has shown to be an important forensic approach in providing information to managers about increases in scale in the understanding of climate impacts on mammalian species.
Funding
Research reported in this publication was supported by the National Institute of General Medical Sciences of the National Institutes of Health under Award Number P20GM103395. The content is solely the responsibility of the authors and does not necessarily represent the official views of the National Institutes of Health.
References
-
Meier-Augenstein W, Fraser I (2008) Forensic Isotope analysis leads to identification of a mutilated murder victim. Sci Justice 48(3): 153-159.
-
NRC (2009) Publications Available in the Agencywide Documents Access and Management System (ADAMS).
-
Duffy LK, Vertigan T, Dainowski B, Dunlap K, Hirons A (2017) Climate Change, One Health and Mercury. Adv Clin Toxicol 2(1): 1-6.
-
Doyle JJ (1979) Toxic and essential elements in bone-a review. Sri J Anim Sci 49(2): 482-49.
-
Lehner N (2012) Arctic Fox Winter Movement and Diet in Relation to Industrial Development on Alaska’s North Slope (MS Thesis). University of Alaska Fairbanks, Fairbanks, AK.
-
Nielsen-Marsh CM, Hedges REM (1999) Bone porosity and the use of mercury intrusion porosimetry in bone diagenesis studies. Archaeometry 41(1): 165-174.
-
Dainowski BH, Duffy LK, McIntyre J, Jones P (2015) Hair and bone as predictors of tissular mercury concentration in the Western Alaska Red Fox, _Vulpes vulpes_. Sci Total Environ 518-519: 526-533.
-
Dainowski BH, Duffy LK, McIntyre J, Jones P (2020) Stable carbon and nitrogen isotopes of a sentinel species, the western Alaska red fox (_Vulpes Vulpes_). Adv Clin Toxicol 5(1): 1-10.
-
Lanocha N, Kalisinska E, Kosik-Bogacka DI, Budis H, Noga- Deren K (2012) Trace metals and micronutrients in bone tissues of the red fox _Vulpes vulpes_ (L., 1758). Acta Theriol 57(3): 233-244.
-
Hobson KA (1999) Tracing origins and migration of wildlife using stable isotopes: a review. Oecologia 120(3): 314-326.
-
Hobson KA (2005) Stable isotopes and the determination of avian migratory connectivity and seasonal interactions. Auk 122(4): 1037-1048.
-
Crawford K, McDonald RA, Bearhop S (2008) Applications of stable isotope techniques to the ecology of mammals. Mamm Rev 38(1): 87-107.
-
Gannes LZ, O’Brien DM, Martínez del Rio C (1997) Stable isotopes in animal ecology: assumptions, caveats, and a call for more laboratory experiments. Ecology 78(4): 1271-1276.
-
Dehn LA, Follmann EH, Thomas DL, Sheffield GG, Rosa C, et al. (2006) Trophic relationships in an Arctic food web and implications for trace metal transfer. Sci Total Environ 362(1-3): 103-123.
-
DeNiro MJ, Epstein S (1978) Influence of diet on the distribution of carbon isotopes in animals. Geochim Cosmochim Acta 42(5): 495-506.
-
Fry B (2006) Stable Isotope Ecology. 1st (Edn.), Springer- Verlag New York, New York, USA, pp: 12-308.
-
Robbins CT, Felicetti LA, Sponheimer M (2005) The effect of dietary protein quality on nitrogen isotope discrimination in mammals and birds. Oecologia 144(4): 534-540.
-
Bell LS, Cox G, Sealy J (2001) Determining isotopic life history trajectories using bone density fractionation and stable isotope measurements: a new approach. Am J Phys Anthropol 116(1): 66-79.
-
Jim S, Ambrose SH, Evershed RP (2004) Stable carbon isotopic evidence for differences in the dietary origin of bone cholesterol, collagen and apatite: implications for their use in palaeodietary reconstruction. Geochim Cosmochim Acta 68(1): 61-72.
-
Schoeninger MJ, DeNiro MJ (1984) Nitrogen and carbon isotopic composition of bone collagen from marine and terrestrial animals. Geochim Cosmochim Acta 48(4): 625-639.
-
Stevens RE, Lister AM, Hedges REM (2006) Predicting diet, trophic level and palaeoecology from bone stable isotope analysis: a comparative study of five red deer populations. Oecologia 149(1): 12-21.
-
Bocherens H, Drucker D (2003) Trophic level isotopic enrichment of carbon and nitrogen in bone collagen: case studies from recent and ancient terrestrial ecosystems. Int J Osteoarchaeol 13(1-2): 46-53.
-
Ben-David M, Flaherty E (2012) Stable isotopes in mammalian research: a beginner’s guide. J Mammal 93(2): 312-328.
-
Klepinger LL (1984) Nutritional assessment from bone. Annu Rev Anthropol 13: 75-96.
-
Collins MJ, Nielsen-Marsh CM, Hiller J, Smith CI, Roberts JP, et al. (2002) The survival of organic matter in bone: a review. Archaeometry 44(3): 383-394.
-
Hedges REM (2002) Bone Diagenesis: An Overview of Processes. Archaeometry 44(3): 319-328.
-
Dietz R, Outridge PM, Hobson KA (2009) Anthropogenic contributions to mercury levels in present-day Arctic animals-a review. Sci Total Environ 407(24): 6120-6131.
-
Vast AA (2001) Beyond the grave: understanding human decomposition. Microbiology Today 28: 190-192.
-
Jans MME, Kars H, Nielsen-Marsh CM, Smith CI, Nord AG, et al. (2002) In situ preservation of archaeological bone: a histological study within a multidisciplinary approach. Archaeometry 44(3): 343-352.
-
Yamada M, Tohno S, Tohno Y, Minami T, Ichii M, et al. (1995) Accumulation of mercury in excavated bones of two natives in Japan. Sci Total Environ 162(2,3): 253- 256.
-
McNulty T, Calkins A, Ostrom P, Gandhi H, Gottfried M, et al. (2002) Stable isotope values of bone organic matter: Artificial diagenesis experiments and paleoecology of Natural Trap Cave, Wyoming. Palaos 17: 36-49.
-
Schoeninger MJ, Moore KM, Murray ML, Kingston JD (1989) Detection of bone preservation in archaeological and fossil samples. Appl Geochemistry 4(3): 281-292.
-
Hare PE, Fogel ML, Stafford TW, Mitchell AD, Hoering TC (1991) The isotopic composition of carbon and nitrogen in individual amino acids isolated from modern and fossil proteins. J Archaeol Sci 18(3): 277-292.
-
Savory G (2013) Foxes and Food Subsidies: Anthropogenic food use by red and arctic foxes, and effects on arctic fox survival, on the arctic coastal plain of Alaska. (MS Thesis). University of Alaska Fairbanks, Fairbanks, AK.
-
Savory GA, Hunter CM, Wooller MJ, O’Brien DM (2014) Anthropogenic food use and diet overlap between red foxes (Vulpes vulpes) and arctic foxes (Vulpes lagopus) in Prudhoe Bay, Alaska. Can J Zool 92(8): 657-663.
-
National Trust for Canada (2018) Herschel Island.
-
Traveling Luck (2018) Traveling Luck for Allgold Creek, Yukon, Canada.
-
(2016) Indian River (Yukon).
-
(2016)Dulac Mining ‘Home’.
-
Mindat.org (2017) Klondike Area (Klondyke Districk; Klondike District), Dawson Mining Districts, Yukon Canada.
-
Aerssens J, Boonen S, Lowet G, Dequeker J (1998) Interspecies differences in bone composition, density, and quality: potential implications for in vivo bone research. Endocrinology 139(2): 663-670.
-
Dwell J (2010) The periosteum: what is it, where is it, and what mimics it in its absence? Skeletal Radiol 39(4): 319-323.
-
Schutkowski H, Herrmann B (1999) Diet, status and decomposition at Weingarten: trace element and isotope analyses on early mediaeval skeletal material. J Archaeol Sci 26(6): 675-685.
-
Zwanziger H (1989) The multielemental analysis of bone. Biol Trace Elem Res 19(3): 195-232.
-
Matheus PE (1997) Paleoecology and ecomorphology of the giant short-faced bear in Eastern Beringia. (PhD Dissertation), University of Alaska Fairbanks, Fairbanks, AK.
-
Hobson KA, McLellan BN, Woods JG (2000) Using stable carbon (δ13C) and nitrogen (δ15N) isotopes to infer trophic relationships among black and grizzly bears in the upper Columbia River basin, British Columbia. Can J Zool 78(8): 1332-1339.
-
Neil C, Cornwell JC (1992) Stable carbon, nitrogen, and sulfur isotopes in a prairie marsh food web. Wetlands 12: 217-224.
-
Roth JD, Marshall JD, Murray DL, Nickerson DM, Steury TD (2007) Geographic gradients in diet affect population dynamics of Canada lynx. Ecology 88(11): 2736-2743.
-
Schmutz JA, Hobson KA (1998) Geographic, temporal, and age-specific variation in diets of Glaucous Gulls in western Alaska. Condor 100(1): 119-130.
-
Wilkinson MJ, Yai Y, O’Brien DM (2007) Age-related variation in red blood cell stable isotope ratios (delta13C and delta15N) from two Yupik villages in southwest Alaska: a pilot study. Int J Circumpolar Health 66(1): 31- 41.
-
Leconte N, Ahlstrom O, Ehrich D, Fuglei E, Ims RA, et al. (2011) Intrapopulation variability shaping isotope discrimination and turnover: experimental evidence in Arctic Foxes. PLoS ONE.
-
Ben-David M, Duffy LK, Glundell GM, Bowyer RT (2001) Natural exposure of coastal river otters to mercury: Relation to age, diet, and survival. Environ Toxicol Chem 20(9): 1986-1992.
-
Murray M, McRoy CP, Duffy LK, Hirons AC, Schaef JM, et al. (2015) Biogeochemical analysis of ancient Pacific Cod bone suggests Hg bioaccumulation was linked to Paleo sea level rise and climate change. Front Environ Sci 3(8): 1-8.
-
Stephen C, Duncan C (2017) Can wildlife surveillance contribute to public health preparedness for climate change? A Canadian perspective. Clim Change 141: 259- 271.
-
Adams TS, Sterner RW (2000) The effect of dietary nitrogen content on trophic level 15N enrichment. Limnol Oceanogr 45(3): 601-607.
-
Handley LL, Austin AT, Stewart GR, Robinson D, Scrimgeour CM, et al. (1999) The 15N natural abundance (δ15N) of ecosystem samples reflects measures of water availability. Aust J Plant Physiol 26(2): 185-199.
-
Szpak P, White CD, Longstaffe FJ, Millaire JF, Sánchez VVF (2013) Carbon and Nitrogen Isotopic Survey of Northern Peruvian Plants Baselines for Paleodietary and Paleoecological Studies. PLOS ONE.
-
McGrew A, Ballweber L, Moses S, Stricker C, Beckmen K, et al. (2013) Mercury in gray wolves (Canis lupus) in Alaska: increased exposure through consumption of marine prey. Sci Total Environ 468-469: 609-613.
-
Tavares PC, Kelly A, Maia R, Lopes RJ, Santos R, et al. (2008) Variation in the mobilization of mercury into Black-winged Stilt Himantopus himantopus chicks in coastal saltpans, as revealed by stable isotopes. Estuar Coast Shelf Sci 77(10): 65-76.
-
(2020) Yukon Territory with Herschel Island.
- Pattern of Gonadal Hormones in Oral Testosterone-Supplimented Male Wistar Rats with Diabetes-Induced Hypogonadism
- Re-Evaluation of the Genotoxicity of Currently Used Food Dyes in Mouse Multiple Organs Via Continuous Administration by Drinking Using the Comet Assay
- Pharmacogenetics of Type 2 Diabetes Mellitus: Linking Genetic Variability to Drug Efficacy and its Cardiovascular Outcomes
- Exploratory Proteomic Profiling of SARS-CoV-2 Infected THP-1 Macrophages Reveals Alterations in Inflammatory Response and Cellular Metabolism
- Study of Genotoxicity of Hepatocarcinogens in Multiple Organs in Mice by Feeding and Drinking Using the Comet Assay
- Spirulina Polypeptides Inhibit the Growth of Human Lung Tumor (H460) Cells