Modelling of the Antibacterial Activity of Some Benzimidazole Derivatives
In this study, an attempt has been made to obtain the most significant QSAR model for modeling the logMIC activity of the benzimidazole derivatives as synthesized and reported by Seydal. For this purpose, some topological descriptors have been calculated using mol files created through Chemsketch software. The Dragon software has been used for the calculation of a pool of descriptors. Then stepwise regression analysis was done which resulted in statistically significant models. A twoparametric model has been found to be the best with R2 equal to 0.9487. The R2cv for the model comes out to be 0.94595 which confirms that the model may be accepted. The other tests for the proposed model e.g., VIF parameters and Ridge analysis also support the findings.
Introduction
Benzimidazole is an aromatic heterocyclic chemical molecule. that forms with the union of the rings of the aromatic chemicals benzene and imidazole. Its commonly used substituted derivatives are generated by conducting condensation with aldehydes instead of formic acid, followed by oxidation. The United States Food and Drug Administration lists benzimidazole derivatives as one of the most used ring systems for small molecule medicines. Many medications in the benzimidazole class of chemicals operate as angiotensin II receptor blockers, benzimidazole fungicides, antihistamines, anthelmintics, and antipsychotics.
During the literature survey, it has been observed that many derivatives of benzimidazole have antibacterial properties and they show antimicrobial activities against Gram-positive and Gram-negative bacteria. This is primarily because due to the potential bioactivity of benzimidazole- based ligands [1, 2, 3, 4, 5, 6, 7, 8, 9, 10, 11]. Because of this reason, the incorporation of the imidazole and benzimidazole nuclei is an important synthetic strategy in drug discovery. It has also been observed that benzimidazole has received much attention in the last two decades among those who are working in the field of drug discovery and synthesis. Since the position and type of the substituents on the benzimidazole ring play a responsible role in biological activities, they tried to change the substitution at different places to get new compounds. Therefore, various new benzimidazoles have been synthesized and investigated for therapeutic purposes.
To obtain better active molecule chemist synthesize derivatives by fusing another heterocyclic ring in benzimidazoles. Such yielded compounds have been found their diverse application as antioxidant [12, 13], antifungal [14], antitubercular [15], anticancer [16, 17], and antiallergic drugs [18]. In addition to the above some of the benzimidazoles have been found effective inhibitors of the growth of HIV-virus [19, 20].
In this study, an attempt has been made to develop the most significant QSAR model for the benzimidazole derivatives as synthesized and reported by Seydal [21].
Antibacterial Activity of Compounds
The compounds synthesized by Seydal [21] have been tested for their biological activities. They were evaluated for their in vitro growth inhibitory activity against the bacteria Pseudomonas aeruginosa (АТCC 27853).
Antibacterial activities were tested by the disc-diffusion method under standard conditions using Mueller-Hinton agar medium as described by NCCLS [22].
In addition, the minimum inhibitory concentration (MIC) experiment was carried out by the agar dilution method as per NCCLS standard M7-A5 [23].
The MIC of tested benzimidazoles was defined as the lowest concentration of the compound at which no growth of the strain has been observed in a period and under specified experimental conditions. To classify the antibacterial activity, they compared the activity with the antibacterial agents being used in therapeutic treatment. The MICs in the study were compared with Ampicillin and Gentamicin which were screened under similar conditions as reference drugs.
Agrawal, et al. [24, 25, 26, 27, 28] have used topological indices to correlate biological activities of man derivatives of sulfa compounds. QSAR studies have been published and widely cited by different workers in carrying out new synthesis.
Results and Discussion
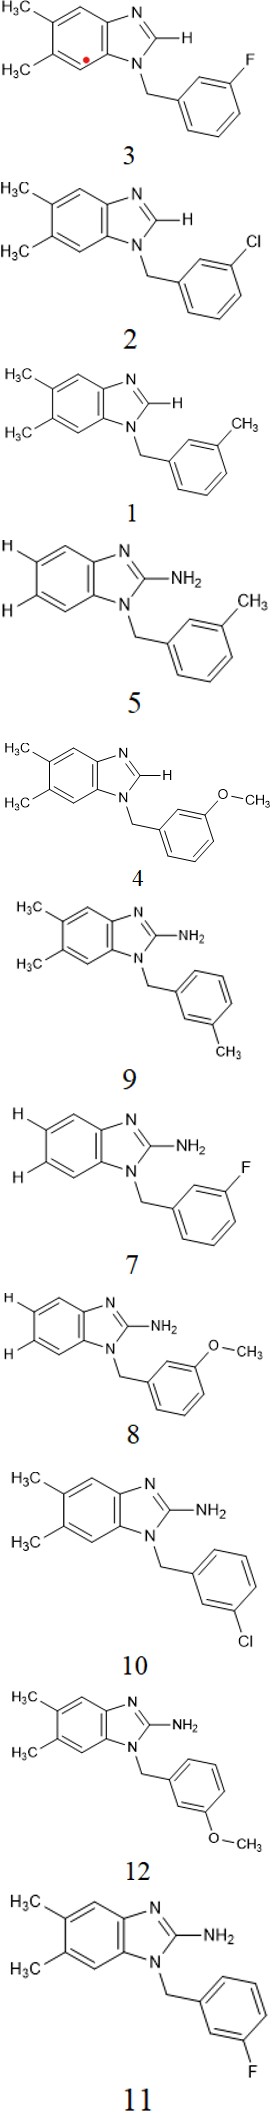
In this study 12 benzimidazole derivatives have been taken from the work of [21]. The molecules were drawn using Chemsketch software [29]. The details of these structures along with their biological activities (logMIC) have been reported in Table 1. Molecular files (Mol) were prepared, and they were used for the calculation of topological parameters using Dragon software [30]. The calculated indices are summarized in Table 1.
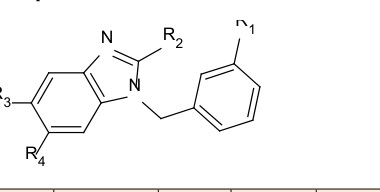
| Compd. No. | R 1 | R 2 | R 3 | R 4 | ATS2v | DBI | SNar | ATSC6p | ATSC8p | logMIC |
|---|---|---|---|---|---|---|---|---|---|---|
| 1 | CH 3 | H | CH 3 | CH 3 | 3.39 | 2.1 | 13.9 | 0.26 | 0.05 | 4.6 |
| 2 | Cl | H | CH 3 | CH 3 | 3.4 | 2.1 | 13.9 | 0.24 | 0.06 | 4.64 |
| 3 | F | H | CH 3 | CH 3 | 3.37 | 2.1 | 13.9 | 0.52 | 0.2 | 4.61 |
| 4 | OCH 3 | H | CH 3 | CH 3 | 3.41 | 2.4 | 14.6 | 0.46 | 0.24 | 4.33 |
| 5 | CH 3 | NH 2 | H | H | 3.32 | 2 | 13.5 | 0.68 | 0.32 | 4.28 |
| 6 | Cl | NH 2 | H | H | 3.32 | 2 | 13.5 | 0.7 | 0.34 | 4.31 |
| 7 | F | NH 2 | H | H | 3.29 | 2 | 13.5 | 0.9 | 0.54 | 3.98 |
| 8 | OCH 3 | NH 2 | H | H | 3.33 | 2.2 | 14.2 | 0.85 | 0.56 | 3.7 |
| 9 | CH 3 | NH 2 | CH 3 | CH 3 | 3.42 | 2.2 | 14.3 | 0.16 | 0.03 | 4.63 |
| 10 | Cl | NH 2 | CH 3 | CH 3 | 3.42 | 2.2 | 14.3 | 0.14 | 0.04 | 4.66 |
| 11 | F | NH 2 | CH 3 | CH 3 | 3.4 | 2.2 | 14.3 | 0.37 | 0.17 | 4.33 |
| 12 | OCH 3 | NH 2 | CH 3 | CH 3 | 3.43 | 2.5 | 15 | 0.32 | 0.18 | 4.35 |
Table 2: Structural details of benzimidazoles used in present study.
To obtain a correlation matrix, the NCSS software [31] was used. The resulting correlation matrix showing intercorrelation among all the descriptors with activity is demonstrated in Table 2.
| N | ||
|---|---|---|
| R |
Table 1: Correlation matrix.
| logMIC | ATS2v | DBI | SNar | ATSC6p | ATSC8p | |
|---|---|---|---|---|---|---|
| logMIC | 1 | |||||
| ATS2v | 0.66 | 1 | ||||
| DBI | 0.07 | 0.78 | 1 | |||
| SNar | 0.12 | 0.81 | 1 | 1 | ||
| ATSC6p | -0.85 | -0.92 | -0.48 | -0.52 | 1 | |
| ATSC8p | -0.94 | -0.83 | -0.3 | -0.35 | 0.97 | 1 |
Table 3: Correlation matrix.
A perusal of Table 1 reveals that the compounds can be arranged in the following increasing order activity. 8 < 7 < 5 < 6 < 4 < 11< 12 < 1 < 3 < 9 < 2 <10 No conclusion could be drawn as why this change in the activity is observed. However, some of the reasons for this may be attributed to substitution of various groups at different positions. Even one may not be able to predict the activity by adding different substituents at various places. So, the QSAR analysis was preferred.
The data was subjected to regression analysis to get the best models. A perusal of correlation matrix suggests that the ATSC8p has the highest correlation with log MIC the next parameter which shows correlation value -0.8467 is ATSC6p and the third one is ATS2v which has a value of 0.6581. Other two parameters show poor correlation with activity.
Similarly, some parameters are highly correlated and some show moderate correlation. They are discussed as below:
- ATSC6p is highly correlated with ATS2v
- ATSC8p is highly correlated with ATSC6p
- SNar is highly correlated with DBI but moderately correlated with ATS2v
- ATSC8v is moderately correlated with ATS3v It is well accepted fact that no two highly correlated parameters be used in multi-parametric correlation. Hence, they are generally not taken together. But according to Randic [32] different topological parameters contain different information hence their simultaneous use should not be restricted. Therefore, recommendation of Randic is being followed in obtaining best statistically significant models. However, the defect due to collinearity can be tested by Ridge analysis and obtaining VIF plots.
According to rule of Thumb [33] for 12 compounds one can go up to 4-parametric models. Therefore, in this analysis the best model will be restricted to that limit.
The systematic regression analysis [34] was carried out. The quality of statistical parameters is summarized in Table 3.
| Model No. | Parameters | A (i=1,2,3) i | C | Se | AdjR2 | R2 | F-Ratio | Q= R/Se |
|---|---|---|---|---|---|---|---|---|
| 1 | ATSC8p | -1.5018(± 0.1758) | 4.71 | 0.11 | 0.87 | 0.88 | 72.96 | 8.81 |
| 2 | ATSC6p | -0.9393 (±0.1866) | 4.81 | 0.16 | 0.69 | 0.72 | 25.33 | 5.19 |
| 3 | ATS2v | 4.0476(± 1.4643) | -9.29 | 0.23 | 0.38 | 0.43 | 7.64 | 2.85 |
| 4 | ATSC6p | 1.2113(± 0.3475) | 4.53 | 0.07 | 0.94 | 0.95 | 83.25 | 13.3 |
| ATSC8p | -3.1990 (±0.5016) | |||||||
| 5 | DBI | -0.4826 (±0.1933) | 5.79 | 0.09 | 0.91 | 0.93 | 58.69 | 11.16 |
| ATSC8p | -1.6145(± 0.1494) | |||||||
| 6 | SNar | -0.1466 (±0.0601) | 6.81 | 0.09 | 0.91 | 0.93 | 57.47 | 11.05 |
| ATSC8p | -1.6334 (±0.1536) | |||||||
| 7 | ATS2v | -2.3621(± 1.0022) | 12.80 | 0.09 | 0.91 | 0.93 | 55.88 | 10.9 |
| ATSC8p | -2.0121 (±0.2610) | |||||||
| 8 | ATS2v | 9.3556(± 0.9108) | -22.20 | 0.09 | 0.9 | 0.92 | 53.05 | 10.61 |
| DBI | -2.3006(± 0.3068) | |||||||
| 9 | ATS2v | 9.8287(± 1.0594) | -18.50 | 0.1 | 0.89 | 0.91 | 43.78 | 9.64 |
| SNar | -0.7304 (±0.1080) | |||||||
| 10 | DBI | -0.8946 (±0.2932) | 6.86 | 0.12 | 0.83 | 0.86 | 27.84 | 7.69 |
| ATSC6p | -1.1683 (±0.1570) | |||||||
| 11 | SNar | -0.2750 (±0.0928) | 8.80 | 0.12 | 0.82 | 0.86 | 26.89 | 7.56 |
| ATSC6p | -1.1938 (±0.1643) |
Table 4: Quality of statistical parameters for different models.
Here, best models obtained using one-, two-parametric models are reported.
One-Parametric Model
The best one-parametric model is obtained with ATSC8p as correlating parameter. The R2 value for this model comes out to be 0.8795. The model is as below- log MIC=4.7107-1.5018(± 0.1758) ATSC8p N=12, SE=0.1065, R2=0.8795, AdjR2=0.8674, F-ratio=72.96, Q-value=8.805(1) Here and here after, N refers to the number of data points used in the correlation, R2 is the square of the correlation coefficient, SE is standard error of estimation, Adj R2 is adjusted R2 which takes care of added parameters, F is Fischer ratio and Q is Pogliani constant [36] which is R/SE.
Two-Parametric Model
When SNar is added to one-parametric model the value of R2 changes from 0.8795 to 0.9274. The value of Adj R2 changes from 0.8674 to 0.9112 which clearly indicates that addition of SNar to the one-parametric model is justified. The Q value also shows a high increment in this model. The model is given below:
log MIC= 6.8077 -1.6334 (±0.1536) ATSC8p-0.1466 (±0.0601) SNar N=12, SE= 0.08717, R2 =0.9274, AdjR2 =0.9112, F-ratio= 57.465, Q-value= 11.047 (2) To check whether a better R2 may be obtained with other two-parametric combination, DBI is added to one- parametric model discussed above. This resulted into a better model in which the value of R2 has been found to be 0.9288 which is better than what was obtained when SNar was added. This means that the model obtained is better than the two-parametric model in which ATSC8p and SNar were taken as correlating parameters. This is further confirmed when Adj R2 values are compared. This value for the latter two-parametric model comes out to be 0.913 slightly better that previous two-parametric model Eq. (2). The Q value also show slight improvement. The model is given as below- log MIC= 5.786-1.6145(± 0.1494) ATSC8p-0.4826 (±0.1933) DBI N=12, SE= 0.08632, R2= 0.9288, AdjR2= 0.913, F-ratio= 58.69, Q-value= 11.164 (3) Finally, the most favourable and significant two- parametric model is obtained when ATSC8p and ATSC6p are taken together. The R2 value in this comes out to be 0.9487 which is highest among all the previous models discussed above. The Adj R2 also is highest (0.9373) which suggests that this is the best two-parametric model. The Q value also changes from 0.11.164 to 13.297 suggesting that the two-parametric model given below is the best model for modelling the logMIC of present set of compounds. The model is reported below: log MIC= 4.5328-3.1990 (±0.5016) ATSC8p+1.2113(± 0.3475) ATSC6p N=12, SE= 0.07325, R2= 0.9487, AdjR2= 0.9373, F-ratio= 83.246, Q-value= 13.297 (4) The three-parametric models were also tried but the improvement in regression parameters have very insignificant. Hence, they are not considered/ reported here.
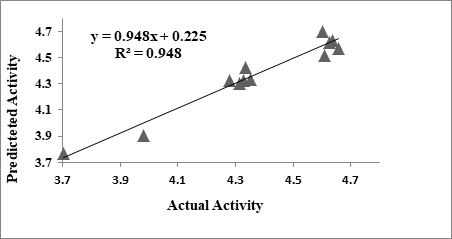
Further confirmation of the model was obtained by estimating the logMIC values using best model (Eq.4). The observed and estimated values are reported in Table 4. They are in good agreement with each other confirming that the model represented in Eq.4 is the best among all the obtained models. A graph has been plotted against observed and estimated activity values to obtain the predictive power of the model. Such graph is demonstrated in Figure 1. The predictive power of the model comes out to be 0.948. This means that approximately 94% of the data can be explained by this model Figures 2 & 3.
| Model N0 | Descriptors used | N | PRESS | SSY | PRESS/ | R2 CV | PSE | S PRESS |
|---|---|---|---|---|---|---|---|---|
| SSY | ||||||||
| 1 | ATSC8p | 12 | 0.11 | 0.83 | 0.14 | 0.86 | 0.1 | 0.11 |
| 2 | ATS2v, | 12 | 0.07 | 0.87 | 0.08 | 0.92 | 0.08 | 0.09 |
| ATSC8p | ||||||||
| 3 | Snar, | 12 | 0.07 | 0.87 | 0.08 | 0.92 | 0.08 | 0.09 |
| ATSC8p | ||||||||
| 4 | DBI, | 12 | 0.07 | 0.87 | 0.08 | 0.92 | 0.07 | 0.09 |
| ATSC8p | ||||||||
| 5 | ATSC6p, | 12 | 0.05 | 0.89 | 0.05 | 0.95 | 0.06 | 0.07 |
| ATSC8p | ||||||||
Table 5: Cross validated parameter for the proposed models.
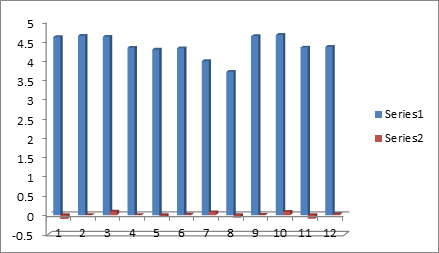
| Compd. No. | Observed Log MIC | Estimated | Residual |
|---|---|---|---|
| Log MIC | |||
| 1 | 4.6 | 4.7 | -0.1 |
| 2 | 4.64 | 4.63 | 0.01 |
| 3 | 4.61 | 4.52 | 0.09 |
| 4 | 4.33 | 4.32 | 0.01 |
| 5 | 4.28 | 4.33 | -0.05 |
| 6 | 4.31 | 4.3 | 0.01 |
| 7 | 3.98 | 3.9 | 0.08 |
| 8 | 3.7 | 3.77 | -0.07 |
| 9 | 4.63 | 4.62 | 0.01 |
| 10 | 4.66 | 4.57 | 0.09 |
| 11 | 4.33 | 4.43 | -0.09 |
| 12 | 4.35 | 4.33 | 0.02 |
Table 6: Observed and Estimated log MIC values for the present set of compounds.
Calculation of cross validated parameters [36] are also important method for deciding whether the proposed model is best or not. Therefore, the calculation of cross validated parameters for the proposed models were calculated. They are reported in Table 5. The highest R2 CV value obtained relates to two-parametric model represented by Eq. 4 above.
The ratio PRESS/SSY can be used to get suitable confidence intervals for prediction of new compounds. When the ratio of PRESS/SSY is less than 0.4 (PRESS/SSY < 0.4), then the QSAR model is significant and reasonable. When the value of PRESS/SSY is less than 0.1 (PRESS/SSY <0.1), that indicates that the model is excellent. The other cross validated parameters, as per the above values, are also in favour of this model.
To check whether the model obtained suffers due to collinearity or not, Ridge analysis has been performed. The plot obtained is demonstrated in the form of Figures 4 & 5.
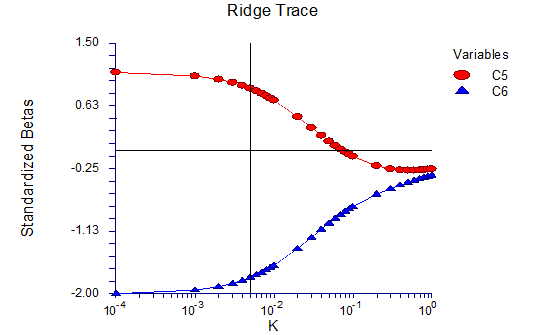
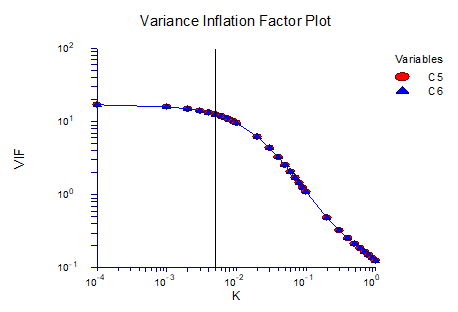
Table 6 is related to Ridge analysis, based on which we discuss the defect of co-linearity in models. The parameters reported in table 6 are Variance Inflation Factor (VIF), Tolerance (T), Eigen values (λᵢ), and Condition Number (k). These values are reported for all the independent parameters used in the proposed model. The model with a parameter whose VIF value is greater than 10 will show co-linearity (Fig.5). But in our proposed models the VIF value is always less than 10, which means that all the proposed models are free from the defect of co-linearity.
- Model No.
- Parameters Used
- VIF λᵢ
- K
- 4
- ATSC6p
- 17.217
- 1.9705
- 1
- ATSC8p
- 17.217
- 0.0295
- 66.85
Table 7: Ridge Regression parameters for the best obtained
The Tolerance value T equal to 1 or less than 1 indicates that the model is free from co-linearity. The values for T in Table 6, are less than 1. Therefore, from this point of view also proposed models are free from the defect of co-linearity.
Another test for collinearity is λᵢ. The parameter of the model whose λᵢ value is greater than 5 will suffer from co- linearity. Since, every value of λᵢ is less than 5, which means all the proposed models are free from co-linearity defects. Also, if the value of condition number k is greater than 100, then the collinearity exists but in our case from this point of view, the proposed models are well acceptable.
Therefore, based on the above discussion, it is clear that all the parameters shown in table 6 are free from collinearity or more precisely multi co-linearity.
Conclusions
- Topological parameters are useful in modelling the antibacterial activity of benzimidazole derivatives considered in this study.
- Two-parametric model using ATSC8p and ATSC6p as correlating parameters gave excellent results thus accepted as best QSAR model.
- The parameter ATSC8p has a negative coefficient indicating that the higher value of this parameter will reduce the pMIC value. Thus, it has a retarding role towards the biological activity.
- The parameter ATSC6p has a positive coefficient which shows that it has a positive role towards the activity.
- The best two-parametric model is free from collinearity defect.
- This model can be used in further modification of molecular structure to get more potent compounds.
References
-
Kazimierczuk Z, Upcroft AJ, Upcroft P, Górska A, Starościak B, et al. (2002) Synthesis, antiprotozoal and antibacterial activity of nitro- and halogeno-substituted benzimidazole derivatives. Acta Biochimica Polonica 49(1): 185-195.
-
Göker H, Kuş C, Boykin DW, Yildiz S, Altanlar N (2002) Synthesis of some new 2-substituted-phenyl-1H- benzimidazole-5-carbonitriles and their potent activity against Candida species. Bioorg med chem 10(8): 2589- 2596.
-
Ozden D, Atabey D, Yildiz H, Goker (2005) Bioorg Med Chem 13: 1587-1597.
-
Podunavac-Kuzmanović SO, Cvetković DD, Jevrić LR, Uzelac NJ (2013) Quantitative structure-activity relationship (QSAR) study of a series of benzimidazole derivatives as inhibitors of Saccharomyces cerevisiae. Acta chimica Slovenica 60(1): 26-33.
-
Kovačević SZ, Podunavac-Kuzmanović SO, Jevrić LR, Vukić VR, Savić MP, et al. (2016) Preselection of A- and B- modified d-homo lactone and d-seco androstane derivatives as potent compounds with antiproliferative activity against breast and prostate cancer cells - QSAR approach and molecular docking analysis. Eur J Pharma science 10(93): 107-113.
-
Podunavac-Kuzmanović SO, Leovac VM, Perišić-Janjić NU, Rogan J, Balaž J (1999) Complexes cobalt(II), zinc(II) and copper(II) with some newly synthesized benzimidazole derivatives and their antibacterial activity. Journal of the Serb Chem Society 64(5-6): 381-388.
-
Podunavac-Kuzmanović SO, Cvetković DD, Barna DJ (2008) The effect of lipophilicity on the antibacterial activity of some 1-benzylbenzimidazole derivatives. J Serb Chem Soc 73(10): 967-978.
-
Podunavac-Kuzmanović SO, Leovac VM, Cvetković DD (2008) Antibacterial activity of cobalt (II) complexes with some benzimidazole derivatives. J Serb Chem Soc 73(12): 1153-1160.
-
Podunavac-Kuzmanović SO, Cvetković DD, Barna DJ (2009) Lipophilicity And Antifungal Activity Of Some 2-Substituted Benzimidazole Derivatives. Chem Ind Chem Eng Q 17(1): 19-15.
-
Podunavac-Kuzmanović SO, Cvetković DD (2007) Chem Ind Chem Eng Q 13: 68-71.
-
Küçükbay H, Durmaz R, Orhan E, Günal S (2003) Synthesis, antibacterial and antifungal activities of electron-rich olefins derived benzimidazole compounds. Farmaco 58(6): 431-437.
-
Kuş C, Ayhan-Kilcigil G, Eke BC, Işcan M (2004) Synthesis and antioxidant properties of some novel benzimidazole derivatives on lipid peroxidation in the rat liver. Archives of pharmacol research 27(2): 156-163.
-
Ayhan-Kilcigil G, Kus C, Coban T, Can-Eke B, Iscan M (2004) Synthesis and antioxidant properties of novel benzimidazole derivatives. Journal of enzyme inhib med chem 19(2): 129-135.
-
Ayhan-Kilcigil G, Altanlar N (2006) Synthesis and Antifungal Properties of Some Benzimidazole Derivatives. Turk J Chem 30(2): 223-228.
-
Abd Elhafez OM, El Khrisy MADEE, Badria F, Fathy MDAl (2006) Synthesis and biological investigations of new thiazolidinone and oxadiazoline coumarin derivatives. Arch Pharm Res 26(9): 686-696.
-
El-Hawash SA, Badawey el SA, Kappe T (1999) Benzimidazole condensed ring systems. XII. Synthesis and anticancer evaluation of certain pyrido [1,2-a] benzimidazole derivatives. Pharmazie 54(5): 341-346.
-
Soderlind KJ, Gorodetsky B, Singh AK, Bachur NR, Miller GG, et al. (1999) Bis-benzimidazole anticancer agents: targeting human tumour helicases. Anti-cancer drug design 14 (1): 19-36.
-
Nakano H, Inoue T, Kawasaki N, Miyataka H, Matsumoto H, et al. (2000) Synthesis and biological activities of novel antiallergic agents with 5-lipoxygenase inhibiting action. Bioorg med chem 8(2): 373-380.
-
Demirayak S, Mohsen UB, Karaburun AC (2002) Synthesis and anticancer and anti-HIV testing of some pyrazino [1,2-a] benzimidazole derivatives. Europe J Med Chem 37(3): 255-260.
-
Samia MR, El-Hawash SAM, Fahmy TYH, Hazzaa AA, El- Meligy MMM (2006) Synthesis of novel benzofuran and related benzimidazole derivatives for evaluation of in vitro anti-HIV-1, anticancer and antimicrobial activities. Archives pharmacal res. 29(10): 826-833.
-
Seydel JK (1971) Prediction of the in vitro activity of sulfonamides synthesized from simple amines by use of electronic data obtained from the simple amines. J Med Chem 14(8): 724-729.
-
National Commitee for Clinical Laboratory Standards (2000) NCCLS Approval Standard Document M2-A7, Vilanova, PA.
-
National Commitee for Clinical Laboratory Standards (2000) NCCLS Approval Standard Document M7-A5, Vilanova, PA.
-
Soni SK, Agrawal Vijay K, Khadikar PV, Srivastava AK (1999) Topological QSAR studies on antifungal benzoxazoles. Indian Journal of Chem 38(A): 745-752.
-
Agrawal VK, Bano S, Khadikar PV (2003) QSAR analysis of antibacterial activity of some 4-aminodiphenyl sulfone derivatives. Acta Microbiologica Immunol Hung 50(4): 385-393.
-
Agrawal Vijay K, Kamlesh M Padmakar VK (2003) Multivariate analysis for modeling some antibacterial agents. Oxid Commun 26: 14-21.
-
Agrawal Vijay K, Ruchi R, Padmakar VK (2002) QSAR Studies on Carbonic Anhydrase Inhibitors:A Case of Ureido and Thioureido Derivatives of Aromatic/ Heterocyclic Sulfonamides. Bioorg Med Chem 10(9): 2993-2999.
-
Singh J, Shaik B, Shalini S, Sarla S, Agrawal VK, et al. (2007) QSAR studies on the activation of the human carbonic anhydrase cytosolic isoforms I and II and secretory isozyme VI with amino acids and amines. Bioorganic & Medicinal Chemistry 15(20): 6501-6509.
-
Advanced Chemistry Development (2019) Inc. Chemsketch Toronto, Canada.
-
Talete srl, Dragon Molecular Descriptor.
-
Hintze J (2012) NCSS 8. NCSS, LLC. Kaysville, Utah, USA.
-
Milan Randić (1993) Comparative Regression Analysis. Regressions Based on a Single Descriptor. Croatica Chemica Acta, 66 (2): 289-312.
-
(1971) MS Tute, History and Objectives of Quantitative Drug Design in Advances in Drug Research. Harter NJ, Simmord AB (Eds.), Academic Press: London, 6(1).
-
Chatterjee S, Hadi AS, Price B (2000) Regression Analysis by Examples. In: (5th Edn.), Wiley VCH: 1-389.
-
Pogliani L (1994) Structure property relationships of amino acids and some dipeptides Amino Acids 6(2): 141-153.
- Pattern of Gonadal Hormones in Oral Testosterone-Supplimented Male Wistar Rats with Diabetes-Induced Hypogonadism
- Re-Evaluation of the Genotoxicity of Currently Used Food Dyes in Mouse Multiple Organs Via Continuous Administration by Drinking Using the Comet Assay
- Pharmacogenetics of Type 2 Diabetes Mellitus: Linking Genetic Variability to Drug Efficacy and its Cardiovascular Outcomes
- Exploratory Proteomic Profiling of SARS-CoV-2 Infected THP-1 Macrophages Reveals Alterations in Inflammatory Response and Cellular Metabolism
- Study of Genotoxicity of Hepatocarcinogens in Multiple Organs in Mice by Feeding and Drinking Using the Comet Assay
- Spirulina Polypeptides Inhibit the Growth of Human Lung Tumor (H460) Cells