Is Cell Death Responsible for False Positive Results of In Vivo Comet Assay?
Although the comet assay is now a popular method to assess DNA damage induced by environmental genotoxins at a single cell level, it has not been excluded the criticism that some or all of the comet images may be the results of apoptosis- and necrosismediated DNA fragmentation. In this study, therefore, we query whether necrosis in mouse stomach and liver can lead to false positive results of in vivo comet assay and whether the validity the diffusion assay detecting cells with DNA fragmentation due to apoptosis or necrosis to exclude false positive results in in vivo comet assay of. Carbon tetrachloride (CCl4), allyl alcohol (AA), and D-galactoseamine (D-Gal) that are non-genotoxic but induce necrosis in the liver and high concentration sodium chloride solution (NaCl, 250mg/mL w/v) and dimethylamine (DMA) that are non-genotoxic but induce necrosis in the stomach mucosa were given to mice. Also, diethylnitrsoamine (DEN) and ethylmethane sulfonate (EMS) that are genotoxic were given to mice at non-cytotoxic level. In the liver and stomach mucosa, not only the alkaline comet assay but also the neutral comet and diffusion assays to detect DNA fragmentation, TUNNEL assay, and histopathological observation were conducted. The stomach mucosa of mice received NaCl and DMA and the liver of mice received AA, CCl4, and D-Gal showed necrosis, the incidence of TUNNEL-positive cells, and the increases in Halo-image in the diffusion assay but not increased tail length in the alkaline comet assay. Therefore, the possibility is not considered that the generation of DNA fragments due to cell death is responsible for an increase in tail length in the alkaline comet assay but that the increase in Halo-image well agrees with cell death observed by histopathological observation and TUNNEL staining. Therefore, if a concurrently diffusion assay performed in parallel with the alkaline comet assay is positive, the possibility could not be excluded that the positive result of the comet assay is a false positive due to cell death.
Introduction
The comet assay is now a popular method to assess DNA damage induced by environmental genotoxins at a single cell level. Under alkaline condition (pH >13) [1, 2], increased DNA migration is associated with increased levels of DNA single- and double-strand breaks, incomplete excision repair sites, and alkali-labile sites. To etect genotoxic effects by the comet assay, the state of the cell from which the comet images has derived is generally expected to be viable. Nevertheless, increased DNA migration is also considered to be associated with the DNA fragmentation that is observed when cells die either through necrosis and apoptosis [3, 4]. While comet images from cells undergone apoptotic process in which DNA double-strand breaks are formed have large fan-like tails and small head [cells with this appearance are called ghost cells, clouds, hedgehogs, or NDCN (non-detectable cell nuclei)], necrotic cells form comet images have relatively large head and narrow tail of varying length [2, 5, 6]. A criticism of the assay is that some or all of the comet images may be the results of apoptosis- and necrosis-mediated DNA fragmentation. In Jurkat cells expressing the Fas antigen, it has been shown that the comet-like shape appeared immediately after the after the early stages of apoptosis induction by an anti-Fas antibody [7], and that the appearance of comet images is associated with the induction of DNA fragmentation in Fas ligand-induced apoptosis [8], supporting that criticism. It has also been reported that, and the induction of a come images in human lymphocytes is associated with the induction of apoptosis [9]. In contrast to that criticism, it has been reported that there was no correlation between comet images and apoptosis in HT-29 cells exposed to H2O2, MNNG, and an apoptosis inducer staurosporine [10]. EMS induced DNA damage being responsible for DNA strand breaks detected in the comet assay was shown to be repairable, supporting that comet images including the so-called ghost images reflect mutagen-induced DNA damage [11]. Those contradict results whether cell death leads to false-positive results in the comet assay remained serious question about the utility and validity of the comet assay as a genotoxicity assay. Because the possibility cannot be excluded that DNA fragmentation due to cell death is detected as comet image, it is critical that the highest dose tested not induce excessive cytotoxicity and that cytotoxicity be evaluated concurrently with each Comet experiment [3, 12]. Although validation studies have not been conducted to identify acceptable cytotoxicity levels for the comet assays, cell viability is below 70 to 80% of that in the control may not be considered excessive cytotoxicity [3]. An assessment of in vitro cytotoxicity has largely depended on simple dye exclusion techniques (e.g., trypan blue) [3]. We have developed an adaptation to the comet assay that enables to detect genotoxicity in multiple organs of rodents by using nuclei obtained by homogenization instead cells obtained by enzyme treatment [12]. However, the evaluation of cytotoxicity by dye exclusion techniques is not adequate for in vivo comet assay where mincing or homogenization is used to provide single cells or nuclei. In our in vivo comet assay studies, organs with positive comet assay response have been observed histopathologically to exclude the possibility of false positive due to cytotoxicity [12, 13]. In spite of that discussion, the question now remained how the incidence of cell death (apoptosis and necrosis) in organs associate with comet images. In this study, therefore, we query whether necrosis in mouse stomach and liver can lead to false positive results of the comet assay and whether the validity to exclude false positive results in in vivo comet assay of the diffusion assay detecting cells with DNA fragmentation due to apoptosis or necrosis [14].
Materials and Methods
Chemicals and Animals
In this study, three non-genotoxic chemicals [carbon tetrachloride (CCl4), allyl alcohol (AA) and D-galactoseamine (D-Gal)] that induce necrosis in the liver and two non-genotoxic chemicals [high concentration sodium chloride solution (NaCl, 250mg/mL w/v)] and dimethylamine (DMA) that induce necrosis in the mucosa of stomach were used. Also, two genotoxic compounds, ethyl methane sulfonate (EMS) and diethylnitrosoamine (DEN) were used. DMA and EMS were obtained from Tokyo Kasei Kogyo, Ltd. (Tokyo) and Sigma Chemical Co., St. Louis, MO (U.S.A.), respectively. Other chemicals were from Wako Pure Chemical Industry, Ltd. (Osaka). Regular (GP- 42) and low melting point (LGT) agarose were obtained from Nacalai Tesque (Kyoto) and diluted, respectively, to 1% and 2% in physiological saline. Male ddY mice were obtained from Japan SLC Co. (Shizuoka, Japan) at 7 weeks of age and used after 1 week of acclimatization. They were fed commercial pellets MF (Oriental Yeast Industries Co., Tokyo, Japan) and tap water ad libitum throughout the acclimatization period and the experiment. The animal room was at 20 - 24 °C with a 12-h light-dark cycle.
The Comet Assay
Four mice per group received intraperitoneally CCl4 at 2000 mg/kg or lower, D-Gal at 2000 mg/kg or lower, AA at 100 mg/kg or lower, and DEN at 160 mg/kg, were sacrificed 12 and 24 h after the administration, and the liver was removed and divided in two; one part of each was fixed in 10% formaldehyde. Another part of each used for the comet and diffusion assays was homogenized in 4mL chilled homogenizing solution (pH 7.5) containing 0.075 M
NaCl and 0.024 M Na2EDTA and homogenized gently using a Potter-Elvehjem type homogenizer at 500 - 800 rpm, in ice [12]. To obtain nuclei, the homogenate was centrifuged at 700g for 10 min at 0°C, and the precipitate was re- suspended in chilled homogenizing buffer [9]. Four mice per group received orally NaCl at 2500 mg/kg, DMA at 150 mg/kg, and EMS at 80 mg/kg were sacrificed 3 h after the administration and the stomach was removed. The stomach was opened and rinsed with physiological saline; it was divided into 3 parts (forestomach, glandula stomach, and ledge) as shown in Figure 2. Glandula stomach, and ledge were divided in two; one part of each was fixed in 10% formaldehyde. Another part of each was used for the comet and diffusion assays; the upper and lower layers of mucosa of glandula stomach were scraped separately into 4 mL chilled homogenizing solution (pH 7.5) containing 0.075 M NaCl and 0.024 M Na2EDTA and homogenized gently using a Potter-Elvehjem type homogenizer at 500 - 800 rpm, in ice. To obtain nuclei, the homogenate was centrifuged at 700_g_ for 10 min at 0°C, and the precipitate was re-suspended in chilled homogenizing buffer [12]. Seventy-five µL agarose GP-42 was quickly layered on a slide (Matsunami Glass Ind., Ltd., Osaka, Japan) coated with agarose GP-42 and covered with another slide. The slide sandwiches were placed horizontally to allow the agarose to solidify. The nucleus suspension was mixed 1:1 (v/v) with 2%, 45oC, agarose-LGT, and 75 µL of the nucleus mixture was quickly layered in the same manner after removal of the covering slide. Finally, 75 µl of agarose GP-42 was quickly layered on again. Three slides were prepared from nuclei isolated by homogenization of each sample and were placed in a chilled lysing solution (2.5 M NaCl, 100 mM Na2EDTA, 10 mM Trizma, 1% sarkosyl, 10% DMSO, and 1% Triton X-100, pH 10) [9] and kept at 0oC in the dark for about one night.
Three slides were prepared from each sample, one for the neutral comet assay, one for the alkaline comet assay, and one for the diffusion assay. After the lysing, one slide was used for neutral comet assay. The slide was placed in 300 mM sodium acetate and 100 mM Tris (pH 10) at 0oC in the dark and for 20 min followed by the electrophoresis at pH 10 for 15 min at 0oC in the dark at 12 V (0.48 V/cm).
After the electropholysis, the slide was treated with chilled alkaline solution (300 mM NaOH and 1 mM Na2EDTA, pH>13) for 5 min.
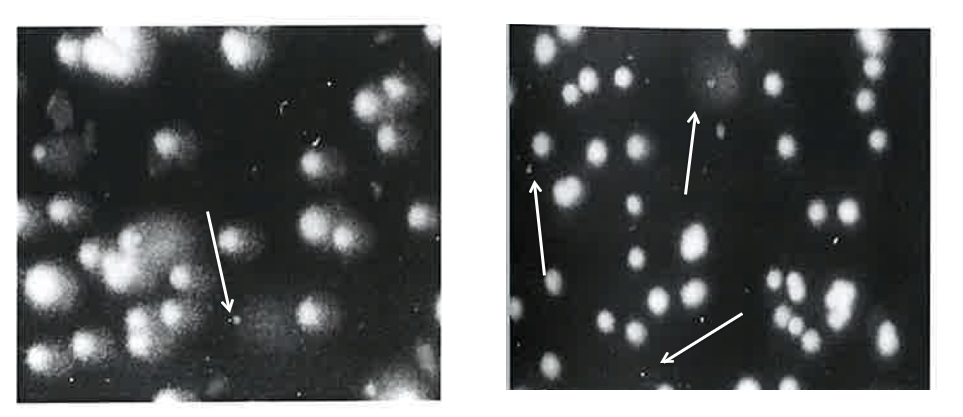
The remained two slides were used for alkaline comet and diffusion assays. After the lysing, two slides were placed in chilled alkaline solution (300 mM NaOH and 1 mM Na2EDTA, pH>13) in the dark and for 10 min. For the alkaline comet assay, one slide was undertaken the electrophoresis at 12 V (0.48 V/cm, pH>13) in the dark and for 15 min. For the diffusion assay, the slide was not undertaken the electrophoresis. And then, the slides for three assays were neutralized by 400 mM Tris buffer followed by the staining by 50 µL of 20 µg/mL ethidium bromide. In the diffusion and alkaline comet assays, the frequencies of nuclei with diffused DNA (Halo image, Figure 1) and Ghost images (Figure 1) among 1000 nuclei were scored, respectively, using a fluorescence microscopy at 200 x magnification. In the neutral and alkaline comet assays, the length of the whole comet (“length”) and the diameter of the head (“diameter”) were measured for 50 comet images. The differences between the averages of four treated animals and the untreated control animals were compared with the Dunnett test after one-way ANOVA. A p-value less than 0.05 was considered statistically significant (Figure 2).
![Figure 2: Glandula stomach, and ledge were divided in two; one part of each was fixed in 10% formaldehyde. Another part of each was used for the comet and diffusion assays; the upper and lower layers of mucosa of glandula stomach were scraped separately into 4 mL chilled homogenizing solution (pH 7.5) containing 0.075 M NaCl and 0.024 M Na2EDTA and homogenized gently using a Potter-Elvehjem type homogenizer at 500 - 800 rpm, in ice. To obtain nuclei, the homogenate was centrifuged at 700_g_ for 10 min at 0°C, and the precipitate was re-suspended in chilled homogenizing buffer [12]. Seventy-five µL agarose GP-42 was quickly layered on a slide (Matsunami Glass Ind., Ltd., Osaka, Japan) coated with agarose GP-42 and covered with another slide. The slide sandwiches were placed horizontally to allow the agarose to solidify. The nucleus suspension was mixed 1:1 (v/v) with 2%, 45oC, agarose-LGT, and 75 µL of the nucleus mixture was quickly layered in the same manner after removal of the covering slide. Finally, 75 µl of agarose GP-42 was quickly layered on again. Three slides were prepared from nuclei isolated by homogenization of each sample and were placed in a chilled lysing solution (2.5 M NaCl, 100 mM Na2EDTA, 10 mM Trizma, 1% sarkosyl, 10% DMSO, and 1% Triton X-100, pH 10) [9] and kept at 0oC in the dark for about one night.](/fulltextimages/14222/fig_2.png)
Figure 2: Sampling sites of stomach mucosa. The upper layer was obtained by scraping the surface of the glandular gastric mucosa and the lower layer was obtained by scraping the remained glandular gastric mucosa after scrapping the upper layer. The ridge was obtained by scraping the mucosa of bump protrusion forming the boundary between the forestomach and the glandular stomach.
Histopathological Examination
Fixed portion of glandular stomach, ledge, and liver were dehydrated and embedded in paraffin. Tissue sections stained by the hematoxylin-eosin and TUNEL methods were observed histopathologically. In the TUNEL method, tissue sections were incubated with 20 mg/mL proteinase K (Sigma Chemical Co., St. Louis, MO) for 20 min at 37 oC after deparaffinization and hydration. Slides were immersed in Terminal Transferase (TdT, Gibco, BRL, MD) buffer (10U TdT in 100mM HEPES buffer pH7.2, 8mM MgCl2, 0.05mM dTTP, and 0.5mM biotinylated dUTP) at 37°C for 90 min. The reaction was terminated with a TB buffer for 30 min, and the sections were covered with 10% rabbit serum for 10 min and avidin-biotin-peroxidase complex for 30 min at room temperature. Finally, the slides were incubated with 0.02% 3,3’-diaminobenzidine tetrahydrochloride (Dojindo Laboratories, Kumamoto, Japan) in 0.05M Tris- HCl buffered solution (pH7.6) containing 0.005% hydrogen peroxide for 1-5 min at room temperature. Tissue sections were counterstained with hematoxylin, dehydrated and coverslipped. The frequency of TUNNEL stained (TUNNEL- positive) cells per microscope field (0.02 mm2) was scored, using a microscopy at 400x magnification. The differences between treated and the untreated control mice were compared with the Dunnett test after one-way ANOVA. A p-value less than 0.05 was considered statistically significant.
Results
Histopathological findings in the stomach mucosa and liver were shown in Tables 1 & 2, respectively. The results of diffusion, comet, and TUNNEL assays in the stomach mucosa and liver were shown in Figures 3 & 4, respectively.
| Dose (mg/kg) | Findings | Animal No. | ||||||
|---|---|---|---|---|---|---|---|---|
| 1 | 2 | 3 | 4 | |||||
| Control/3 h | 0 | Ulcer- I | ||||||
| Necrosis and/or inflammation of mucosal | Upper layer | — | — | — | — | |||
| Necrosis and/or inflammation of mucosal | lower layer | — | — | — | — | |||
| Necrosis and/or inflammation of mucosal | Ridge | — | — | — | — | |||
| Hyperfunction of mucus secretion | — | — | — | — | ||||
| NaCl/3 h | 2500 | Ulcer- I | + | — | + | + | ||
| Necrosis and/or inflammation of mucosal | Upper layer | ++ | +++ | +++ | — | |||
| Necrosis and/or inflammation of mucosal | lower layer | + | ++ | ++ | — | |||
| Necrosis and/or inflammation of mucosal | Ridge | +++ | +++ | +++ | — | |||
| Hyperfunction of mucus secretion | — | — | — | — | ||||
| DMA/3 h | 150 | Ulcer- I | + | + | — | — | ||
| Necrosis and/or inflammation of mucosal | Upper layer | +++ | +++ | + | + | |||
| Necrosis and/or inflammation of mucosal | lower layer | — | + | + | — | |||
| Necrosis and/or inflammation of mucosal | Ridge | + | + | + | + | |||
| Hyperfunction of mucus secretion | — | ± | — | — | ||||
| EMS/3 h | 250 | Ulcer- I | — | — | — | — | ||
| Necrosis and/or inflammation of mucosal | Upper layer | — | — | — | — | |||
| Necrosis and/or inflammation of mucosal | lower layer | — | — | — | — | |||
| Necrosis and/or inflammation of mucosal | Ridge | — | — | — | — | |||
| Hyperfunction of mucus secretion | — | — | — | — | ||||
| — : no changes + : very slight change, + : slight + : middle + : severe, *chemical / sampling time | ||||||||
Table 1: Histopathological findings in mouse stomach mucosa.
| Group* | Dose (mg/kg) | Findings | Animal No. | |||
|---|---|---|---|---|---|---|
| 1 | 2 | 3 | 4 | |||
| Control | 0 | ballooning degeneration of hepatocyte (centrilobular and midlobular hepatocyte | - | - | - | - |
| necrosis of hepatocyte (pervasiveness) | - | - | - | - | ||
| necrosis of hepatocyte (perilobular) | - | - | - | - | ||
| CCl4/24 h | 500 | ballooning degeneration of hepatocyte (centrilobular and midlobular hepatocyte | + | + | + | + |
| necrosis of hepatocyte (pervasiveness) | + | + | + | + | ||
| necrosis of hepatocyte (perilobular) | + | + | + | + | ||
| CCl4/24 h | 1000 | ballooning degeneration of hepatocyte (centrilobular and midlobular hepatocyte | ++ | ++ | ++ | ++ |
| necrosis of hepatocyte (pervasiveness) | ++ | ++ | ++ | ++ | ||
| necrosis of hepatocyte (perilobular) | ++ | ++ | ++ | ++ | ||
| CCl4/24 h | 2000 | ballooning degeneration of hepatocyte (centrilobular and midlobular hepatocyte | +++ | +++ | ++ | ++ |
| necrosis of hepatocyte (pervasiveness) | +++ | +++ | ++ | ++ | ||
| necrosis of hepatocyte (perilobular) | +++ | +++ | ++ | ++ | ||
| D-Gal/12 h | 500 | ballooning degeneration of hepatocyte (centrilobular and midlobular hepatocyte | + | + | + | + |
necrosis of hepatocyte (pervasiveness) + + + + necrosis of hepatocyte (perilobular) + + + + D-Gal/12 h 1000 ballooning degeneration of hepatocyte (centrilobular and midlobular hepatocyte + + + + necrosis of hepatocyte (pervasiveness) + + + + necrosis of hepatocyte (perilobular) + + + + D-Gal/12 h 2000 ballooning degeneration of hepatocyte (centrilobular and midlobular hepatocyte ++ ++ ++ ++
| midlobular hepatocyte | ||||||
| necrosis of hepatocyte (pervasiveness) | ++ | ++ | ++ | ++ | ||
| necrosis of hepatocyte (perilobular) | ++ | ++ | ++ | ++ | ||
| AA/12 h | 25 | ballooning degeneration of hepatocyte (centrilobular and midlobular hepatocyte | + | + | + | ++ |
| necrosis of hepatocyte (pervasiveness) | + | + | + | ++ | ||
| necrosis of hepatocyte (perilobular) | + | + | + | ++ | ||
| AA/12 h | 50 | ballooning degeneration of hepatocyte (centrilobular and midlobular hepatocyte | ++ | ++ | ++ | + |
| necrosis of hepatocyte (pervasiveness) | ++ | ++ | ++ | + | ||
| necrosis of hepatocyte (perilobular) | ++ | ++ | ++ | + | ||
| AA/12 h | 100 | ballooning degeneration of hepatocyte (centrilobular and midlobular hepatocyte | ± | ± | ± | ± |
| necrosis of hepatocyte (pervasiveness) | ± | ± | ± | ± | ||
| necrosis of hepatocyte (perilobular) | ± | ± | ± | ± | ||
| AA/24 h | 25 | ballooning degeneration of hepatocyte (centrilobular and midlobular hepatocyte | + | + | + | ++ |
| necrosis of hepatocyte (pervasiveness) | + | + | + | ++ | ||
| necrosis of hepatocyte (perilobular) | + | + | + | ++ | ||
| TUNEL positive cells / microscope field | 7.0 | 2.2 | 3.6 | 8.0 | ||
| AA/24 h | 50 | ballooning degeneration of hepatocyte (centrilobular and midlobular hepatocyte | ++ | ++ | ++ | ++ |
| necrosis of hepatocyte (pervasiveness) | ++ | ++ | ++ | ++ | ||
| necrosis of hepatocyte (perilobular) | ++ | ++ | ++ | ++ | ||
| AA/24 h | 100 | Death | Death | Death | Death | |
| DEN/24 h | 40 | ballooning degeneration of hepatocyte (centrilobular and midlobular hepatocyte | — | — | — | — |
| necrosis of hepatocyte (pervasiveness) | — | — | — | — | ||
| necrosis of hepatocyte (perilobular) | — | — | — | — | ||
| DEN/24 h | 80 | ballooning degeneration of hepatocyte (centrilobular and midlobular hepatocyte | — | — | — | — |
| necrosis of hepatocyte (pervasiveness) | — | — | — | — | ||
| necrosis of hepatocyte (perilobular) | — | — | — | — | ||
| DEN/24 h | 160 | ballooning degeneration of hepatocyte (centrilobular and midlobular hepatocyte | — | — | — | — |
| necrosis of hepatocyte (pervasiveness) | — | — | — | — | ||
| necrosis of hepatocyte (perilobular) | — | — | — | — | ||
| — : no changes, ±: very slight change, +: slight +: middle +: severe, *chemical / sampling time | ||||||
|---|---|---|---|---|---|---|
Table 3: Histopathological Findings in Mouse Liver.
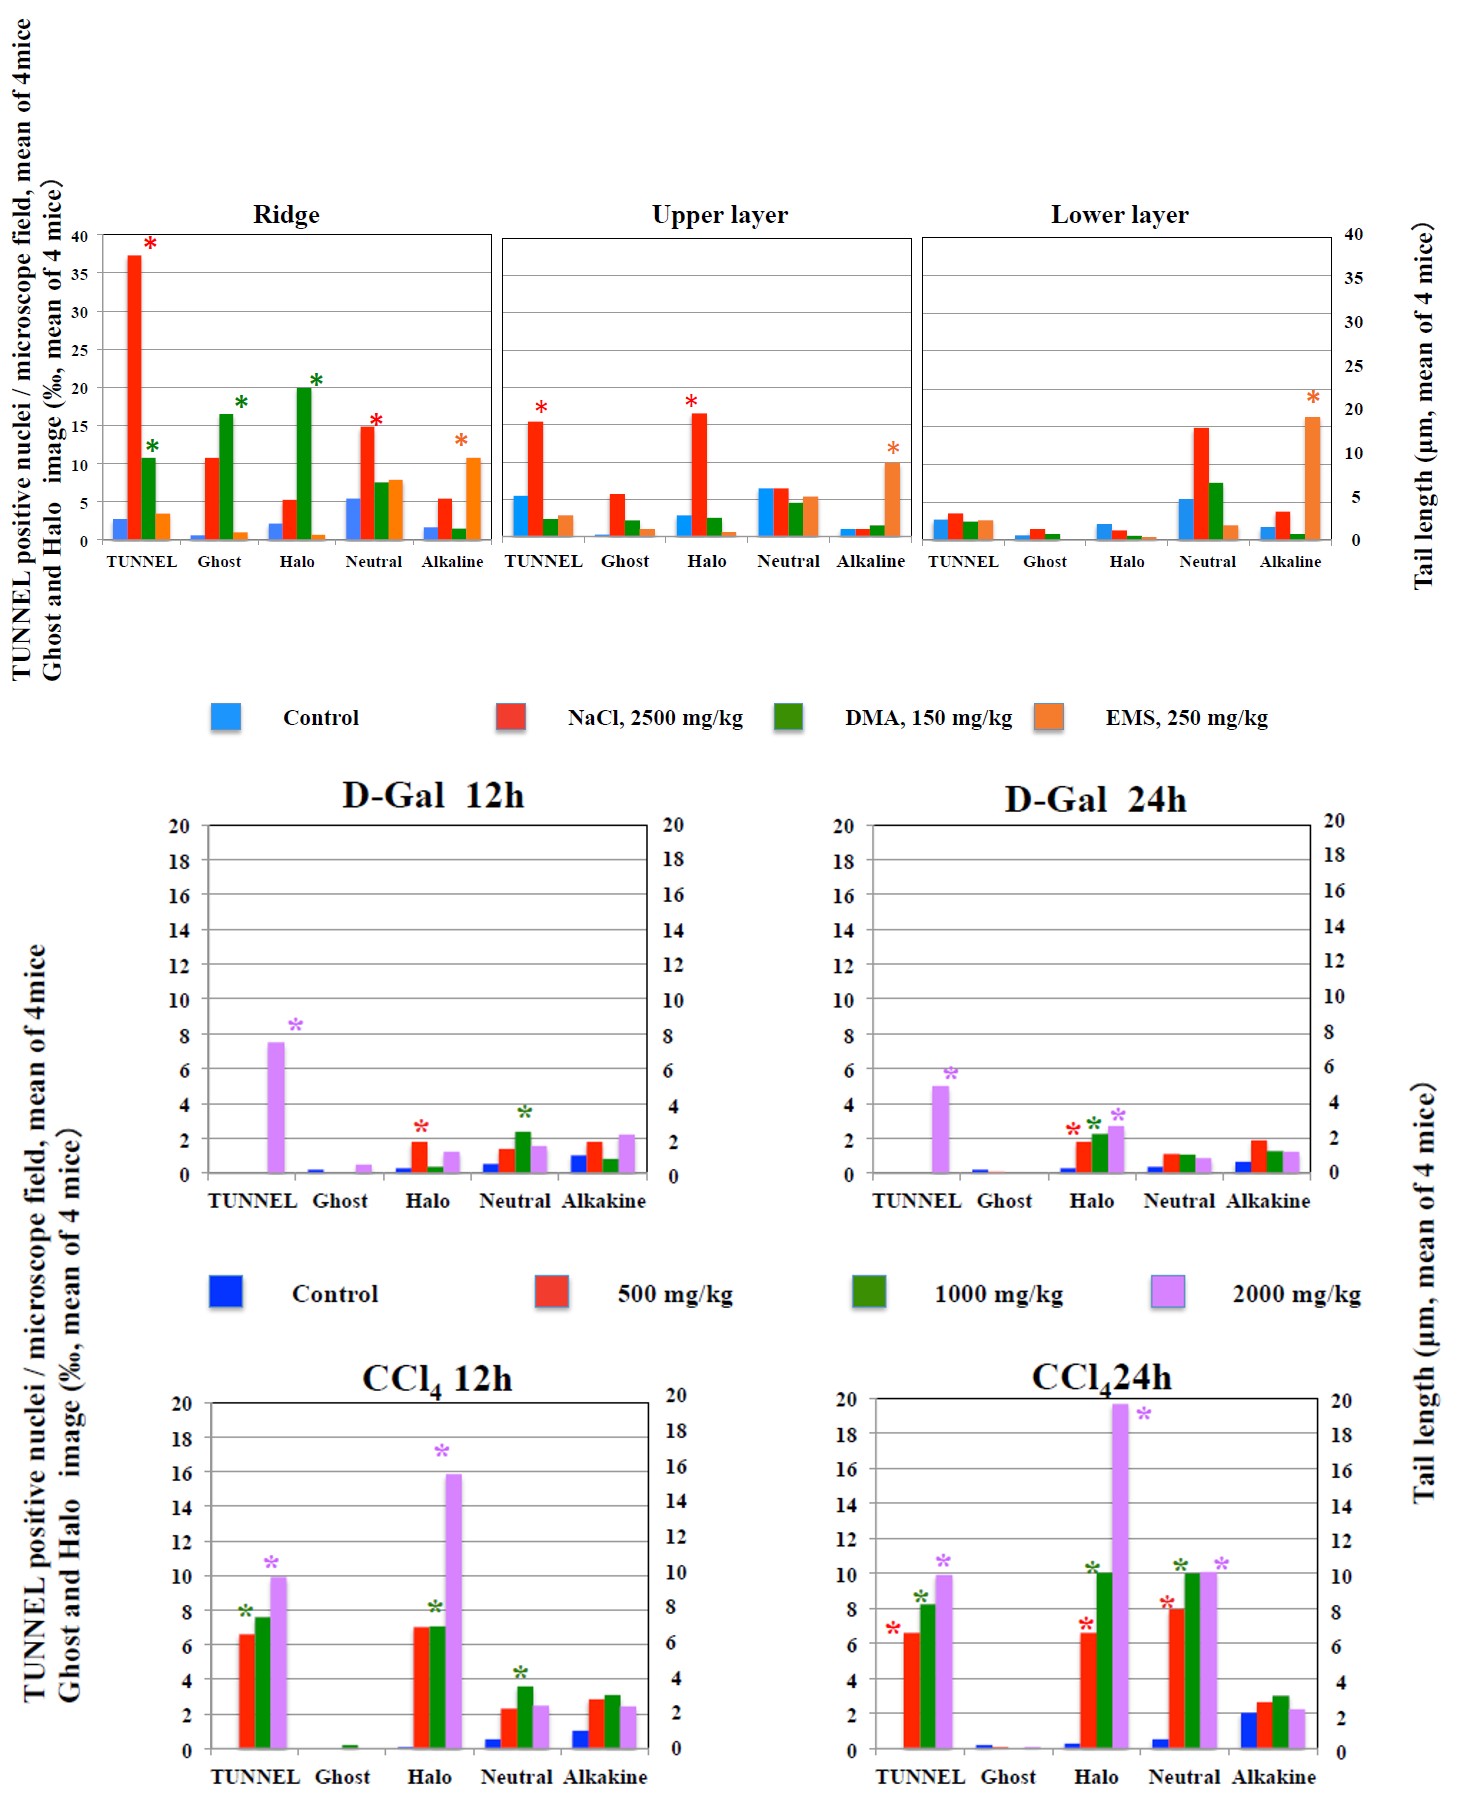
*Significantly higher than control: p<0.05. Figure 3: Results of TUNNEL assay, diffusion assay, and neutral comet assay, and alkaline comet assay in the stomach mucosa.
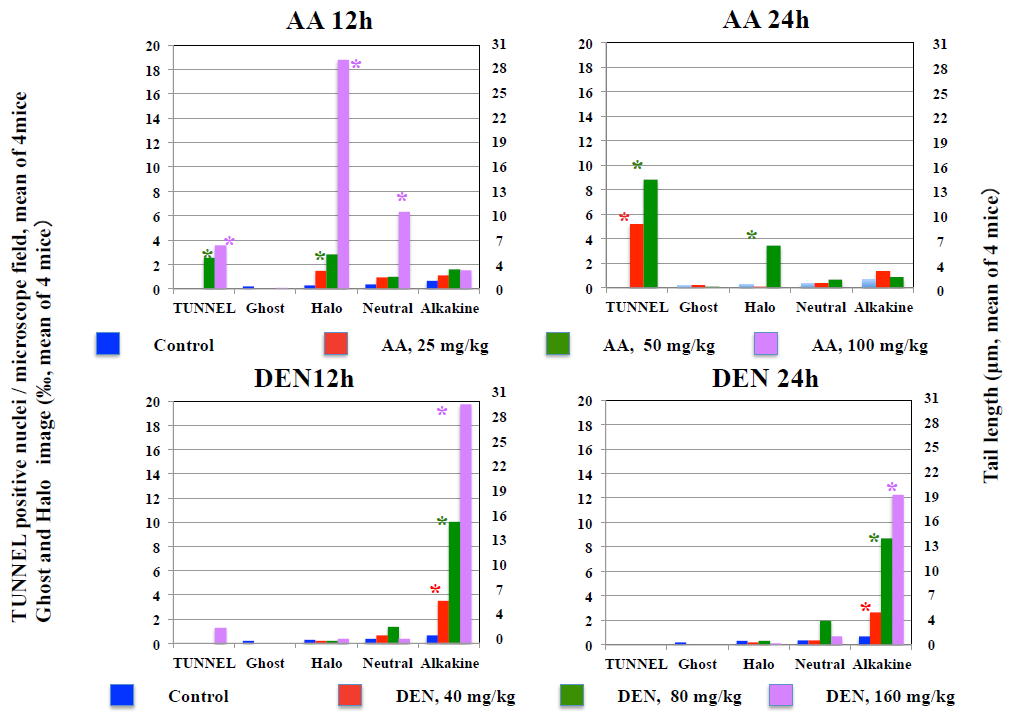
*Significantly higher than control: p<0.05. Figure 4: Results of TUNNEL assay, diffusion assay, and neutral comet assay, and alkaline comet assay in the liver.
Stomach Mucosa
In mice received NaCl and DMA, necrosis was observed in the upper and ridge layers of the gastric mucosa in all mice, and in the mucosa of the lower layer of mucosa in most mice. On the other hand, necrosis was not observed in any of the areas of the gastric mucosa (upper, lower, or ridge layers) in mice received EMS and those in the control group. In mice received NaCl and DMA, the frequencies of Halo increased significantly in the upper layers and ridge of the gastric mucosa, the frequencies of TUNNEL-positive cells increased in the ridge and upper layer but not lower layer of the gastric mucosa. In the gastric mucosa of the in mice received EMS, tail length increased in the alkaline comet assay but not neutral comet assay. Any increases in TUNNEL-positive-frequency, the frequencies of Halo and Ghost were not observed in mice received EMS and those in the control group.
Liver
In mice received CCl4 at 500–2000 mg/kg, hepatic necrosis was observed in all mice 24 hours after the administration, and the frequency of TUNNEL-positive cells and Halo but not Ghost images significantly increased. The increases in the tail length in the neutral but not alkaline comet assay were observed in mice received the CCl4.
In mice received D-Gal at 500–2000 mg/kg, hepatic necrosis was observed in all mice 12 hours after its administration, Also, the frequency of Halo but not Ghost images increased significantly. At 24 hours after its administration, while Halo-frequency increased, any deaths were not observed in D-Gal received mice. In mice receive AA at 50–100 mg/kg, hepatic necrosis of was observed in all mice 12 hours after its administration, and the frequencies of TUNNEL-positive cells and ˙Halo but not Ghost images significantly increased. The tail length increased in neutral but not alkaline comet assays at 100 mg/kg. All mice died within 24 hours after the administration of AA at 100 mg/kg.
On the other hand, hepatic necrosis was not observed in mice received DEN and in the control group, and any significant increase in the frequency of TUNNEL-positive cells, Halo images, and Ghost images did not observed in mice received DEN and mice in the control group, a significant increase in the tail length increased significantly in the alkaline but not neutral comet assays. Tail length did not increase in neither in alkaline nor neutral comet assays in mice in the control group.
Discussion
In the comet assay, it is considered that in cells undergoing apoptosis in which DNA double-strand breaks (DDBs) occur Ghost images having as a large flared tail on a small nucleus are observed. On the other hand, in necrotic cells, it is considered that narrow tails of varying lengths are formed on a relatively large nucleus [2, 5, 6]. In the pathological observations of this experiment, the incidence of cells undergoing apoptosis was not observed, which is consistent with the results that significant increase in the frequency of Ghost images was not observed in the alkaline comet assay. Therefore, it is considered that cell death is not detected solely by observing Ghost images. In the gastric mucosa with necrosis and liver with necrosis, the frequencies of TUNNEL- positive cells and Halo images significantly increased, suggesting that the incidence of Halo images closely correlates with the incidence of necrosis. Therefore, Halo images would reflect DDBs resulting from cell death. While the neutral comet assay is also expected to detect DDBs, the incidence of TUNNEL-positive cells and Halo images did not necessarily correlate with the increase in tail length in the neutral comet assay. It would be considered that small DNA fragments diffuse into gel near the nucleus in the diffusion assay without electrophoresis, to form Halo image, whereas in the neutral comet assay those small DNA fragments would be lost by moving widely away from the nucleus during the electrophoresis not resulting in detectable tails in the neutral comet assay with electrophoresis. The appearance of Halo images correlated relatively well with the appearance of TUNNEL-positive cells and pathological abnormality, but dead cells were not detected as the Ghost image. This is considered to be because, even in the alkaline comet assay, small DNA fragments were lost from the vicinity of the nucleus during electrophoresis, making them undetectable as Ghost images.
The increases in TUNNEL-positive cells and of Halo- images did not accompanied with the increase in tail length in the alkaline comet assay. In particular, although the frequency of TUNNEL-positive cells was high and severe necrosis was observed in the liver in mice received 2000 mg/kg CCl4 and stomach ridge in mice received 2500 mg/kg NaCl, tail length did not increase in the alkaline comet assay, suggesting the possibility is low that DDBs due to cell death contribute to an increase in tail length in the alkaline comet assay. On the other hand, in the liver and gastric mucosa of mice received genotoxic EMS and DEN, the tail length significantly increased in the alkaline comet assay despite the absence of pathological abnormality and the increase in the frequencies of TUNNEL-positive cells and Halo images. Therefore, it has been shown that the positive responses due to genotoxic potential in the alkaline comet assay can be produced independently to cell death. The absence of increased tail length as measured by the alkaline comet assay in the gastric mucosa and liver of mice received NaCl, DMA, CCl4, AA, and D-Gal agree with their non-genotoxicity, showing the possibility that positive responses in the alkaline comet assay are not produced by non-genotoxic chemicals even in organs with necrosis.
The results of this study would indicate the possibility is low that the generation of DNA fragments due to cell death is responsible for a significant increase in tail length in the alkaline comet assay. This might be considered that DNA fragments produced by cell death are too small to remain near the nucleus during the electrophoresis to become visualized as tails. However, performing the diffusion assay in parallel with the alkaline comet assay to measure the incidence of Halo images would be considered to be useful for confirming whether cell death occurs. In other words, if a concurrently performed diffusion assay is positive, the possibility could not be excluded that the positive result of the comet assay is a false positive due to cell death.
Acknowledgements
This research was conducted in Advanced Material and Biological Engineering Course and Biological Engineering Course, National Institute of Technology, Hachinohe College as part of a graduation research project by Eiko Wada and Ayumi Koyachi under the research guidance of course staffs based on allocation of school educational expenses. The authors acknowledge the Advanced Material and Biological Engineering Course, National Institute of Technology, Hachinohe College.
References
-
Singh NP, McCoy MT, Tice RR, Schneider EL (1988) A simple technique for quantitation of low levels of DNA damage in individual cells. Exp Cell Res 174: 184-191.
-
Fairbairn DW, Olive PL, O’Neill KL (1995) The comet assay: a comprehensive review. Mutat Res 339: 37-59.
-
Tice RR, Agurell E, Anderson D, Burlinson B, Hartmann A, et al. (2000) Single cell gel/comet assay: guidelines for in vitro and in vivo genetic toxicology testing. Environ Mol Mutagen 35: 206-221.
-
Meintieres S, Nesslany F, Pallardy M, Marzin D (2003) Detection of ghost cells in the standard alkaline comet assay is not a good measure of apoptosis. Environ Mol Mutagen 41: 260-269.
-
Kizilian N, Wilkins RC, Reinhardt P, Ferrarotto C, McLean JR, et al. (1999) Silver-stained comet assay for detection of apoptosis. Biotechniques 27: 926-930.
-
Olive PL, Banath JP, Durand RE (1990) Detection of etoposide resistance by measuring DNA damage in individual Chinese hamster cells. J Natl Cancer Inst 82: 779-783.
-
Choucroun P, Gillet D, Dorange G, Sawicki B, Dewitte JD (2001) Comet assay and early apoptosis. Mutat Res 478: 89-96.
-
Basco Z, Everson RB, Eliason JF (2000) The DNA of annexin V-binding apoptotic cells is highly fragmented. Cancer Res 60: 4623-4628.
-
Czene S, Testa E, Nygren J, Belyaev I, Harms-Ringdahl M (2002) DNA fragmentation and morphological change in apoptotic human lymphocytes. Biochem Biophys Res Commun 294: 872-878.
-
Roser S, Pool-Zobel BL, Rechkemmer G (2001) Contribution of apoptosis to responses in the comet assay. Mutat Res 497: 169-175.
-
Rundell MS, Wagner ED, Plewa MJ (2003) The comet assay: genotoxic damage or nuclear fragmentation? Environ Mol Mutagen 42: 61-67.
-
Sasaki YF, Tsuda S, Izumiyama F, Nishidate E (1997) Detection of chemically induced DNA lesions in multiple mouse organs (liver, lung, spleen, kidney, and bone marrow) using the alkaline single cell gel electrophoresis (Comet) assay. Mutat Res 388: 33-44.
-
Sasaki YF, Sekihashi K, Izumiyama F, Nishidate E, Saga A, et al. (2000) The comet assay with multiple mouse organs: Comparison of comet assay results and carcinogenicity with 208 chemicals selected from the IARC Monographs and U.S. NTP carcinogenicity database. Crit Rev Toxicol 30(6): 629-799.
-
Vasquez M, Tice RR (1997) Comparative analysis of apoptosis versus necrosis using the single cell gel (SCG) assay. Environ Mol Mutagen 29: 53.
- Evaluation of Skin Aging Preventive Effects of Cherry Blossom Petal Extracts Through Antioxidant and Anti-Glycation Activities
- Pattern of Gonadal Hormones in Oral Testosterone-Supplimented Male Wistar Rats with Diabetes-Induced Hypogonadism
- Re-Evaluation of the Genotoxicity of Currently Used Food Dyes in Mouse Multiple Organs Via Continuous Administration by Drinking Using the Comet Assay
- Pharmacogenetics of Type 2 Diabetes Mellitus: Linking Genetic Variability to Drug Efficacy and its Cardiovascular Outcomes
- Exploratory Proteomic Profiling of SARS-CoV-2 Infected THP-1 Macrophages Reveals Alterations in Inflammatory Response and Cellular Metabolism
- Study of Genotoxicity of Hepatocarcinogens in Multiple Organs in Mice by Feeding and Drinking Using the Comet Assay