Continuous Wavelet Transform Methods for the Simultaneous Quantification of Brimonidine Tartrate and Timolol Maleate in an Eye Drop Formulation
In this research paper, the UV spectral data vectors of samples were processed by two different continuous wavelet transform (CWT) approaches for simultaneous quantification of Brimonidine tartrate (BRI) and timolol maleate (TIM) in an eye drop formulation. The application of the CWT methods to the analysis of BRI-TIM mixtures did not require the use of a preliminary chemical separation. After preliminary experiments, Symlet5 continuous wavelet transforms (sym5-CWT) and Mexican Hat continuous wavelet transform (mexh-CWT) were found to be very suitable to simultaneously quantify the analyzed drugs. Calibration curves for BRI and TIM in the concentration range of 5.0-25.0 μg/mL and 8.0-72.0 μg/mL were obtained by measuring the CWT amplitudes in the wavelet domain. The proposed sym5-CWT and mexh-CWT methods were validated and applied to the quantitative analysis of commercial eye drop samples containing the BRI and TIM drugs.
Erdal Dinç* and Eda Büker
Turkey
mail: dinc@ankara.edu.tr06100 eye drop samples containing the BRI and TIM drugs.
Timolol maleate
Introduction
Numerous methods are available to analyze chemical components. Particularly, high-performance liquid chromatography (HPLC) (or ultra-performance liquid chromatography (UPLC)) and spectrophotometry are two of the most commonly used in analytical chemistry. In the analysis of pharmaceuticals, HPLC or UPLC is a standard techniques used in related labs. In HPLC analyses, one of the main problems is to find optimal chromatographic conditions e.g. flow rate, column temperature, type and pH of inorganic modifiers in mobile phase. In some cases, this requires long laboratory works and excessive consumption of mobile phase to get suitable chromatographic conditions giving a perfect separation or exact elution of drugs. Despite its advantages, HPLC can be costly due to the mentioned challenges. Additionally, the chromatographic technique may not always give expected separation and quantification results. Visible-ultraviolet (VIS-UV) spectrophotometry is another instrumentation method for the analysis of drug substances. However, the determination of drug substances in mixtures containing two or more drugs is not possible by direct absorbance measurements due to overlapping spectral bands. In order to overcome the mentioned disadvantages of HPLC (or UPLC) and UV- VIS spectrophotometry, scientists require to develop or implement new methods for the analysis of active compounds in complex samples. In this regard, CWT approach is a powerful signal-processing tool for data reduction, de-noising, baseline correction and resolution of overlapping spectra of analyzed drugs [1]. In our previous works, CWT methods with zero- crossing technique and ratio spectra procedure were directly applied to the simultaneous quantitative resolution of binary and ternary mixtures [2] and successful results were obtained. Brimonidine tartrate (BRI) is an effective ocular hypotensive agent which is currently undergoing clinical evaluation [3]. Timolol Maleate (TIM) is chemically described as (S)-1-(tertbutylamino)-3-[(4- morpholino-1, 2, 5-thiadiazol-3-yl) oxy]-propan-2-ol Maleate which is official in U.S.P. It was introduced for clinical use in the management of glaucoma in 1978 since then none of them ewer beta blocker have been found more effective than TIM [4]. The literature survey showed that there were many analytical methods for the quantitative analysis of BRI and TIM, e.g. HPLC [5, 6, 7, 8, 9, 10, 11], spectrophotometry [12, 13, 14], flourimetric methods [15, 16], high-performance thin- layer chromatography [17], capillary electrophoresis [18], gas chromatography–mass spectrometry [19], chemiluminescence method [20], membrane electrodes method [21] and extraction-photometric method [22]. This paper describes new implementations of the sym5-CWT and mexh-CWT methods to the UV absorption spectra for the simultaneous quantification of BRI and TIM in synthetic binary mixtures and commercial ophthalmic samples. The validation of both sym5-CWT and mexh-CWT were validated by analyzing the different validation samples e.g., synthetic binary mixtures, intra-day and inter-day samples and standard addition samples. Then, then proposed wavelet transforms were successfully applied to the real samples. The results obtained by CWT methods were statistically compared with those obtained by the UPLC method developed in the literature [23] and good agreements were reported.
Experimental
Instrument and Software
The UV absorption spectra data were obtained using Shimadzu UV-2520 double beam UV–Vis spectrophotometer connected to a computer loaded with UV Probe 2.32 software. The spectra of the calibration and validation samples were plotted with the intervals of Δλ= 0.1 nm in wavelength range of 220.0-340.0 nm. Microsoft EXCEL and Wavelet toolbox in Mat lab software (The Math Works, Natick, MA, USA) were used for the spectral data treatments and statistical calculations.
Pharmaceutical Ophthalmic Dosage Form
| Standard, Calibration and Validation | |
|---|---|
| Solutions |
Stock solutions of both compounds separately were prepared by dissolving 10 mg BRI and 10 mg TIM in a volume of 100 mL in methanol. The calibration samples of BRI and TIM in the concentration ranges 5.0-25.0 µg/mL and 8.0-72.0 µg/mL were prepared by diluting stock solutions. For the method validation processes, 11 different synthetic mixtures containing BRI and TIM in the working concentration ranges were prepared from the above stock solutions. Inter-day and intra-day studies containing BRI and TIM at three different concentration levels (low: 6 µg/mL, medium: 15 µg/mL and high: 24 µg/mL for BRI and low: 10 µg/mL, medium: 40 µg/mL and high: 70 µg/mL for TIM) were freshly prepared. Standard addition samples containing three different levels for BRI and TIM; low: 6 µg/mL, medium: 12 µg/mL and high: 16 µg/mL and low: 8 µg/mL, medium: 30 µg/mL and high: 40 µg/mL, were prepared, respectively. All samples were prepared in methanol during this study.
Preparation of Commercial Eye Drop Samples.
A 1.0 mL of commercial eye drop sample was transferred into a 50 mL calibrated flask and then the volume was made up to 50 mL with methanol. The content of the sample was sonicated for about 10 min and then the solution was filtered through a 0.45µm Sartorius Minisart membrane filter. The similar sample preparation was repeated 10 times for the analysis of the commercial eye drop samples.
Result and Discussion
CWT Application to the UV Spectra Data
The absorption spectra of the calibration solutions of BRI and TIM in the range of 5.0-25.0 µg/mL, 8.0-72.0 µg/mL were recorded between 220.0-340.0 nm as indicated in Figure 1a. As it can be seen in this figure 1a, the absorption spectra of BRI and TIM over the range of 220.0–340.0 nm overlap with each other. To overcome this problem, we applied new signal processing methods (the CWT methods) to the raw UV data vectors obtained from the UV absorption spectra of BRI and TIM for the calibration samples, synthetic mixtures, intra-day and inter-day samples, standard addition samples and commercial eye drop samples. In practice, we tested several wavelet families for the find suitable signal processing approach to reach the highest recovery results of the simultaneous quantification of BRI and TIM in eye drop samples. After these experiments, we decided that two wavelet families, sym5 and mexhwavelet tools for the quantitative estimation of the analyzed drugs.
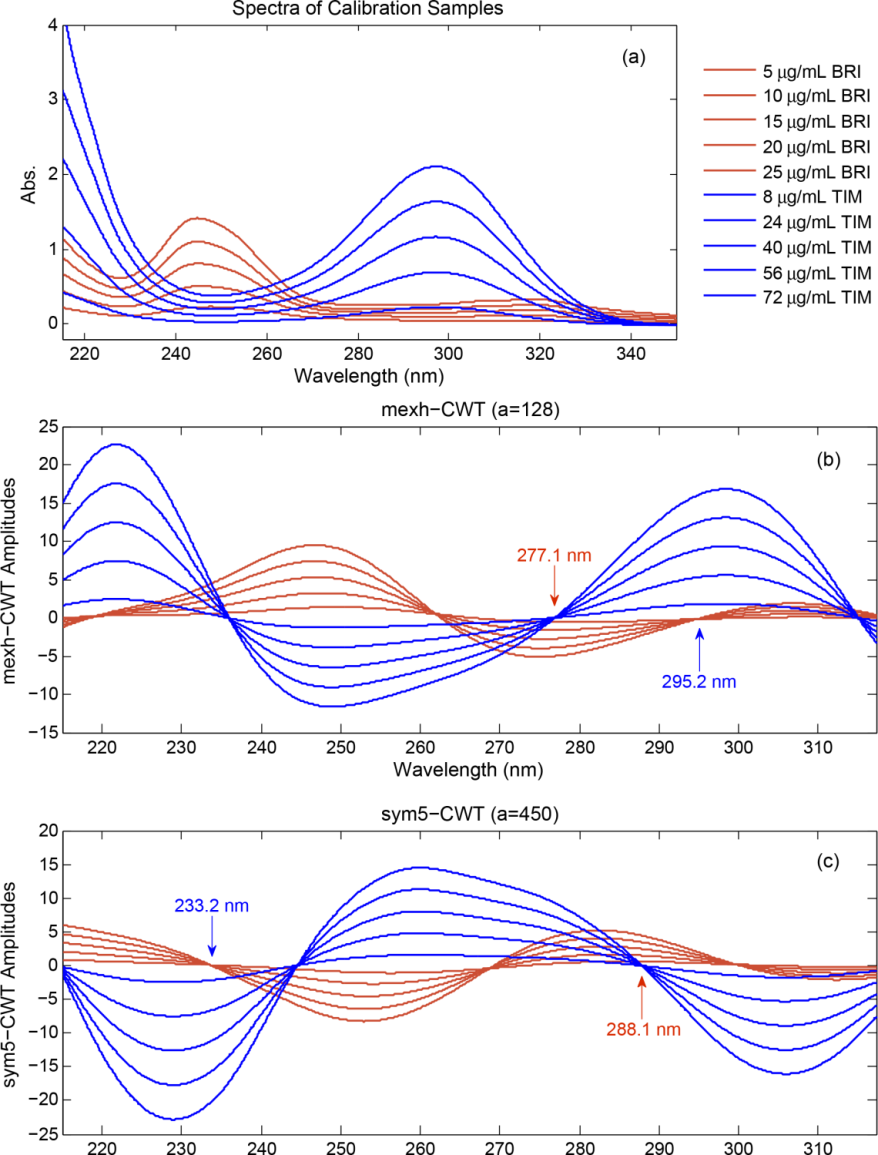
Figure 1a: UV spectra of BRI and TIM of the calibration samples, b) the mexh-CWT spectra and c) the sym5-CWTspectra.
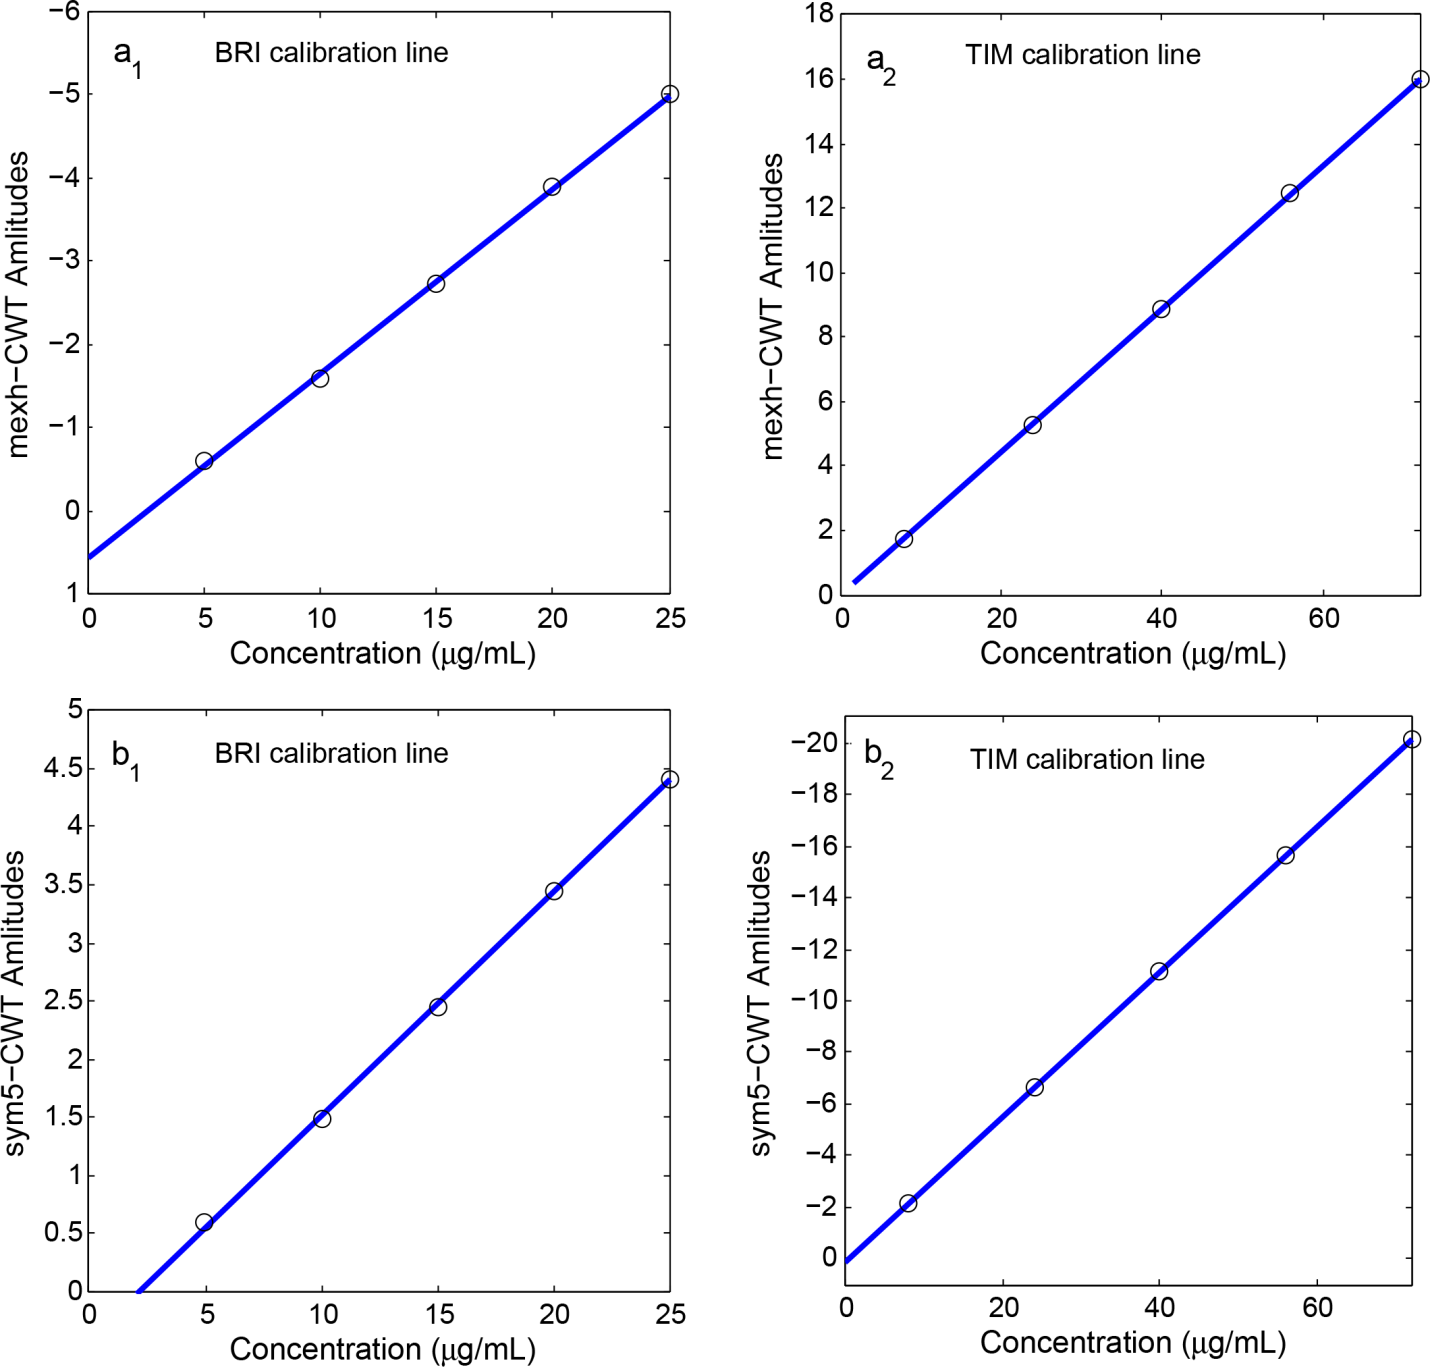
The chosen sym5-CWT and mexh-CWT methods were applied to the UV spectral vectors of the calibration samples in the 220.0-340.0 nm wavelength regions and the sym5-CWT and Mexh-CWT spectra were obtained by plotting the CWT-coefficients against the wavelength. Figure 1b and c shows the sym5-CWT and mexh-CWT spectra, respectively. In the application of the mexh-CWT method, calibration graphs were calculated by measuring the amplitudes at a wavelength of 277.1 nm for BRI and 295.2 nm for TIM. Calibration graph in the application of the sym5-CWT method; was computed by using the measurements of the amplitudes at 233.2 nm for BRI and 288.1 nm for TIM. The linear regression analysis of calibration samples and corresponding statistical results were illustrated in Table 1. Figure 2 shows the calibration lines for BRI and TIM using the proposed signal processing methods. BRI and TIM in the analyzed samples were determined by the calibration curves of the related drugs.
- Parameter mexh-CWT sym5-CWT
- BRI
- TIM
- BRI
- TIM m
- 0.2228
- 0.2231
- 0.1924
- 0.2815 n
- 0.5745
- -0.0348
- -0.4097
- 0.1067 r
- 0.9997
- 1
- 0.9998
- 1
- SD (m)
- 3.35x10⁻³
- 3.50 x10⁻⁴
- 2.23 x10⁻³
- 4.23 x10⁻⁴
- SD (n)
- 5.56 x10⁻²
- 5.56 x10⁻²
- 3.69 x10⁻²
- 3.69 x10⁻²
- SD (r)
- 5.30 x10⁻²
- 1.77 x10⁻²
- 3.52 x10⁻²
- 2.14 x10⁻²
- LOD
- 0.29
- 1.39
- 0.27
- 0.55
- LOQ
- 0.97
- 4.62
- 0.9
- 1.82
Table 2: Linear regression analysis and statistical results of mexh-CWT and sym5-CWT methods.
m = Slope of the linear regression equation n = Intercept of the linear regression equation r = Correlation coefficient of the linear regression equation SD (m) = Standard error of slope SD (n) = Standard error of intercept SD(r) = Standard error of correlation LOD = Limit of detection (µg/mL) LOQ = Limit of quantitation (µg/mL)
Validation of the Applied CWT Methods
In the mexh-CWT and sym5-CWT applications, the a good linearity for BRI and TIM in the working range of 5.0-25.0 μg/mL an 8.0-72.0 μg/mL, respectively, was reported from the regression coefficients indicated in Table 1. The limit of quantitation (LOD, signal/noise=3) and limit of detection (LOQ, signal/noise=10) were computed using standard deviation of the linear regression equations of the analyzed drugs. For the validity of 11 different synthetic mixtures were prepared and analyzed by the mexh-CWT and Sym5-CWT methods. Their recovery results were listed in Table 2.The analysis results demonstrate that satisfactory accuracy and precision of the proposed CWT signal processing methods. In order to visualize the reproducibility of the Mexh-CWT and Sym5-CWT methods, the intra-day and inter-day experiments were done by analyzing the intra-day and inter-day samples as described in the section “2.3. Standard, calibration and validation solutions”. Percent mean recoveries; relative standard deviations and relative standard errors were presented in Table 3. These results show that the newly applied CWT methods are very useful for the analysis of BRI and TIM in samples with desirable precision and accuracy. Before analyzing commercial eye drop samples, the standard addition technique was used to determine whether the excipients in the commercial eye drop preparation were an effect on the analysis of the mexh-CWT and Sym5-CWT methods. In order to observe the presence and absence of the excipient effect on the analysis of the related drugs, standard addition samples were analyzed and then assay results were presented in Table 4. From analysis results in Table 4, noexcipient effect on the determination of BRI and TIM was reported.
| Mexh-SDD | Sym5-SDD | |||||||||||||||||||||||||||||
|---|---|---|---|---|---|---|---|---|---|---|---|---|---|---|---|---|---|---|---|---|---|---|---|---|---|---|---|---|---|---|
| Added (µg/mL) | ||||||||||||||||||||||||||||||
| Found (µg/mL) | Recovery (%) | Found (µg/µL) | Recovery (%) | |||||||||||||||||||||||||||
| Kod | BRI | TIM | BRI | TIM | BRI | TIM | BRI | TIM | BRI | TIM | ||||||||||||||||||||
| M1 | 5 | 40 | 5.1 | 39.7 | 101.9 | 99.2 | 4.9 | 39.8 | 97.9 | 99.4 | ||||||||||||||||||||
| M2 | 10 | 40 | 10.6 | 39.5 | 105.6 | 98.8 | 10.1 | 39.9 | 101.4 | 99.8 | ||||||||||||||||||||
| M3 | 15 | 40 | 15.4 | 39.4 | 102.5 | 98.5 | 14.9 | 39.8 | 99.6 | 99.5 | ||||||||||||||||||||
| M4 | 20 | 40 | 20.4 | 39.6 | 101.9 | 99 | 19.9 | 40.1 | 99.5 | 100.2 | ||||||||||||||||||||
| M5 | 25 | 40 | 24.9 | 39.7 | 99.7 | 99.3 | 24.5 | 40.5 | 98.1 | 101.1 | ||||||||||||||||||||
| M6 | 16 | 8 | 16.7 | 7.8 | 104.3 | 97.3 | 16.6 | 8.2 | 103.5 | 102.4 | ||||||||||||||||||||
| M7 | 16 | 24 | 16.4 | 23.6 | 102.4 | 98.5 | 16.1 | 24.4 | 100.9 | 101.8 | ||||||||||||||||||||
| M8 | 16 | 40 | 16.4 | 39.6 | 102.6 | 99.1 | 16 | 40.2 | 100.1 | 100.4 | ||||||||||||||||||||
| M9 | 16 | 56 | 16 | 55.3 | 100 | 98.8 | 15.6 | 55.8 | 97.4 | 99.7 | ||||||||||||||||||||
| M10 | 16 | 72 | 16.7 | 71.8 | 104.5 | 99.7 | 16.1 | 73.5 | 100.8 | 102 | ||||||||||||||||||||
| M11 | 20 | 50 | 20.4 | 49.8 | 102.2 | 99.6 | 19.8 | 50.3 | 99.2 | 100.6 | ||||||||||||||||||||
| X | 102.5 | 98.9 | X | 99.8 | 100.6 | |||||||||||||||||||||||||
| SD | 1.78 | 0.64 | SS | 1.76 | 1.06 | |||||||||||||||||||||||||
| RSD | 1.73 | 0.65 | BSS | 1.77 | 1.05 |
Table 3: Analysis results of applying Mexh-CWT and Sym5-CWT methods to BRI-TIM binary synthetic mixtures.
X ̅= Mean SD= Standard deviation RSD= Relative standard deviation
| Found (µg/mL) | |||||||||||||||||
|---|---|---|---|---|---|---|---|---|---|---|---|---|---|---|---|---|---|
| Added (µg/mL) | |||||||||||||||||
| mexh-CWT | sym5-CWT | ||||||||||||||||
| BRI | TIM | BRI | TIM | BRI | TIM | ||||||||||||
| Inter- | day | 6 | 10 | 6.1 | 9.55 | 6.06 | 10.46 | ||||||||||
| 15 | 40 | 15.26 | 39.60 | 14.91 | 40.06 | ||||||||||||
| 24 | 70 | 24.12 | 70.20 | 23.53 | 71.95 | ||||||||||||
| Intra- | day | 6 | 10 | 5.56 | 9.55 | 5.94 | 10.44 | ||||||||||
| 15 | 40 | 15.12 | 39.82 | 14.87 | 40.3 | ||||||||||||
| 24 | 70 | 24.1 | 70.72 | 23.57 | 72.52 | ||||||||||||
| Recovery (%) | |||||||||||||||||
| mexh-CWT | sym5-CWT | ||||||||||||||||
| BRI | TIM | BRI | TIM |
| Inter-day | 101.6 | 95.5 | 101.1 | 104.6 | ||||||
|---|---|---|---|---|---|---|---|---|---|---|
| 101.7 | 99.0 | 99.4 | 100.2 | |||||||
| 100.5 | 100.3 | 98 | 102.8 | |||||||
| Intra-day | 92.6 | 95.5 | 99 | 104.4 | ||||||
| 100.8 | 99.5 | 99.1 | 100.8 | |||||||
| 100.4 | 101.0 | 98.2 | 103.6 | |||||||
| RSD (%) | ||||||||||
| mexh-CWT | sym5-CWT | |||||||||
| BRI | TIM | BRI | TIM | |||||||
| Inter-day | 0.96 | 0.21 | 0.68 | 0.3 | ||||||
| 0.68 | 0.13 | 0.36 | 0.2 | |||||||
| 0.24 | 0.21 | 0.1 | 0.32 | |||||||
| Intra-day | 5.52 | 0.11 | 0.21 | 0.07 | ||||||
| 0.09 | 0.20 | 0.04 | 0.20 | |||||||
| 0.11 | 0.26 | 0.23 | 0.41 | |||||||
| RSE (%) | ||||||||||
| mexh-CWT | sym5-CWT | |||||||||
| BRI | TIM | BRI | TIM | |||||||
| Inter-day | 1.63 | -4.51 | 1.06 | 4.61 | ||||||
| 1.72 | -1.00 | -0.57 | 0.15 | |||||||
| 0.52 | 0.28 | -1.97 | 2.79 | |||||||
| Intra-day | -7.36 | -4.47 | -0.98 | 4.39 | ||||||
| 0.82 | -0.46 | -0.87 | 0.75 | |||||||
| 0.42 | 1.03 | -1.78 | 3.60 |
Table 5: Analysis results of intra-day and inter-day samples.
RSD= Relative standard deviation RSE= Relative standard error (n= 3 for every concentration level)
| Added (μg/mL) | Found (μg/mL) | ||||||||||||||||||||||||||||||||||||||
|---|---|---|---|---|---|---|---|---|---|---|---|---|---|---|---|---|---|---|---|---|---|---|---|---|---|---|---|---|---|---|---|---|---|---|---|---|---|---|---|
| mexh-CWT | sym5-CWT | ||||||||||||||||||||||||||||||||||||||
| BRI | TIM | BRI | TIM | BRI | TIM | ||||||||||||||||||||||||||||||||||
| Formulation | 6 | 8 | 5.87 | 8.03 | 5.95 | 8.17 | |||||||||||||||||||||||||||||||||
| Formulation | 12 | 3 | 0 | 12.04 | 30.16 | 12.12 | 30.76 | ||||||||||||||||||||||||||||||||
| Formulation | 16 | 4 | 0 | 16.07 | 41.03 | 16.41 | 41.63 | ||||||||||||||||||||||||||||||||
| Recovery (%) | |||||||||||||||||||||||||||||||||||||||
| mexh-CWT | sym5-CWT | ||||||||||||||||||||||||||||||||||||||
| BRI | TIM | BRI | TIM | ||||||||||||||||||||||||||||||||||||
| 97.9 | 100.4 | 99.2 | 1 | 02.1 | |||||||||||||||||||||||||||||||||||
| 100. | 3 | 100.5 | 101.0 | 1 | 02.5 | ||||||||||||||||||||||||||||||||||
| 100. | 4 | 102.6 | 102.6 | 1 | 04.1 | ||||||||||||||||||||||||||||||||||
| RSD (%) | |||||||||||||||||||||||||||||||||||||||
| mexh-CWT | sym5-CWT | ||||||||||||||||||||||||||||||||||||||
| BRI | TIM | BRI | TIM | ||||||||||||||||||||||||||||||||||||
| 0.18 | 0.23 | 0.15 | 0.20 | ||||||||||||||||||||||||||||||||||||
| 0.23 | 0.83 | 0.10 | 1.60 | ||||||||||||||||||||||||||||||||||||
| 0.21 | 0.28 | 0.68 | 0.90 |
Table 6: Assay results of standard adding samples.
RSD= Relative standard deviation
| Analysis of Formulation | Commercial | Eye | Drop | was reported for the analysis results obtained by applying the validated mexh-CWT and sym5-CWTmethods to the commercial eye drop formulation. |
In this research paper, the proposed signal processing methods, Mexh-CWT and Sym5-CWT, were applied to the simultaneous quantitative quantification of BRI and TIM in eye drop samples. Assay results were presented in Table 5. As it can be seen in Table 5, a good accordance with the acceptable standard deviation and relative standard deviation mg/mL mexh-CWT sym5-CWT *UPLC method Exp. No. BRI TIM BRI TIM BRI TIM 1 2.01 4.98 1.99 5.02 1.94 5.06 2 1.99 5.02 2.02 5.01 1.94 5.01 3 1.94 5.06 1.94 5.08 1.98 4.97 4 2.01 5.04 1.96 4.98 1.94 4.93 5 1.97 5.12 2.03 4.99 2 5.15 6 2 5.03 2.01 4.97 2.03 5.08 7 2.04 5.05 2.04 4.98 2.05 5.29 8 1.95 5.03 1.98 4.96 2.06 5.17 9 1.96 4.92 1.97 4.95 1.99 5.01 10 1.98 5.01 1.98 4.91 1.96 4.96 Mean 1.98 5.03 1.99 4.99 1.99 5.06 SD 0.03 0.05 0.03 0.05 0.05 0.11 RSD 1.51 1.05 1.71 0.91 2.37 2.23 Confidence interval Mean ± 0.02 Mean ± 0.04 Mean ± 0.02 Mean ± 0.04 Mean ± 0.04 Mean ± 0.08 was reported for the analysis results obtained by applying the validated mexh-CWT and sym5- CWTmethods to the commercial eye drop formulation. Using one-way ANOVA test, the determination results of BRI and TIM in analyzed commercial sample were statistically compared with those of UPLC method in the literature [23]. It was observed that there is no difference between analysis by signal processing methods and UPLC approach.
- SD= Standard deviation
- RSD= Relative standard deviation
- *literature method
Table 8: Analysis results of the commercial eye drop formulation obtained using the Mech-CWT and Sym5-CWT methods.
| Experiment | ||||||||||||
| Sum | Average | Variance | ||||||||||
| Number | ||||||||||||
| Methods | BRI | TIM | BRI | TIM | BRI | TIM | BRI | TIM | ||||
| UPLC | 10 | 10 | 19.89 | 50.63 | 1.99 | 5.06 | 0.0021 | 0.0126 | ||||
| Mexh-SDD | 10 | 10 | 19.9 | 50.03 | 1.99 | 5 | 0.0014 | 0.0078 | ||||
| Sym5-SDD | 10 | 10 | 19.92 | 49.85 | 1.99 | 4.99 | 0.001 | 0.0021 | ||||
| SS | df | MS | F-calculated | P-value | F-table | |||||||
| Variance | BRI | TIM | BRI | TIM | BRI | TIM | BRI | TIM | BRI | TIM | BRI | TIM |
| Between | 0.0132 | 0.0565 | 4 | 4 | 0.0033 | 0.0141 | 1.93 | 2.32 | 0.12 | 0.07 | 2.58 | 2.58 |
| methods | ||||||||||||
| Within | 0.0767 | 0.2737 | 45 | 45 | 0.0017 | 0.0061 | ||||||
| methods | ||||||||||||
| Total | 0.0899 | 0.3302 | 49 | 49 |
Table 9: ANOVA test of mexh-CWT, sym5-CWT method and literature method (UPLC).
| SS= Sum of squares | ||
|---|---|---|
| df = Degrees of freedom | ||
| MS = Mean of squares |
Conclusion
In this manuscript, a new combined use of CWT approaches was applied to the quantitative resolution of the overlapping UV spectral bands for the simultaneous quantitative analysis of BRI and TIM in an eye drop formulation. The simultaneous quantification of BRI and TIM in an eye drop formulation by were carried out without any chemical pre-treatment or any preliminary separation step. Compared to the UPLC method [23], the comparable assay results were obtained by applying mexh-CWT and Sym5- CWTmethods to the quantitation of the related active substances in the analyzed samples. The assay results indicate that these CWT approaches are very useful for the quality control and a routine analysis of the commercial eye drop formulation containing BRI and TIM drugs.
References
-
Dinç E (2013) Wavelet Transforms and Applications in Drug Analysis. FABAD J. Pharm. Sci 38(3): 159-165.
-
Dinç E, Baleanu D (2011) Fractional-continuous wavelet transforms and ultra-performance liquid chromatography for the multi component analysis of a ternary mixture containing thiamine, pyridoxine, and lidocaine in ampules. Journal of AOAC International 95(3): 903-912.
-
Acheampong A, Tang-Liu DD (1995) Measurement of brimonidine concentrations in human plasma by a highly sensitive gas chromatography/mass spectrometric assay. Journal of Pharmaceutical and Biomedical Analysis 13(8): 995-1002.
-
Umesh DL, Rohan KB, Rasika VZ, Amol AT (2014) Development and validation of stability indicating reverse phase high performance liquid chromatography method for Timolol Maleate. International Journal of PharmTech Research 6(5): 1429-1435.
-
Narendra A, Deepika D, MathrusriAnnapurn M (2012) Liquid chromatographic method for the analysis of brimonidine in ophthalmic formulations. E-Journal of Chemistry 9(3): 1327-1331.
-
Jiang S, Chappa AK, Proksch J (2009) A rapid and sensitive LC/MS/MS assay for the quantitation of brimonidine in ocular fluids and tissues. Journal of Chromatography B: Analytical Technologies in the Biomedical and Life Sciences 877(3): 107-114.
-
Madhavi A, Naidu A, Subba Rao DV, Srinivasu P (2009) Development and validation of a new LC method for analysis of brimonidine tartrate and related compounds. Chromatographia 69 (11-12): 1413-1419.
-
Sonanis MC, Rajput AP (2011) Development and validation of a new stability indicating analytical method for the determination of related components of Brimonidine tartrate in drug substances and drug product using UPLC. International Journal of Pharmacy and Pharmaceutical Sciences 3(1): 145-150.
-
Hamdan II, Qurani H (2009) Development and validation of a HPLC method for determination of potential residual cortisone compounds in timolol maleate eye drops. Journal of Liquid Chromatography and Related Technologies 32(3): 449-467.
-
Rogers LA, Crews KE, Long SG, Patterson KM, McCune JE (2009) Evaluation of chromatographic methods for drug products containing polar and non-polar molecules using reversed phase, hydrophilic interaction, and ion exchange chromatography. Journal of Liquid Chromatography and Related Technologies 32(15): 2246-2264.
-
Rizk MS, Merey HA, Tawakkol SM, Sweilam MN (2015) Development and validation of a stability- indicating micellar liquid chromatographic method for the determination of timolol maleate in the presence of its degradation products. J Chromatogr Sci 53(4): 503-510.
-
Mathrusri Annapurna M, NarendraR, Pattanaik MR (2015) Novel analytical spectrophotometric methods for the quantification of brimonidine tartrate -An adrenergic agonist. Journal of Chemical and Pharmaceutical Sciences 8:3, 509-514 [INLINE_TABLE:7:0]
-
Vislous O, Bevz N, Georgiyants V (2014) Development of the extraction-photometric method for quantitative determination of timolol maleate. Journal of Chemical and Pharmaceutical Research 6:9, 156-159
-
Sunitha G, Bhagirath R, Alapati VR, Ramakrishna K, Subrahmanyam CVS et al. (2013) Fluorimetric quantification of brimonidine tartrate in eye drops. Indian Journal of Pharmaceutical Sciences 75(6): 730-732.
-
Ibrahim F, El-Enany N, El-Shaheny RN, Mikhail IE (2015) Validated spectrofluorimetric and spectrophotometric methods for the determination of brimonidine tartrate in ophthalmic solutions via derivatization with NBD-Cl. Application to stability study. Luminescence, 30(3): 309-317.
-
Anand M, Fonseca A, Gandhi SV, Deshpande PB (2010) Development and validation of high performance thin layer chromatographic method for estimation of brimonidine tartrate as bulk drug and in ophthalmic solutions. International Journal of ChemTech Research 2(3): 1376-1379.
-
Tzovolou DN, Lamari F, Mela EK, Gartaganis SP, Karamanos NK (2000) Capillary electrophoretic analysis of brimonidine in aqueous humor of the eye and blood sera and relation of its levels with intraocular pressure. Biomedical Chromatography 14(5): 301-305.
-
Acheampong A, Tang-Liu DS (1995) Measurement of brimonidine concentrations in human plasma by a highly sensitive gas chromatography/mass spectrometric assay. Journal of Pharmaceutical and Biomedical Analysis 13(8): 995-1002.
-
Du J, Quan J, Wan Y (2012) Chemiluminescence determination of timolol maleate by gold nanoparticles-catalyzed luminol-N- bromosuccinimide system. Talanta 90(15): 117- 122.
-
Ramadan NK, Zaazaa HE (2007) Membrane electrodes for determination of some ß-blocker drugs. Journal of AOAC International 90(4): 987- 994.
-
Mohamed S Rizk, Hanan A Merey, Shereen M Tawakkol, Mona N Sweilam (2014) Simultaneous Determination of Timolol maleate and Brimonidine tartarate in their Pharmaceutical Dosage Form. Analytical Chemistry Letters 4(2): 132-145.
-
Büker E and Dinç E (2016) A New UPLC Method with Chemometric Design–Optimization Approach for the Simultaneous Quantitation of Brimonidine Tartrate and Timolol Maleate in an Eye Drop Preparation. Journal of Chromatographic Science 55(2): 154-161.
- Effects of 5-HTP and Melatonin on the Sleep Cycle of Medical Students
- Adsorption of Bisphenol A on NH4OH- Modified Rice Husk and Sugar Cane Bagasse Biochar
- Comparative Assessment of the Reinforcement Efficiency of Palm Fruit Fibre and Coconut Fibre in High Density Polyethylene (HDPE) Matrix Composite
- Importance of Bio Compounds Naturally Present in Food with Functionality in Animal Metabolism
- Sub-Acute Study on the Cardiotoxic Effects of Monosodium Glutamate Ingestion in Albino Rat
- Weight Management and Its Natural Solutions: A Review