The Imaging of Myocardial Scars on MRI: The Role of a Radiologist
Objectives: To investigate differences in tissue characteristics between UMI and recognized myocardial infarction (RMI) scars, by assessing the signal intensity (SI) detected by DE-MRI. Material and Methods: A randomized subgroup of 259 subjects from the Prospective Investigation of the Vasculature of Uppsala Seniors (PIVUS) study was submitted to cardiac magnetic resonance imaging (MRI). DE-MRI-detected myocardial scars were divided in two groups, UMI and RMI, according to the hospital medical records. The scars detected by DE-MRI were analyzed by measuring SI ratio of scar tissue to normal myocardium. Results: The mean SI ratio in the UMI group (4.593.0, mean9SD) was lower than in the RMI group 8.995.1 (P-value0.001). This difference was still significant (PB0.0001) after adjustment for gender, body mass index, time of image acquisition after gadolinium administration, scar transmurality, or total myocardial infarction mass. Conclusion: The difference in the SI ratio of the scars between the two groups most likely reflects a different contrast distribution volume of the tissues, which might indicate that UMI and RMI tissues diverge in tissue composition.
Introduction
Myocardial infarction (MI) is defined as necrosis of myocytes caused by ischemia and is divided into five types according to the new definition of MI by the Joint ESC/ACCF/ AHA/WHF Task Force [1]. Clinically, MI is classified as type I if related to a primary coronary event, as type II if due to increased oxygen demand or decreased supply, type III if there is sudden unexpected cardiac death, and type IV and V are related to coronary interventional procedures. Delayed- enhanced magnetic resonance imaging (DE-MRI) has proven, since the studies from KIM [2], to be a valuable and accurate diagnostic tool to detect MI [3].
Although the relationship of DE-MRI to the underlying pathophysiology is not completely elucidated, it is thought that delayed-enhancement of MI scars is due to an increased extracellular space, allowing a larger distribution volume for the extracellular contrast agent [4]. The contrast distribution volume within a tissue has a direct correlation with the longitudinal relaxation rate [5]. The higher the contrast concentration, the shorter the longitudinal relaxation time of the tissue will be. As a result, different tissues with different contrast distribution volumes will also have different T1.
After contrast injection, the T1 values in normal and infarcted myocardium tissues are distinct. This divergence allows, with a non-selective 1808 inversion pulse and an adequate inversion time, nulling the signal of normal myocardium before image acquisition [6].
Different prevalence of unrecognized myocardial infarctions (UMIs) have been published in epidemiologic studies [7]. Traditionally, UMIs are defined as the appearance, in a non-acute setting, of a new diagnostic Q wave. In a meta- analysis done by AMMAR et al., the occurrence of UMI as a proportion of all infarctions varied from 4 to 44% [8]. The main reasons found for this high variation were the different ECG criteria used in the different studies and the lack of a gold standard for the diagnosis of UMI. In the 70-year-old population in the Prospective Investigation of the Vasculature of Uppsala Seniors (PIVUS) study, there was a prevalence of MI scars detected by DE-MRI of 24.2%, in which UMI represented 80% of those [9].
The aim of this study was to explore differences in tissue characteristics between the previously found UMIs and recognized myocardial infarctions (RMIs) [9], by further assessing the signal intensity (SI) at DE-MRI.
Material and Method
Study Population
After approval from the local ethical committee, 259 unselected subjects from the PIVUS population [10] were consecutively invited to additionally undergo cardiac magnetic resonance imaging (MRI) directly after whole- body magnetic resonance angiography (MRA). All the participants in the PIVUS study answered a questionnaire about their medical and drug histories. Furthermore, medical records from Uppsala University Hospital were searched retrospectively for cardiovascular diagnosis. Eleven cardiac MRI examinations were excluded because of poor quality, leaving a study population of 248 subjects (49.6% women).
| Women gender | 49.6 |
| Body mass index kg/m2,mean (SD) | 26.9(4.0) |
| Hypertension, % | 73 |
| Hypercholesterolemia, % | 54.4 |
| Serum triglycerides, mmol/L, mean (SD) | 1.3(0.65) |
| Diabetes, % | 12.5 |
| Current smoking % | 7.7 |
Table 1: Back ground characteristics of the study population (n=248).
MI scars were found in 60 subjects (24.2%), in whom 49 were UMIs (19.8%) (9). In the UMI group, 45% (n22 of 49) of the subjects were women, while in the RMI group women corresponded to 18% (n2 of 11). The mean age in this population, at the time of image acquisition, was 71 years and 6 months. The background characteristics of the study population are summarized in Table 1.
Imaging Procedure
Imaging was performed using a 1.5T MRI scanner (Gyro scan Intera; Philips Medical Systems, Best, The Netherlands) with a 25 mT/m gradient system. Whole-body MRA was first performed after injection of 40 ml of Gd-DTPA-BMA. Cardiac MRI was then performed using a five-element phased array cardiac coil (Philips Medical Systems, Best, The Netherlands) with the patient in the supine position. Images were acquired in end-diastole, during breath holding in expiration, and using vector electro cardiography for retrospective gating. Survey scans were followed by delayed-enhancement images using a 3D inversion recovery gradient-echo sequence covering the entire heart in the short and three long-axis views (2, 3, and 4-chamber views).
The mean post-contrast time was 33.7 min (maximum 64 min). The imaging parameters were as follows: TR and TE shortest (4.0 and 1.2, respectively), flip angle 158, inversion time adjusted individually to null normal myocardium (range 170-275 ms), gating factor 1, slice thickness 10 mm with a 5 mm overlap and an in-plane resolution of 1.56-2.81 mm.
Image Analysis
SI analysis was performed on a workstation (Philips Medical Systems Nederland, Best, The Netherlands) using the commercially available software (View Forum R 4.1 V1L2). Nulled myocardium by the inversion pulse was considered viable and assumed to represent normal myocardium tissue.
For each individual, the short axis slice with the biggest brightest area of delayed enhancement was chosen as the most representative of the infarct (Figures 1A & 2A). SI analysis was performed in this slice. In two subjects, the delayed enhancement was located in the left ventricle apex and, although seen in the two different projections, it was difficult to delineate the delayed-enhancement area in the short-axis view. For this reason, these two subjects were not included in the final analysis.
A region of interest (ROI) was drawn delineating the scar area in the chosen short-axis slice. A ROI was also drawn to delineate the normal myocardium (Figures 1B & 2B). The ambition was to include as much normal.
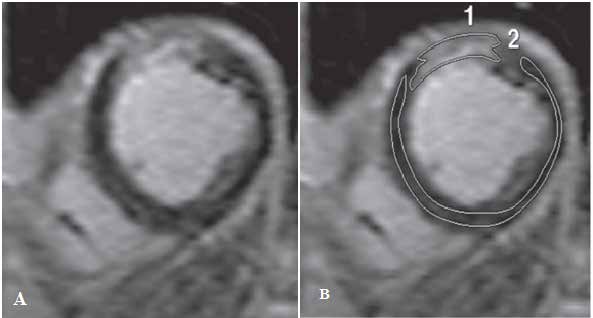
Figure 1: Example of an unrecognized myocardial infarction scar. (A) Delayed enhanced MRI in the short axis view showing delayed enhancement involving the subendocardial myocardium in the anterior wall of the left ventricle. (B) Signal intensity (SI) analysis of the myocardial scar. Two regions of interest (ROIs) were drawn to delineate the myocardial scar (ROI n.1) and the normal myocardium (ROI n.2). The scar has a total area of 1169.5 mm3 , corresponding to 4.38% of the total left ventricle mass, and has a SI ratio of 3.38.
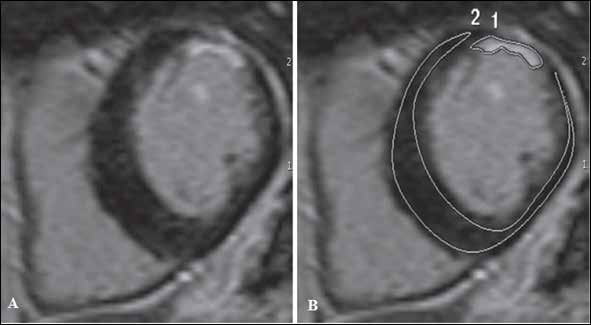
Figure 2: Example of a recognized myocardial infarction scar. (A) Delayed enhanced MRI in the short axis view showing delayed enhancement involving the subendocardial myocardium in the anterior wall of the left ventricle. (B) Signal intensity (SI) analysis of the myocardial scar. Two regions of interest (ROIs) were drawn to delineate the myocardial scar (ROI n.1) and the normal myocardium (ROI n.2). The scar has a total area of 2781.2 mm3, corresponding to 7.67% of the total left ventricle mass, and has a SI ratio of 7.58.
Myocardium as possible, free of artifacts and without partial volumes effects. When necessary, two separate ROIs were drawn in the normal myocardium, in order to exclude those possible confounding areas.
For each ROI, the mean SI was calculated with the computer-assisted software. Since no useful values of background noise could be measured in the used images, a SI ratio was calculated as the ratio between the mean SI in scar tissue and the mean SI in normal myocardium.
The inversion time chosen to null normal myocardium
was also registered. Scar transmurality was visually assessed and classified in four different groups, according to the partial extent of delayed-enhancement across the left ventricle myocardial wall. Groups were divided in scar transmurality from 1-25%, 26-50%, 51- 75%, and 76-100%. Total MI mass was calculated assuming a myocardial density of 1.05g/ml [11].
Statistical Methods
Statistical software, version 8.0 (StatSoft Inc., Tulsa, Okla., USA) was used for statistical analyses. A paired t test was used to test differences between the SI in the MI scars and the SI in the normal myocardium. Inversion times were compared between the UMI, RMI, and normal subjects groups using the Kruskal-Wallis test. MI scars SI ratio was compared between the two groups using a Mann Whitney test. A multiple regression analysis was done to test the influence of the variables gender, body mass index (BMI), time of image acquisition after gadolinium injection, scar transmurality, total myocardial infarction scar mass and myocardial infarction group (UMI/RMI), on the SI ratio. Statistical significance was set up at P50.05.
Results
In both groups, the mean SI of the scars was different from the mean SI of the normal myocardium (UMI group, P-valueB0.0001; RMI group, P-value 0.0003). The inversion time chosen to null viable myocardium did not differ between the UMI, RMI, and normal subjects groups (P-value 0.3852). The mean SI ratio in the UMI group (4.593.0, mean 9SD) was lower than in the RMI group (8.995.1) (P-value 0.001) (Figure 3).
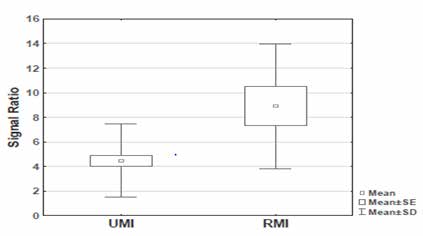
This difference was still significant (PB0.0001) after adjustment for gender, BMI, time of image acquisition after gadolinium injection, scar transmurality or total MI scar mass (Table 2). The result was the same if weight was used instead of BMI. An example of an UMI scar and a RMI scar are shown in Figsures 1 and 2, respectively.
| P-value | |
|---|---|
| Gender | 0.7790 |
| BMI | 0.3183 |
| Gadolinium time (min) | 0.4612 |
| Transmurality | 0.951 |
| Total myocardial infraction scar mass (g) | 0.2611 |
| Myocardial infraction group (UMI/RMI) | <0.0001 |
Table 2: Multiple regression model with signal intensity ratio as the dependent variable and gender, BMI, time of image acquisiti
Discussion
The present study demonstrates that the UMIs found in the PIVUS population have a different behavior from RMIs in DE-MRI, as was elucidated by the difference in SI ratio between the two groups. The SI ratio represents the mean scar tissue SI normalized to the mean SI of normal myocardium. One possible explanation for the difference in SI ratio could be based on potential partial volumes effects in the UMIs, since some of them were small. The 3D acquisition chosen to cover the whole left ventricle was comparable to the sequence used on similar machines resulting in a slice thickness of 10 mm [12]. The used slice thickness could possibly introduce partial volume effects that could be responsible for the decreased SI in the scar area in the UMI group.
In this study, scar tissue volume was not found to have any influence on the SI ratio. The result was the same when relating the SI ratio to gender, BMI, time after gadolinium injection, and scar transmurality. The only parameter that was significant in predicting the SI ratio was whether it was an UMI scar or a RMI scar. A second explanation for the disparity in SI ratio could be that the two groups would primarily diverge in the SI of the normal myocardium, which was used as a reference to normalize the SI of the infarction area. Due to the study protocol, it was not possible to scan the myocardium prior to contrast injection. Therefore, it was not possible to test the underlying assumption of comparable relaxation rates, of normal and infarcted myocardium, prior to contrast injection. Nevertheless, the SI of the normal myocardium was normalized by different inversion times after the inversion pulse. Differences in normal myocardium could be detected by variation in the inversion times used in the different groups.
For this reason, the inversion times were compared and no difference was found between the groups. Having excluded these possible confounding factors, the reason for the result is likely to originate in the scar. The variable likely to explain the differences in SI is different amount of contrast agent in the scar tissues and, consequently, different contrast distribution volumes in the scar tissues. This study aimed to do an ad hoc analysis to investigate whether the UMI scars previously defined had the same SI as the RMI scars in DE-MRI, in order to further explore differences between these groups. Previous epidemiological studies reveal that subjects with UMI have a similar mortality rate as the ones with RMI [13, 14]. In these studies, UMI diagnosis is based on ECG criteria and there is a lack of consensus in the definition of ECG-detected UMI. Nowadays, high resolution DE-MRI provides a more sensitive method to detect MI scars [15], some of which are small, such as the UMIs detected in our PIVUS study, with a mean volume of 1.9% of the total left ventricle mass [9]. Some of these scars might not have the sufficient extent of necrosis to produce a significant Q wave on ECG [16] and, therefore, their long-term cardiovascular risk has never been evaluated in a population-based study. However, some studies indicate that small myocardial scars detected by DE-MRI have an important prognostic value in the patients’ outcome. Kwong et al. report a seven- fold increased risk of major adverse cardiac events in patients with clinical suspicion of coronary artery disease and without a previously known MI, who had a small (mean 1.4% of left ventricle mass) MI scars detected by DE-MRI [17]. The present study had some drawbacks. The contrast dose was not individually adapted, since cardiac-MRI was performed after whole-body MRA, leading to a higher dose of contrast than it is recommended for DE-MRI [6, 12].
This implies that imaging acquisition should be even more delayed to allow contrast wash-out from the left ventricle cavity and to allow a better identification and delineation of small subendocardial scars. A second drawback was that the timing of imaging acquisition after the contrast injection was not ideal. It has been established that the best timing for DE MRI is between 25 and 30 min [12], while normally a scan delay of 10 min is clinically used [6]. The interval time in our study was 25 to 64 min. There was only one subject scanned at 64 min and, in that subject, there was an obvious enhancement. Excluding this subject, the interval time of imaging acquisition was between 25 and 45 min. To some extent, the longer waiting time might have compensated for the higher used dose. Additionally, these problems were compensated by individually adjusting the inversion time [12].
It is also known that the MI scars evolve over time, with infarction resorption occurring mainly in the first 8 weeks after coronary artery occlusion [18]. In this study, the age and evolution of the MI scars are not known. Nevertheless, most of them are likely to be chronic, since if several were acute or sub acute they would have occurred in a short time span, which is unlikely. This means that the scars are most probably old and that at the time of the study they were likely to be stable in terms of evolvement.
Conclusion
In conclusion, this is the first study to compare SI characteristics of UMIs and RMIs detected by DEMRI. The difference found in SI ratio between these two groups most likely reflects different contrast distribution volume of the tissues, which might indicate that UMI and RMI tissues diverge in composition.
References
-
Thygesen K, Alpert JS, White HD, Jaffe AS, Apple FS, et al. (2007) Universal definition of myocardial infarction. Circulation (116): 2634 2653.
-
Kim RJ, Fieno DS, Parrish TB, Harris K, Chen EL, et al. (1999) Relationship of MRI delayed contrast enhancement to irreversible injury, infarct age and contractile function Circulation 100(19): 1992-2002.
-
Amado LC, Gerber BL, Gupta SN, Rettmann DW, Szarf G, et al. (2004) Accurate and objective infarct sizing by contrast enhanced magnetic resonance imaging in a canine myocardial infarction model. Jam Coll Cardiol 44(12): 2383-2389.
-
Kim RJ, Chen EL, Lima JA, Judd RM (1996) Myocardial GdDTPA kinetics determine MRI contrast enhancement and reflect the extent and severity of myocardial injury after a cute reperfused infarction. Circulation 94(12): 3318 26.
-
Caravan P, Lauffer RB (2006) Contrast agents: basic principles. In: Edelman RR, Hesselink JR, Zlatkin MB, Crues JV II, editor. Clinical magnetic resonance imaging. 3rd (Edn.), Philadelphia PA: Saunders Elsevier. Pp: 361- 363.
-
Kim RJ, Shah DJ, Judd RM (2003) How we perform delayed enhancement imaging. J Cardiovasc Magn Reson (5): 505 514.
-
Moon JC, McKenna WJ, Mc Crohon JA, Elliott PM, Smith GC, et al. (2003) Toward clinical risk assessment in hypertrophic cardiomyopathy with gadolinium cardiovascular magnetic resonance. J Am Coll Cardiol 41(9): 1561-1567.
-
Ammar KA, Kors JA, Yawn BP, Rodeheffer RJ (2004) Defining unrecognized myocardial infarction: a call for standardized electrocardiographic diagnostic criteria. Am Heart J 148(2): 277-284.
-
Barbier CE, Bjerner T, Johansson L, Lind L, Ahlstrom H (2006) Myocardial scars more frequent than expected: magnetic resonance imaging detects potential risk group. J Am Coll Cardiol 48(4): 765-771.
-
Lind L, Fors N, Hall J, Marttala K, Stenborg A (2005) A comparison of three different methods to evaluate endothelium dependent vasodilation in the elderly: the Prospective Investigation of the Vasculature in Uppsala Seniors (PIVUS) study. Arterioscler Thromb Vasc Biol 25(11): 2368-2375.
-
Sandstede J, Lipke C, Beer M, Hofmann S, Pabst T, et al. (2000) Age and gender specific differences in left and right ventricular cardiac function and mass determined by cine magnetic resonance imaging. Eur Radiol 10(3): 438-442.
-
Grebe O, Paetsch I, Kestler HA, Herkommer B, Schnackenburg B, et al. (2003) Optimal acquisition parameters for contrast enhanced magnetic resonance imaging after chronic myocardial infarction. J Cardiovasc Magn Reson 5(4): 575-587.
-
Sheifer SE, Gersh BJ, Yanez ND, Ades PA, Burke GL, et al. (2000) Prevalence, predisposing factors, and prognosis of clinically unrecognized myocardial infarction in the elderly. J Am Coll Cardiol 35(1): 119-126.
-
Sigurdsson E, Thorgeirsson G, Sigvaldason H, Sigfusson N (1995) Unrecognized myocardial infarction: epidemiology, clinical characteristics, and the prognostic role of angina pectoris. The Reykjavik Study. Ann Intern Med 122(2): 96-102.
-
Wu E, Judd RM, Vargas JD, Klocke FJ, Bonow RO, et al. (2001) Visualisation of presence, location, and transmural extent of healed Q wave and non Q wave myocardial infarction. Lancet 357: 21-28.
-
Kaandorp TA, Bax JJ, Lamb HJ, Viergever EP, Boersma E, et al. (2005) Which parameters on magnetic resonance imaging determine Q waves on the electrocardiogram? Am J Cardiol 95(8): 925-929.
-
Kwong RY, Chan AK, Brown KA, Chan CW, Reynolds HG, et al. (2006) Impact of unrecognized myocardial scar detected by cardiac magnetic resonance imaging on event free survival in patients presenting with signs or symptoms of coronary artery disease. Circulation. 113(23): 2733-2743.
-
Fieno DS, Hillenbrand HB, Rehwald WG, Harris KR, Decker RS, et al. (2004) Infarct resorption, compensatory hypertrophy, and differing patterns of ventricular remodeling following myocardial infarctions of varying size. J Am Coll Cardiol 43(11): 2124-2131.
- Epidemiological Surveillance and Rumors on Social Media
- Awareness and Treatment of Uncontrolled Hypertension in US Overweight/Obese Youths Aged 16–24 Years, NHANES 2021–2023
- Strengthening EPI Through Parental Engagement: Lessons from Dhaka Slums for IA-2030
- Mothers Knowledge of the Prevalence, Causes, Effects, Prevention and Control of Diarrhoea among Children in Ife East Local Government Area, Ile Ife, Osun State, Nigeria
- Covid-19 Reinfections Case Series from October 2023 to October 2024 in A General Medicine Office in Toledo (Spain)
- Water Contact! One Risk Too Many: Risk Factors Associated with Schistosoma haematobium infection in Osun State, Nigeria