Status and Impact of COVID-19 Pandemic on Humans: Dynamics and Control
Background: The COVID-19 epidemic has spread very quickly. It only took 90 days to expand from Hubei to the rest of the world. Hence, we examined total cases based on the total tests in 211 Countries/Territories and effect of lockdown in India in terms of total cases and deaths as compared to Spain, USA, France and Italy to help policy maker and health experts to understand the epidemic of COVID-19 infectious disease in 211 Countries/Territories. Materials and Methods: All COVID-19 cases in 211 countries reported from 3rd March to April 07, 2020, were extracted from the World Health Organization report and worldometer website. These data sets were analyzed by using the exponential model and descriptive statistics on EXCEL-16 software to show the descriptive and exploratory analysis worldwide. Results: In the world, around 13% Countries/Territories reported 20 plus cases per 100 test and nearly 30% Countries/ Territories in the world didn’t report the total number of tests for COVID-19. Among 30%, China is at topmost in total cases. Out of 211 Countries/Territories, 148 Countries/Territories have reported a total number of tests for COVID-19. Out of 148 Countries/Territories, there were 10,408,272 tested, and 1,355,249 (13.0%) confirmed positive cases. The higher number of positive cases per 100 tests was reported in France (48.6) and San Marino (47.6). On the other hand, Vietnam, Nepal, Bhutan, Botswana, New Caledonia and Taiwan have reported around one positive case per 100 tests. Exponential rates in total cases were higher for India, Italy, USA, Spain and France than world during 03-10 March 2020. France and Italy have shown continually declined rate till 07 April 2020. Rates in total deaths were high in Spain during 03-10 March 2020 as compared to India, Italy, USA, and France and it has shown continually declined trend till 07 April 2020. In the USA, the rate in total cases and deaths was higher during 19-27 March 2020 as compared to India, Italy, and France. Conclusion: Rates in positive cases and deaths due to COVID-19 is decreasing; it may be due to lockdown, which is not a permanent solution to eradicate it. Hence, there is need for proper inspection at the community level, especially at hot spot areas. This study also suggests that an appropriate recording system of total number of tests and death for helping policymakers and health experts.
Introduction
The earliest symptom of the onset of COVID-19 was confirmed in December 2019 [1]. At first, the morbidity remained low but reached a tipping point in the middle of January 2020. During the second half of January month, a remarkable increase of infected patients in affected cities occurred outside Hubei province because of the population movement before lunar Chinese New Year [2]. The outbreak was started with exponential spread to the other countries by January 23, 2020, attracting extensive attention around the world. Evidence of clusters of infected family members and medical workers confirmed the presence of human- to-human transmission [3] by droplets, contact and fomite [4, 5]. Though, the current estimates of the median incubation period of COVID-19 are three days (range 0 to 24 days), with the potential asymptomatic transmission [6, 7]. At the end of January 2020, WHO confirmed more than ten thousand cases infected with COVID-19 across China [8] (30). As of February 19, 2020, this rose to a total of 74280 confirmed cases in China and 924 confirmed cases in 24 countries outside China, and a total of 2009 deaths globally [9].
The annual assembly of the Christian Open Door Church between 17 and 24 February in Mulhouse is the one key event attended by about 2,500 people, at least half of whom were believed to exposed to the infections in France [10, 11]. To control COVID-19, effective prevention and control measurements must include early detection, diagnosis, treatment, and quarantine to block human- to-human transmission as well as reducing secondary infections among close contacts and health care workers. The COVID-19 epidemic has spread very quickly globally. It took around 90 days to expand from Hubei to the rest of the world. Hence, we examined total cases based on the total tests in 211 Countries/Territories and effect of lockdown in India in terms of total cases and deaths as compared to Spain, USA, France and Italy to help policy maker and health experts to understand the epidemic of COVID-19 infectious disease in 211 Countries/Territories
Materials and Methods
The study has used the COVID-19 data from Worldometer [12], which is running by an international team of developers, researchers, and volunteers with the goal of making world statistics available in a thought-provoking and time relevant format to a wide audience around the world. It is published by a small and independent digital media company based in the United States. Worldometer data have no political, governmental, or corporate affiliation. For the COVID-19 data, Worldometer collected data from official reports, directly from Government’s communication channels or indirectly, through local media sources when deemed reliable. Worldometer provides the source of each data update in the ‘Latest Updates News’ section. Timely updates for users around the world and to the dedication of a team of analysts and researchers who validate data from an ever-growing list of over 5,000 sources.
The study included COVID-19 data on the total number for tests, positive, deaths and recovered for 211 Countries/ Territories on 07th April 2020. Selected Countries/ Territories demographic information was extracted from the Worldometer [12]. We have used the exponential rate to estimate the rates in total cases and deaths, and it’s changed from 3rd March to 7th April 2020. Data were extracted from Worldometer to Microsoft Excel 2016 for performing the statistical analysis.
Results
Outcome of COVID-19 tests
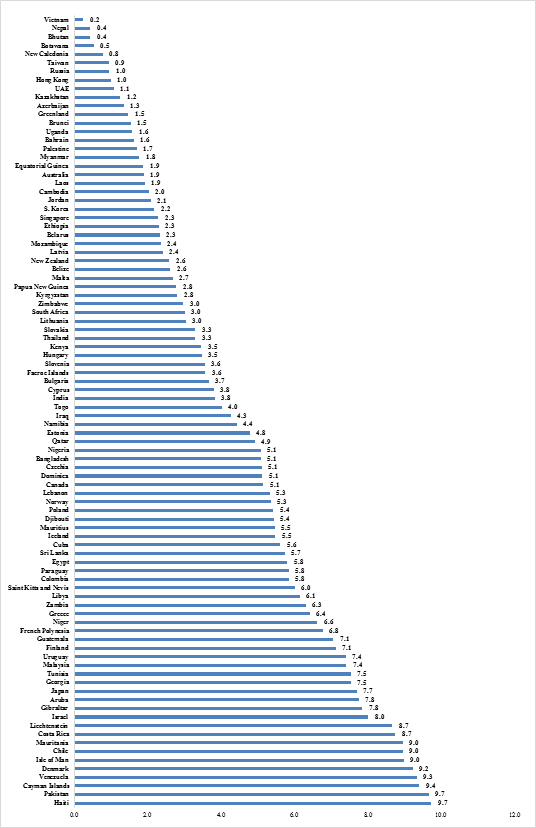
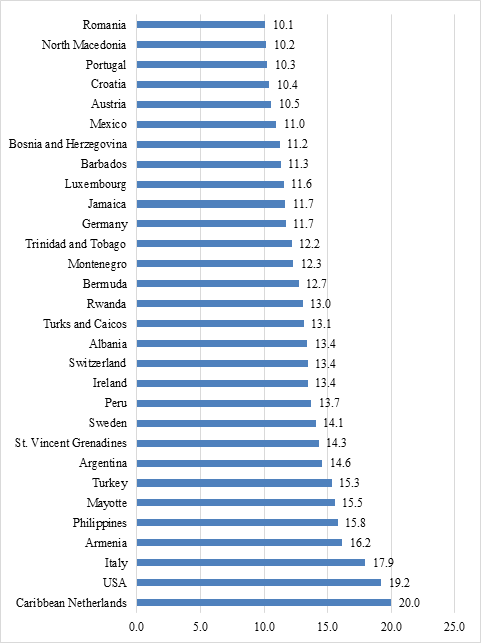
Table 1 depicts COVID-19 number of positive cases per 100 tests, which was assessed on 07 April 2020. Till this date, COVID-19 spread in around 211 Countries/Territories. Out of 211 countries, approximately 43% countries/ Territories have ten or a smaller number of positive cases at per 100 tests, about 13% (27) Countries/ Territories had more than 20 cases at per 100 tests. Nearly 30% (63) countries/ Territories were missing number of tests, i.e. didn’t report the total number of tests for COVID-19. Less than one positive case per 100 tests was seen in around six Countries, namely Vietnam, Nepal, Bhutan, Botswana, New Caledonia and Taiwan (Figure 1). Around 14.2% of the Countries/ Territories have reported 11-20 cases per 100 tests (Figure 2). Table 2 demonstrated 63 Countries/ Territories that didn’t report test information for COVID-19. Among these COVID-19 affected countries/ territories, China is at the topmost in total cases as compared to other Countries/ Territories and followed by Saudi, Arabia, Kuwait, Diamond, Princess, Cameroon and Uzbekistan.
| ‘+’ Cases (per 100 tests) | Frequency | Percent |
|---|---|---|
| ≤10.0 | 91 | 43.1 |
| 11-20 | 30 | 14.2 |
| 20+ | 27 | 12.8 |
| Missing | 63 | 29.9 |
| Total | 211 | 100 |
Table 1: Distribution of Countries/ Territories by positive Cases (/100 tests). Source: https://www.worldometers.info/coronavirus
| Countries/ Territories | TC | TD | TR | AC | S | Countries/ Territories | TC | TD | TR | AC | S |
|---|---|---|---|---|---|---|---|---|---|---|---|
| China | 81802 | 3333 | 77279 | 1190 | 189 | Syria | 19 | 2 | 3 | 14 | |
| Saudi Arabia | 2795 | 41 | 615 | 2139 | 41 | Maldives | 19 | 13 | 6 | ||
| Kuwait | 855 | 1 | 111 | 743 | 21 | Angola | 17 | 2 | 2 | 13 | |
| Diamond Princess | 712 | 11 | 619 | 82 | 10 | Mongolia | 16 | 4 | 12 | ||
| Cameroon | 685 | 9 | 60 | 616 | Fiji | 15 | 15 | ||||
| Uzbekistan | 534 | 3 | 30 | 501 | 8 | Liberia | 14 | 3 | 3 | 8 | |
| Afghanistan | 423 | 14 | 18 | 391 | Sudan | 14 | 2 | 2 | 10 | ||
| Oman | 419 | 2 | 72 | 345 | 3 | Saint Lucia | 14 | 1 | 13 | ||
| Burkina Faso | 384 | 19 | 127 | 238 | Curaçao | 13 | 1 | 7 | 5 | ||
| Réunion | 358 | 40 | 318 | 4 | Seychelles | 11 | 11 | ||||
| Ivory Coast | 349 | 3 | 41 | 305 | Suriname | 10 | 1 | 3 | 6 | ||
| Honduras | 312 | 22 | 6 | 284 | 10 | Chad | 10 | 2 | 8 | ||
| Ghana | 287 | 5 | 31 | 251 | 2 | Eswatini | 10 | 4 | 6 | ||
| Senegal | 237 | 2 | 105 | 130 | 1 | MS Zaandam | 9 | 2 | 7 | ||
| DRC | 180 | 18 | 9 | 153 | Malawi | 8 | 1 | 7 | 1 | ||
| Martinique | 152 | 4 | 50 | 98 | 20 | CAR | 8 | 8 | |||
| Guinea | 144 | 5 | 139 | Somalia | 8 | 1 | 7 | ||||
| Guadeloupe | 139 | 7 | 31 | 101 | 14 | Cabo Verde | 7 | 1 | 1 | 5 | |
| El Salvador | 93 | 5 | 9 | 79 | 2 | Vatican City | 7 | 7 | |||
| Madagascar | 88 | 7 | 81 | 6 | Nicaragua | 6 | 1 | 5 | |||
| Monaco | 79 | 1 | 4 | 74 | 4 | St. Barth | 6 | 1 | 5 | ||
| French Guiana | 77 | 34 | 43 | 1 | Sierra Leone | 6 | 6 | ||||
| Mali | 56 | 5 | 12 | 39 | Gambia | 4 | 1 | 2 | 1 | ||
| Congo | 45 | 5 | 2 | 38 | Western Sahara | 4 | 4 | ||||
| Macao | 45 | 10 | 35 | 1 | Anguilla | 3 | 3 | ||||
| Bahamas | 36 | 6 | 5 | 25 | 1 | British Virgin Islands | 3 | 3 | |||
| Guinea-Bissau | 33 | 33 | Burundi | 3 | 3 | ||||||
| Saint Martin | 32 | 2 | 7 | 23 | 6 | Falkland Islands | 2 | 2 | |||
| Eritrea | 31 | 31 | South Sudan | 2 | 2 | ||||||
| Gabon | 30 | 1 | 1 | 28 | Saint Pierre Miquelon | 1 | 1 | ||||
| Benin | 26 | 1 | 5 | 20 | Timor-Leste | 1 | 1 | ||||
| Tanzania | 24 | 1 | 5 | 18 |
Table 2: Number of Countries/ Territories missing total tests for COVID-19 report, 07 April, 2020. Note: TC: Total Cases, TD: Tot
Countries/ Territories with High (20+) Cases per 100 Tests
Table 3 shown that variation in the top countries with higher cases per 100 tests. The number of positive (48.6 positives per 100 tests) cases was seen higher in France as compared to other countries. San Marino, Antigua and Barbud, Algeria, Dominican Republic and Spain were reported more than 40 positive cases per 100 tests. The high number of positive cases per 100 tests was seen in lowest densely place and high dense place. For instance, the lowest density was seen in Guyana (4 density) and highest was seen in Sint Maarten (1261 density). Further, top cases per 100 tests were seen in high and low Total Fertility Rate (TFR) countries. The countries having high fertility rate (FR= 4.4) in Sao Tome and Principe, and (FR=3.1) in Algeria has reported 21.2 and 43.7 positive cases per 100 tests. On the other hand, low Fertility Rate (FR) of 1.3 in Spain, Montserrat, and Moldova has reported 41.3, 25, and 20.7 7 positive cases per 100 tests. In San Marino, half of the population is in above the aged 47 years and, it has 97% population in urban areas, had reported around 48 positives per 100 tests.
| ‘+’ Cases (/100 tests) | Population 2020 | Density (P/Km²) | Land Area (Km²) | Migrants (net) | FR | MA | UP (%) | |
|---|---|---|---|---|---|---|---|---|
| France | 48.6 | 65,273,511 | 119 | 547557 | 36527 | 1.9 | 42 | 82 |
| San Marino | 47.6 | 33,931 | 566 | 60 | 0 | 1.5 | 47 | 97 |
| Antigua and Barbuda | 47.5 | 97,929 | 223 | 440 | 0 | 2 | 34 | 26 |
| Algeria | 43.7 | 43,851,044 | 18 | 2381740 | -10000 | 3.1 | 29 | 73 |
| Dominican Republic | 43.1 | 10,847,910 | 225 | 48320 | -30000 | 2.4 | 28 | 85 |
| Spain | 41.3 | 46754778 | 94 | 498800 | 40000 | 1.3 | 45 | 80 |
| Sint Maarten | 35.7 | 42,876 | 1261 | 34 | 0 | 2.2 | 41 | 96 |
| Bolivia | 35.5 | 11,673,021 | 11 | 1083300 | -9504 | 2.8 | 26 | 69 |
| Andorra | 32.6 | 77,265 | 164 | 470 | 0 | 1.4 | 44.9 | 88 |
| Iran | 31.9 | 83,992,949 | 52 | 1628550 | -55000 | 2.2 | 32 | 76 |
| Belgium | 29.1 | 11,589,623 | 383 | 30280 | 48000 | 1.7 | 42 | 98 |
| Channel Islands | 29 | 173,863 | 915 | 190 | 1351 | 1.5 | 43 | 30 |
| Ecuador | 27.7 | 17,643,054 | 71 | 248360 | 36400 | 2.4 | 28 | 63 |
| Grenada | 26.7 | 112,523 | 331 | 340 | -200 | 2.1 | 32 | 35 |
| Brazil | 25.6 | 212,559,417 | 25 | 8358140 | 21200 | 1.7 | 33 | 88 |
| Serbia | 25.4 | 8,737,371 | 100 | 87460 | 4000 | 1.5 | 42 | 56 |
| Guyana | 25 | 786,552 | 4 | 196850 | -6000 | 2.5 | 27 | 27 |
| Montserrat | 25 | 4,992 | 50 | 100 | 0 | 1.3 | 33.8 | 10 |
| Ukraine | 23.2 | 43,733,762 | 75 | 579320 | 10000 | 1.4 | 41 | 69 |
| Netherlands | 22.6 | 17,134,872 | 508 | 33720 | 16000 | 1.7 | 43 | 92 |
| Morocco | 22.2 | 36,910,560 | 83 | 446300 | -51419 | 2.4 | 30 | 64 |
| Panama | 21.8 | 4,314,767 | 58 | 74340 | 11200 | 2.5 | 30 | 68 |
| Sao Tome and Principe | 21.2 | 2,19,159 | 228 | 960 | -1,680 | 4.4 | 19 | 74 |
| United Kingdom | 20.7 | 67,886,011 | 281 | 241930 | 260650 | 1.8 | 40 | 83 |
| Moldova | 20.7 | 40,33,963 | 123 | 32,850 | -1,387 | 1.3 | 38 | 43 |
| Indonesia | 20.6 | 273,523,615 | 151 | 1811570 | -98955 | 2.3 | 30 | 56 |
Table 3: Countries/ Territories having 20+ cases per 100 tests along with their demographic profile. Note: FR – Fertility Rate, M
Rates in COVID-19 Pandemic
Rates in-between period 03 March to 07 April 2020 in total cases and total death of COVID-19 for the world and some selected countries have presented in Figures 3. Figure 3 shows that during 03-10 March 2020, the rate was seen higher in India, Italy, USA, Spain and France as compared to the world average. In India, Italy, USA, Spain and France, the growth rate was declined from 3-10 March 2020 to 11-18 March 2020, while in the world rate was increased during the same period, and it showed further increasing trend up to 19-27 March 2020. Also, the total number of COVID-19 cases start to slightly decline throughout the period from 19- 27 March 2020 to 05-07 April 2020. Italy, Spain and France have shown a decline in total cases from 3 March to 7 April 2020, and India and USA have shown at the initially declined, and during 19-27 March 2020 have increased and later again declined till 7 April 2020.
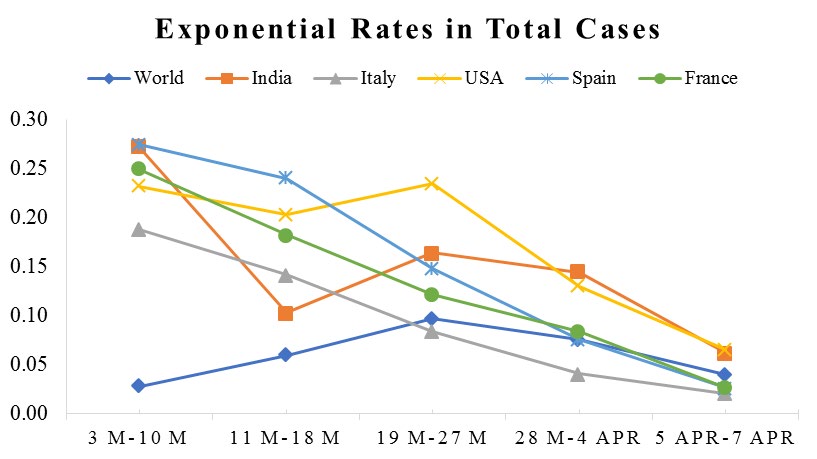
Figure 4 indicates comparison in deaths of rates among India, Italy, USA and France from 3rd March to 7th April 2020. It is shown that during 3-10 March 2020, death rates were higher in Spain as compared to India, Italy, the USA and France. Further, as compared to Spain, death rates were found higher in India, USA, France and Italy during 3-10 March 2020 to at the end of 19 March. On the other hand, exponential rates in total deaths were declined for Spain, Italy and France from 3 March to 7 April 2020. The death rate was rose for India from 3-10 March to 11-18 March 2020. However, in the USA, from 11-18 March to 19-27 March, death rates were increased and further; it starts to decline throughout the study period steadily.
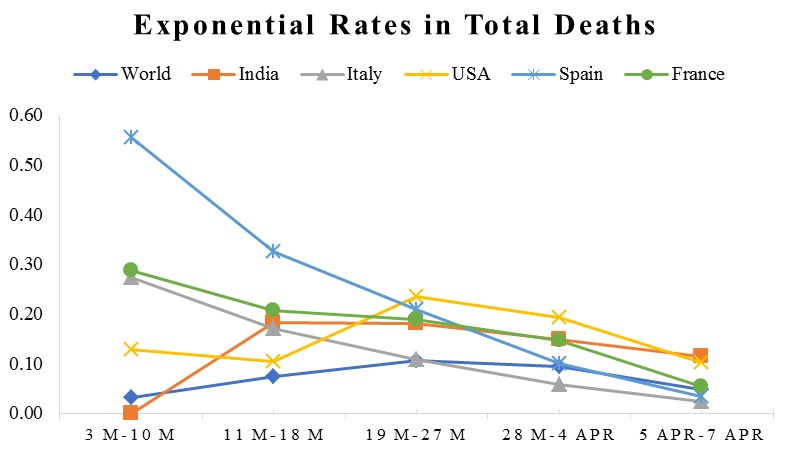
Figure 5 shows that trend in total positive cases from 3 March to 7 April 2020 in Spain, India, USA, France and Italy. After 3rd March, within 15 days there were not many differences in total positive cases (except India) among Spain, USA, France and Italy. The number of positive cases was increased after 15 days among Spain, USA, France and Italy but India has remained constant. Among Spain, India, France and Italy, the USA was the highest and sharp increased positive cases from 23 March 2020 to till 7 April 2020. On the other hand, Spain, USA, France and Italy shows fast increasing trends, but the increment of cases in India is still slow, while it is the second most populous country in the world.
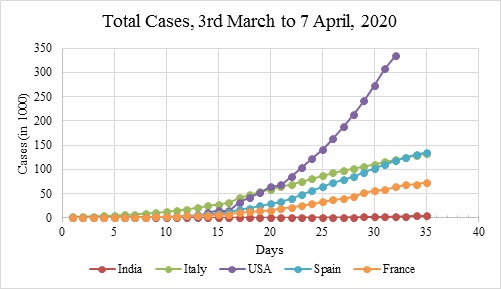
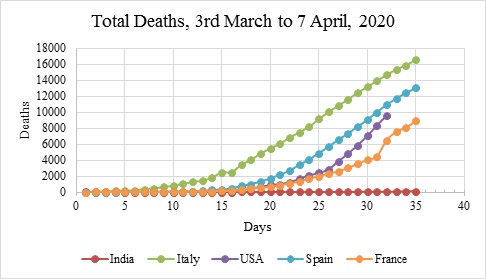
Figure 6 reveals total death from 3 March to 7 April 2020 in Spain, India, USA, France and Italy. After 3rd March, within 15 days, a negligible number of deaths were reported for Spain, India, USA and France but some more deaths were reported for Italy. After 18 March a sharp increase in mortality in Italy, Spain, USA, and France. We have also seen large variation in deaths in Spain, India, USA, France and Italy. On the other hand, deaths have remained at slow speed for India. In addition, deaths were found to be highest in Italy, followed by Spain and the USA throughout the study period.
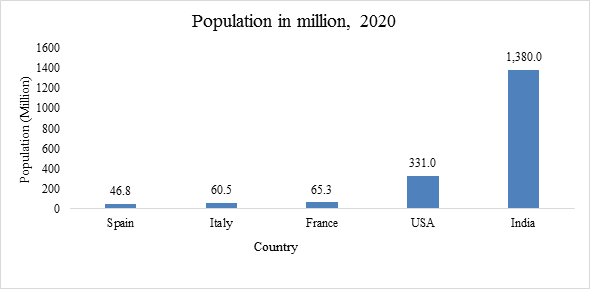
India is the second most populous country, which covered around 1380 million populations (Figure 7). Irrespective of population speed of COVID-19 infectious disease is very slow in India rather than others countries like Italy, Spain, USA, and France (Figure 5), while these countries are developed and around 50 years ahead of India in terms of medical health facility, infrastructure and so on.
Discussion and Conclusion
Unlike the diagnostic evaluation of COVID-19 infectious disease in the developed world like USA, Italy, Spain, etc., by and large, in developing and under-developing countries, diagnosis evaluation is weak. Due to this, there is a lack of actual information about a patient suffering from COVID-19 in developing and under-developing nations. Hence, the purpose of the present study is to highlight those countries/ territories, poor reporting system of COVID-19 at the community level. This study also tried to highlight rates of spread of COVID-19 infectious disease by applying the exponential model. Since contagion spreads through the structure of social contacts and it varies across the world. Moreover, it is necessary to resolve aspects of a population in any model that attempts to understand and predict how the modification of the social contact structure through social distancing impacts the spread of disease. This study used the exponential mathematical model to show a trend in rates of total cases and deaths for selected countries by using empirical case data published in the daily report of WHO. To assess the impact of social distancing, frequently hand wash, use of face masks measures in the spread of the COVID-19 epidemic in the world and some selected countries. Our principal goal is to measure the effect of lockdown in India in terms of total cases and deaths as compared to Spain, USA, France and Italy.
In India, lockdown with periodic relaxation reduced the number of cases and deaths. Our study also found that based on worldometer empirical country-wise data which published in the daily report, in the world there are 63 Countries/ Territories, who didn’t report the number of tests till 7 April 2020. Among these 63 Countries/ Territories, China, Saudi Arabia, Kuwait, Diamond Princess Uzbekistan and Cameroon had reported a higher number of cases. These countries didn’t put effort to report the total number of test daily/weekly, and it might be due busy with handling the COVID-19 cases along with other health care services. On the other hand, many countries are monitoring total everyday tests. For instance, USA has done more testing than all of these countries combined- France, South Korea, Japan, the United Kingdom, Singapore, Austria, Australia, Sweden, Canada and India [13]. In India out of total tests total positive cases was less (around four positives cases at per 100 tests) compared to USA, Italy, Spain, and France countries. It may be due to effect of lockdown and awareness or due to a smaller number of tests, but some force of lockdown and awareness there exists as India government has taken initiatives for controlling the pandemic on March 21, 2020. Some specialist has suggested, if not testing nearly enough to rule out community transmission, and if testing numbers are not consistent with the rest of the world, then that country needs to do better [14]. India has expanded the testing criteria in March 2020 and added some people who have travelled internationally in the last 14 days, contacts of confirmed cases, and symptomatic healthcare workers, patients with severe acute respiratory illness (who have fever and cough and/or shortness of breath) and people who have no symptoms but are in direct and high-risk contact with confirmed cases. India was also opened more testing centres, including some selected private labs.
This study has found more than 20 positive cases per 100 tests in 27 countries out of 211 Countries/ Territories. France is having a higher number of positive cases per 100 as compared to other study countries. It could be because of Christian Open Door Church event between 17 and 24 February in Mulhouse, which was attended by about 2,500 people, and half of them were suspected for the indication [11]. It indicated that France failed to manage and have taken preventive measure much late than other countries. For instance, France was not quarantined before 14 March entirely, but there are a few clusters of coronavirus COVID-19 (Oise, Haute-Savoie, Morbihan, Haut-Rhin, Corse du Sud, Aude and Calvados departments) were restricted for travel. On the other hand, Kindergartens, primary and secondary schools and universities are shut from 16 March 2020. On 14 March 2020, France entered the 3rd phase of the epidemic and the French Prime Minister has therefore ordered closing all places open to the public and that are not essential services (food shops, pharmacies, service stations, banks, press outlets and important public services [15].
Other findings show that the number of cases was high in the USA as compared to India, Italy, Spain and France till 07 April 2020. Mainly COVID-19 spared through respiratory dewdrops and acceleration of transmission population density play a significant role. For instance, the cumulative incidence in urban areas like New York and Washington, D.C exceeds the national average. In mid-February, Louisiana has experienced temporally high population density due to the Influx of visitors during Mardi Gras celebrations. All of the sudden cancelling mass gatherings (e.g., festivals, conferences, and sporting events) ware common in the United States and push the people into the double risk/ vulnerable [16]. We found that the high number of positive cases per 100 tests was seen in lowest densely place and high dense place. For instance, the lowest density was seen in Guyana (4 density) and highest was seen in Sint Maarten (1261 density). It indicates that scary situation everywhere and COVID-19 do not discriminate based on the socio- demography situation of the countries
Conclusion
In the world, around 43% of Countries/ Territories have reported less than 11 positive cases per 100 tests. However, 13% of Countries/ Territories reported 20 plus cases per 100 tests, and nearly 30% Countries/ Territories in the world didn’t report the total number of tests for COVID-19. Among 30 %, China is at topmost in total cases. Also, the overall number of positive cases per 100 tests was seen highest in France. It was also seen highest in most urbanized countries.
Rates in total deaths were declined in Spain, Italy and France from 3 March to 7 April 2020, but Italy was at the topmost in the total number of deaths. In the USA, from 11-18 March to 19-27 March, death rates were increased and further, it starts to decline throughout the study period steadily. It was also seen large variation in deaths among Italy, Spain, USA, France and India. Irrespective of population, speed of COVID-19 infectious disease is very slow in India rather than other countries like Italy, Spain, USA, and France. In contrast, these countries are developed and around 50 years ahead from India in terms of medical health facility and infrastructure. Hence, for minimizing the number of lockdown days, there is a need for proper inspection at the community level, especially at hot spot areas. This study also suggests that countries need for urgent action to strengthen the reporting system at the all level to help policymakers and health expert for addressing the COVID-19 infectious disease.
Ethics Approval and Consent to Participate
Not applicable.
Availability of Data and Materials
The datasets analysed during the current study is available through following links https://www.worldometers.info/ coronavirus/ and https://www.who.int/emergencies/ diseases/no vel-coronavirus-2019/situation-reports.
Competing Interests
The authors declare that they have no conflict of interest.
Funding
This work did not receive any funding.
References
-
Wuhan Municipal Health Commission.
-
Yang Y, Lu Q, Liu M, Wang Y, Zhang A, et al. (2020) Epidemiological and clinical features of the 2019 novel coronavirus outbreak in China. MedRxiv: 1-2.
-
Chan JFW, Yuan S, Kok KH, To KKW, Chu H, et al. (2020) A familial cluster of pneumonia associated with the 2019 novel coronavirus indicating person-to-person transmission: a study of a family cluster. The Lancet 395(10223): 1-10.
-
Chen H, Guo J, Wang C, Luo F, Yu X, et al. (2020) Clinical characteristics and intrauterine vertical transmission potential of COVID-19 infection in nine pregnant women: a retrospective review of medical records. The Lancet 395(10226): 809-815.
-
Zhou P, Yang X, Wang XG, Hu B, Zhang L, et al. (2020) A pneumonia outbreak associated with a new coronavirus of probable bat origin. Nature 579(7798): 270-273.
-
Guan W, Ni Z, Hu Y, Liang W, Ou C, et al. (2020) Clinical Characteristics of Coronavirus Disease 2019 in China. New England Journal of Medicine: 1-13.
-
Rothe C, Schunk M, Sothmann P, Bretzel G, Froeschl G, et al. (2020) Transmission of 2019-NCOV infection from an asymptomatic contact in Germany. New England Journal of Medicine 382: 970-971.
-
Organization WH (2020) Novel Coronavirus (2019- nCoV). Situation Report–22.
-
Situation Report-30.
-
How coronavirus started and what happens next, explained.
-
Franceinfo Surve “The majority of people were contaminated”: from Corsica to overseas, how the evangelical gathering of Mulhouse spread the coronavirus throughout France.
-
Worldometer, Coronavirus Cases. Worldometer 2020: 1-22.
-
US Covid-19 Tests more than India, 9 others combined: Donald Trump - The Economic Times.
-
States That Are Testing More Are Detecting More Cases.
-
coronavirus covid 19, Gouvernement.fr.
-
Bialek S, Bowen V, Chow N, Curns A, Gierke R, et al. (2020) Geographic Differences in COVID-19 Cases, Deaths, and Incidence — United States. MMWR Morbidity and Mortality Weekly Report 69(15): 465-471.
- Epidemiological Surveillance and Rumors on Social Media
- Awareness and Treatment of Uncontrolled Hypertension in US Overweight/Obese Youths Aged 16–24 Years, NHANES 2021–2023
- Strengthening EPI Through Parental Engagement: Lessons from Dhaka Slums for IA-2030
- Mothers Knowledge of the Prevalence, Causes, Effects, Prevention and Control of Diarrhoea among Children in Ife East Local Government Area, Ile Ife, Osun State, Nigeria
- Covid-19 Reinfections Case Series from October 2023 to October 2024 in A General Medicine Office in Toledo (Spain)
- Water Contact! One Risk Too Many: Risk Factors Associated with Schistosoma haematobium infection in Osun State, Nigeria