Monitoring Covid19 Situation at District Level
India is passing through Covid 19 pandemic. As on 09 August 2020, there were 2.22 millions of confirmed cases in the country. The present concept paper proposes the use of a composite tool in the name of ‘Covid19 Index’ to monitor the Covid 19 situation at district level. The Covid19 Index was formulated by pooling number of active cases, number of deaths, number of recovered cases, number of Covid tests done and population of the districts. For the purpose of exercise, five districts were selected and Covid19 Index was calculated in those districts on every third day for a continuous period of 43 days from 23 June 2020 to 04 August 2020. The results showed a varied picture among five districts from spectacular improvement of situation in one to very meager improvement and moderate improvement in other districts with or without consistency. It is found that, despite some limitations, this tool can be useful for Epidemiologists to monitor the Covid19 situation in district or any defined administrative area in developing countries.
Introduction
Current population of India is about 1.38 billion [1]. The country is divided into 28 states and 8 Union Territories (UTs) [2]. Each state and UT is further divided into different districts, which are the smallest administrative units. There are 739 districts in India at present [3]. India is passing through Covid19 pandemic. In respect of total number of confirmed cases India, with 2.22 million cases on 09 August 2020 [4], is at third position in the world after USA and Brazil [5]. India observed lockdown for 68 days in 4 phases between 25 March 2020 and 31 May 2020 [6]. Thereafter, graded restrictions and lockdown were imposed in different parts/ localities of the country as per local needs. As an example, Thane district of Maharashtra state was under additional lockdown from 2 July 2020 to 12 July 2020 [7]. The data of number of active cases, recovered cases and deaths in the country were available district wise concurrently. So, it was decided to look at situation in some districts over time.
Conceptual Paper
Objective
To monitor Covid19 situation in five districts from five states in India for continuous 43 days period from 23 June 2020 to 04 August 2020.
Monitoring Tool
Covid19 Index = [{No. of recovered cases / (No. of active cases + No. of deaths)} x No. tested per 1000 population] / District population in million.
Selection of Districts
One district with second highest number of reported cases, as on 23 June 2020, from each of five high case reporting states of India were selected for monitoring. The districts were Thane, Surat, Agra, Chengalpattu, and Jodhpur from the states of Maharashtra, Gujarat, UP, Tamil Nadu, and Rajasthan respectively.
Measurement Frequency
Covid19 Index of each district was calculated every third day between 7.00 PM and 7.30 PM from 23 June 2020 to 04 August 2020.
Cut Off Value
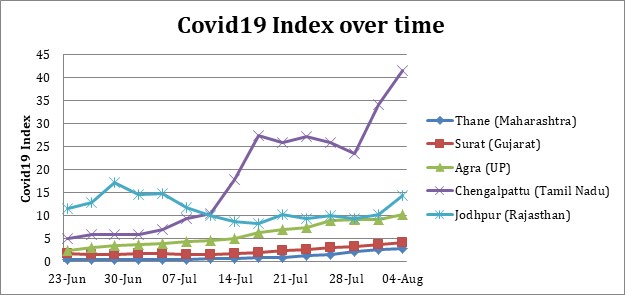
Covid19 Index of value of ≥20 was accepted as ‘Good’ situation for the reason that the best situation on first day of monitoring (23 June 2020) was in Jodhpur district with Covid19 Index of 11.53. This figure was doubled and rounded to 20 (Figure 1).
Categorization of Situation: Below ‘Good’ situation, the Covid19 Index value of the districts has been categorized further such as: district with Covid19 Index value up to <5 was labeled as ‘extremely bad’; 5 to <10 was called ‘very bad’; 10 to <15 was called ‘bad’, 15 to <20 was called ‘fair’ situations respectively.
Issue of Numerator and Denominator
Since this exercise did not attempt to measure any rate or ratio, but estimated a composite Index Value by pooling in five variables, issue of Numerator and Denominator was superfluous in the case. One can use the variables in any combination, but there won’t be any difference except in the change in ‘Cut off’ value of Covid19 Index.
Results
Interpretations: During the period of monitoring, Thane district remained in ‘extremely bad’ situation with very tiny but consistent improvement of Covid19 Index value from 0.36 to 2.85. Surat district also remained in ‘extremely bad’ situation, but the Covid19 Index value, after initial oscillation, showed tiny but steady improvement to 4.08. The Covid19 Index value consistently improved in tiny amount in Agra district from 2.41 and elevated the district from ‘extremely bad’ to ‘bad’ situation with Index value of 10.18 in the process. Chengalpattu district showed spectacular improvement of Covid19 Index value and elevated the district from ‘extremely bad’ to ‘good’ situation and maintained consistently ‘good’ situation for last 18 days. Jodhpur district did not show any consistency of Covid19 Index value which oscillated between ‘very bad’, ‘bad’ and ‘fair’ situation (Table 1).
| Thane (Maharashtra) | Surat (Gujarat) | Agra (UP) | Chengalpattu (Tamil Nadu) | Jodhpur (Rajasthan) | |
|---|---|---|---|---|---|
| 23-Jun | 0.36 | 1.77 | 2.41 | 4.9 | 11.53 |
| 26-Jun | 0.44 | 1.5 | 3.04 | 5.86 | 12.82 |
| 29-Jun | 0.47 | 1.62 | 3.53 | 5.86 | 17.17 |
| 2-Jul | 0.47 | 1.81 | 3.79 | 5.94 | 14.57 |
| 5-Jul | 0.49 | 1.8 | 3.88 | 6.92 | 14.88 |
| 8-Jul | 0.51 | 1.62 | 4.26 | 9.31 | 11.85 |
| 11-Jul | 0.68 | 1.6 | 4.46 | 10.48 | 10.06 |
| 14-Jul | 0.71 | 1.64 | 5.1 | 17.91 | 8.64 |
| 17-Jul | 0.89 | 1.9 | 6.34 | 27.38 | 8.34 |
| 20-Jul | 0.93 | 2.44 | 6.86 | 25.83 | 10.31 |
| 23-Jul | 1.27 | 2.67 | 7.43 | 27.13 | 9.28 |
| 26-Jul | 1.62 | 2.98 | 8.9 | 25.8 | 10.00 |
| 29-Jul | 2.11 | 3.24 | 9.1 | 23.49 | 9.46 |
| 1-Aug | 2.59 | 3.65 | 9.22 | 34.2 | 10.24 |
| 4-Aug | 2.85 | 4.08 | 10.18 | 41.53 | 14.35 |
Table 1: Calculated Covid19 Index value of five districts of India from 23 June 2020 to 04 August 2020.
Disclaimer: The results shown may not reflect exact picture. But those can give fair amount of idea about the trend of the disease in the five districts during continuous 43 days period under study.
Limitations
Covid19 test data of state have been used for respective district, as district data were readily not available always. Use of ‘district Covid test data’ would have improved upon the Covid19 Index value estimation. Districts with low number of reported cases (≤100) may give distorted picture, because of small data size. Where number of tests per 1000 population was > 25, it was restricted to 25 to avoid unnecessary high numerator value.
Utility
The proposed “Covid19 Index” can be useful for District Epidemiologists to monitor the current pandemic within districts or any defined administrative units from a ‘composite perspective’ by using number of ‘active cases’, ‘recovered cases’, ‘deaths’, and ‘laboratory tests’ within ‘standardized population’. This will also help in taking appropriate public health measures wherever required. The Index value will be useful for developing countries like India.
Source of the Data
The data used in this monitoring exercise were concurrently available in www.covid19india.org.
References
-
(2020) Population of India. Worldometer.
-
(2020) States and Capitals of India.
-
List of districts in India.
-
(2020) Total Covid 19 Cases in India 10 August.
-
https://covid19world.org/ on 10 August at 2105 hours of Indian Standard Time.
-
Covid-19 Pandemic Lockdown in India
-
(2020) Thane to Observe a 10-Day Lockdown in View Of COVID-19 Cases.
- Epidemiological Surveillance and Rumors on Social Media
- Awareness and Treatment of Uncontrolled Hypertension in US Overweight/Obese Youths Aged 16–24 Years, NHANES 2021–2023
- Strengthening EPI Through Parental Engagement: Lessons from Dhaka Slums for IA-2030
- Mothers Knowledge of the Prevalence, Causes, Effects, Prevention and Control of Diarrhoea among Children in Ife East Local Government Area, Ile Ife, Osun State, Nigeria
- Covid-19 Reinfections Case Series from October 2023 to October 2024 in A General Medicine Office in Toledo (Spain)
- Water Contact! One Risk Too Many: Risk Factors Associated with Schistosoma haematobium infection in Osun State, Nigeria