Prevalence of Some Opportunistic Infections among HIV Positive Women on HAART in Ogun State, Nigeria
Background: The hallmark of HIV infection is immunosuppression which predisposes to opportunistic infections (OIs), globally; OIs are major cause of morbidity and mortality in people living with HIV (PLWH). This present study examined the prevalence of some opportunistic infections among HIV positive women on HAART in Ogun State. Methods: A total of three hundred (300) blood samples were collected from HIV positive women (≥18years) on HAART attending Babcock University Teaching Hospital (BUTH), Ilishan-Remo, and General Hospital, Ijebu-Ode, Ogun state. Detection of Toxoplasma gondii (TOXO), Rubella virus (RV), Cytomegalovirus (CMV), Herpes Simplex Virus Type-1 and Type-2 (HSV-1 & 2) IgM antibodies in serum sample was carried out using a one-step five in one Bio-System Torch Test Panel Rapid Diagnostic Test (RDT) kit (TOXO, RV, CMV, HSV-1 & HSV-2 Torch IgM Combo Test kit) supplied by Bio systems Inc. Barcelona (Spain) according to the manufacturer instruction. Demographic and clinical information of the subjects were obtained using prepared questionnaires. Raw data were entered in Microsoft excel and statistical analysis was carried out using SPSS Statistics software package (Version 18.0), P-Values
Introduction
The impact of Human immunodeficiency virus (HIV) on societies is immense. Worldwide, an estimated 37.9 million people are living with HIV, 21.7 million people are accessing antiretroviral therapy, 1.8 million people became newly infected and 940,000 people have died from HIV- related illness in 2017 [1, 2]. Nigeria has the second largest HIV epidemic in the world and one of the highest new infection rates in Sub-Saharan Africa. Currently, about 1.9 million Nigerians (1.4%, ages 15-49 years) are living with HIV and about 33% are unaware of their HIV status. There are 130,000 new HIV infection cases in Nigeria, 53,000 AIDs-related deaths, 55% adults and 35% children are on antiretroviral therapy (ART), while 80% HIV positive patients on ART are virally suppressed [3]. Akwa Ibom has the highest prevalence rate of 5.6%, while Jigawa and Katsina have the lowest prevalence rate of 0.3% [4].
Heterosexual transmission remains the dominant mode of transmission and accounts for about 85% of all HIV infections. A defining feature of the pandemic in the current decade is the increasing burden of HIV infection in woman, which has additional implications for mother- to-child transmission. Women now make up about 42% of those infected worldwide. HIV can infect and eliminate helper T-cells (CD4). Therefore, the ability of immune system to kill bacteria, fungi, and viruses will be reduced due to elimination of these types of cells. The decreasing CD4 cell counts increase the susceptibility to many opportunistic infections [2].
Opportunistic infections (OIs) are infections that occur more frequently and are more severe in people with weakened immune systems, including people with HIV [5]. HIV-related OIs include pneumonia, candidiasis (thrush), toxoplasmosis, herpes and tuberculosis (TB) amongst several others [6, 7, 8]. OIs are common in HIV infected patients especially those who progress to acquired immune deficiency syndrome (AIDS). The progressive destruction of the immune system by chronic HIV infection leads to decrease of CD4 cell level. Many studies have shown that CD4 highly correlates with opportunistic infections, however, the pattern of which may vary according to geographical region. The differences in hospital facilities setting may also contribute to the different patterns of opportunistic infection [9, 10].
Toxoplasma gondii is an opportunistic intracellular protozoan. The parasite is carried by warm-blooded animals including cats, rodents, and birds and is excreted by these animals in their feces. Toxoplasma infection can be acquired congenitally or through ingestion or handling raw meat containing tissue cyst or consumption of water or food contaminated by sporulated oocysts in the faeces of infected cat [11]. Humans can become infected with it by inhaling dust or eating food [12]. It can result from direct contact with faeces of infected cat. Toxoplasma can also occur in commercial meats, especially red meats and pork, but rarely poultry. Infection with toxoplasmosis can occur in the lungs, retina of the eye, heart, pancreas, liver, colon, testes, and brain [11]. Some of the signs and symptoms include restlessness, fatigue, headache, excessive sweating, muscle and joint pains. Others include: microcephaly or hydrocephaly, abortion, still birth, ocular malformation (such as chorioretinitis), hepatosplenomegaly, lymphadenopathy and central nervous system abnormalities [13, 14].
Rubella virus, the causative agent of a German measles called rubella, is a cubical, medium-sized (60–70 nm), lipid- enveloped, ribonucleic acid virus with a positive-sense, single- stranded RNA genome. It is the only non-arthropod borne virus in the family Togaviridae [15]. The virus resides in the mucus present in the nose and throat of infected persons and therefore, it is spread to susceptible hosts by direct contact through droplet sprays during coughing and sneezing [16, 17, 18, 19]. The incubation period ranges from 14-21 days. A person with Rubella is contagious from approximately seven days prior to the onset of rash to seven days after the rash appears [20]. However, when a pregnant woman is infected with the disease, particularly during the first trimester, serious consequences, including birth defects, known as congenital rubella syndrome (CRS), can occur in the newborn. These defects can affect all of the body organs, including the eyes (cataracts and glaucoma), ears (sensorineural deafness), and heart (Patent ductus arteriosus). Also, infants with CRS who survive the neonatal period are highly vulnerable to developmental abnormalities and delays, including visual and hearing impairment, failure to thrive and autism [21].
Cytomegalovirus (CMV), on the other hand, is a double- stranded DNA virus in the herpesviridae family that can cause disseminated or localized end-organ disease in HIV-infected patients with advanced immunosuppression. It is also known as Human Herpesvirus-5 (HHV-5). It causes glandular fever, congenital infection, pneumonitis, hepatitis, as well as disseminated infection in AIDS and immunosuppressed individuals [6]. Its clinical manifestations range from asymptomatic forms (90% of cases) to severe fetal damage and, in rare cases, death due to abortion, but can be life- threatening for the immunocompromised, such as HIV- infected persons, organ transplant recipients, or newborn infants [22]. Transmission of Cytomegalovirus from infected individuals (adults and children) to others who are susceptible occurs through direct contact with bodily fluids, such as saliva, urine or semen, of someone who is actively shedding the virus. For women of reproductive age, the greatest risk for exposure is through contact with the urine or saliva of young children. Perinatal transmission can also occur through ingestion or aspiration of cervico-vaginal secretions at delivery or ingestion of breast milk post-delivery [23, 24, 25]. Estimates of the incidence of Cytomegalovirus disease vary considerably between geographical locations, but Cytomegalovirus causes significant suffering in HIV infected persons worldwide [26].
Furthermore; Herpes simplex virus (HSV), the causative agent of herpes, is a double stranded DNA virus 120-150 nm in size, belonging to the family Herpiviridae. The virus exists in two forms. The two types differ somewhat in their predilection site for causing lesions “above the waist” (HSV- 1) or “below the waist” (HSV-2). The virus is transmitted by contact of a susceptible person with an individual excreting the virus. HSV-1 infections are usually limited to the oropharynx, and the virus is spread by respiratory droplets or by direct contact with infected saliva especially during kissing, while HSV-2 is usually transmitted by genital routes [27]. HSV can cause painful cold sores (sometime called fever blisters) in or around the mouth, or painful ulcers on or around the genitals or anus. In most people with healthy immune systems, HSV is usually latent (inactive). However, stress, trauma, other infections, or suppression of the immune system, (such as by HIV), can reactivate the latent virus and symptoms can return. In people with severely damaged immune systems, HSV can also cause infection of the bronchus, pneumonia, and esophagitis [27, 28]. According to Ayoub HH, et al. [29], an estimated 19 million people are currently infected with HSV-2 globally. Prevalence is highest in Africa (31.5%) and Nigeria is not left out among the African countries bearing the scourge of HVS-2 infection. A higher proportion of those infected is found among female sex workers and among those infected with HIV (60 to 95%). The risk factors for HSV-2 infection are the same as for other sexually transmitted infections [30].
Generally, emergence of OIs is an indication of immunosuppression levels in the patients. It could also be a sensitive and specific indicator of a decrease in the number of CD4 cells, increased viral load and would show the onset of significant immune deficiency in people with HIV. Skin challenges and upper respiratory tract infections may develop after an initial asymptomatic phase; and these patients begin to lose weight. Frequent feverish conditions, fungal or other repeated bacterial infections, and tuberculosis (TB) may surface [31]. These infections are the leading cause of morbidity and mortality in HIV-infected patients and affect the quality of life [32]. The use of highly active antiretroviral therapy (HAART) has however, significantly reduced the incidence of opportunistic infections and progression to AIDS [33, 34].
Early diagnosis of opportunistic infections is very crucial to reducing the mortality and morbidity rates among HIV infected Patients. It can also prevent life threatening complications which may result in death. However, the frequency of occurrence of these opportunistic pathogens and associated risk factors among HIV infected adult female patients in Ogun State is not known. Scarcity of this information in this regard necessitates this study. The aim of this study is to determine the prevalence of some opportunistic infections and associated risk factors among HIV positive female adult patients attending Babcock University Teaching Hospital, Ilishan-Remo, Ogun state and State Hospital, Ijebu-Ode, Ogun State.
Materials and Methods
Study Area
The study was carried out among HIV infected patients attending Babcock University Teaching Hospital (BUTH), Ilishan-Remo, Ogun State and State Hospital, Ijebu-Ode, Ogun State. BUTH and State Hospital are both situated at South-Western Nigeria, coordinates: 6.8490O N, 3.6530O E and 6o48’47.8N, 3o55’30.2’E, respectively.
Duration of Study
This study lasted for a period of three months (September - November, 2020).
Study Design
This is an institutional-based prospective study research on the prevalence of Toxoplasmosis gondii (TOXO), Rubella virus (RV), Cytomegalovirus (CMV), Herpes Simplex virus type-1 and 2 (HSV-1 & 2) IgM antibodies among HIV positive women in Ogun State, Nigeria.
Sample Size Calculation
The sample size (n) was estimated using the single population proportion formula described by Charan J, et al. [35]: N = Z2PQ/d2 Where;
N = required sample size, Z = Standard normal variate at 5% (p<0.05) error or 95% confidence interval is 1.96 P = Proportion of HIV positive patients with opportunistic infections from previous study, Q = Proportion of HIV positive patients without opportunistic infections co-infection (1–P) and D = Absolute error margin is 0.05 For the calculation, a 95% confidence interval, a P value of 0.224, i.e., a prevalence rate of 22.4% from previous study by Iroezindu MO, et al. [36] and margin of error (d) set at 0.05 was used to determine the minimum sample size required. N = Z2PQ/d2 N = 1.962 X 0.224 X 0.776/0.052 N = 3.8416 X 0.224 X 0.776/0.0025 N = 0.6678/0.0025 N = 267.1 To minimize errors arising from the likelihood of non- compliance, 10% of the sample size was added giving a final sample size of 300. i.e, 10/100 X 267 = 26.7≈ 27 Final N was therefore 267 + 27 = 294 ≈ 300
Sample Size
A total of 300 serum samples were collected from consenting HIV infected female adult patients attending Babcock University Teaching Hospital, Ilishan-Remo, Ogun State and State Hospital, Ijebu-Ode, Ogun State.
Ethical Consideration
Ethical approval was sought for and obtained from the Babcock University Health Research Ethics Committee (BUHREC). Also, administrative clearance for this study was obtained from the management of Babcock University Teaching Hospital, Ilishan-Remo, Ogun State and Ogun State Hospital Management Board.
Eligibility of Subjects
Inclusion Criteria: Consenting HIV positive women in Ogun State Nigeria, with HIV status confirmed using, Determine HIV-1/2, Statpak HIV-1/2, and UniGold HIV-1/2 kits attending Babcock University Teaching Hospital, Ilishan- Remo, Ogun State and State Hospital, Ijebu-Ode, Ogun state, were randomly selected for this study. Exclusion Criteria: HAART-naïve HIV positive patients were excluded from the study. Consent: Informed consent was obtained from each participant before commencing the study. The purpose and nature of the study was properly explained to them and thereafter, the intended participants were requested to complete a consent form which they dully endorsed by a signature indicating their willingness to participate without any form of coercion.
Data Collection
Prior to the specimen collection, demographic and clinical information of the subjects was obtained using prepared questionnaires which was administered to the participants. Each questionnaire had a unique participant identification number (PIDN). Data collection lasted for an average of 14 days in the study location. This period was used for the selection of the subjects, distribution and retrieval of the questionnaires, and the collection of samples. The pre- test questionnaire was administered to the participants directly. Those who are not literate were assisted with translation before the questionnaires were completed. The first part of the questionnaires contained the bio data of the participants such as age, marital status, occupation and level of education. The second part includes clinical data relating to brief history suggestive of OIs. The study population was stratified by age, occupational, marital and educational status. All filled questionnaires were examined for completeness daily and stored securely in a locker. Data entries were done on the following day. For each participant, only the PIDN was recorded on the laboratory forms (no names) for the purpose of confidentiality. All the filled questionnaires were destroyed after data entry is completed.
Specimen Collection and Storage
Two (2) ml of venous blood sample was collected into plain bottles and was allowed to clot. Following blood clotting, the serum was separated and transferred into a new pre-labeled container using a Pasteur pipette by aspiration method. Sera were stored up at 2-8oC for up to three days if not processed immediately. The frozen specimens were properly thawed and mixed before testing commences. Multiple freeze-thaw cycles of the sera were avoided. Prior to testing, frozen specimens was brought to room temperature slowly and mixed gently. Specimens containing visible particulate matter were clarified by centrifugation before testing. Samples demonstrating gross lipidemia, gross hemolysis or turbidity were not used in order to avoid interference with result interpretation.
Laboratory Diagnosis
Detection of Toxoplasmosis gondii (TOXO), Rubella virus (RV), Cytomegalovirus (CMV), Herpes Simplex virus type-1 and 2 (HSV-1 & 2) IgM antibodies in serum sample of the HIV positive women was carried out using a using a one-step five in one Bio-System Torch Test Panel Rapid Diagnostic Test
(RDT) kit (TOXO, RV, CMV, HSV-1, HSV-2 Torch IgM Combo Test Kit) supplied by Biosystems Inc., Barcelona (Spain) according to the manufacturer instruction.
Interpretation of Results
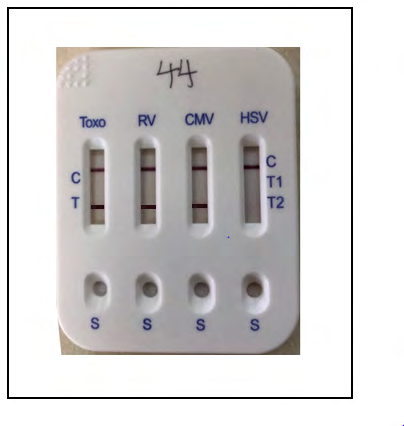
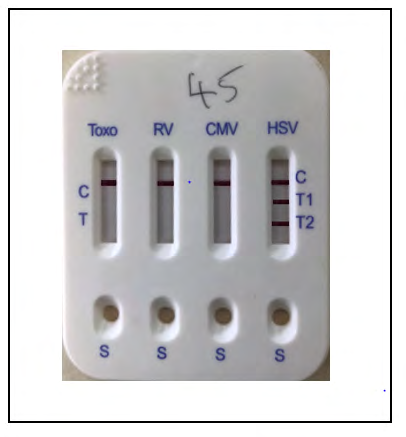
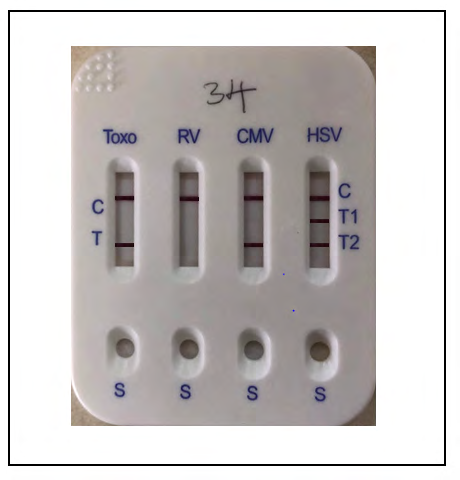
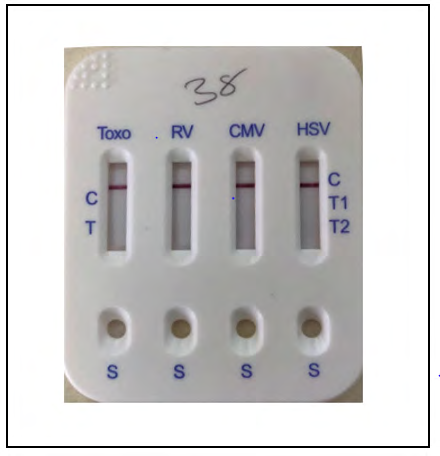
Positive Result: The presence of two color bands (“T” band and “C” band) within the result window regardless of which band appears first indicated a positive result for a particular test. Negative Result: The presence of only one pink color band at the control region within the result window indicated a negative result for a particular test. Invalid Result: If no control “C” line is developed, the assay is invalid regardless of the pink color in the test bands as indicated. A total absence of color in either regions or only one color band appearing on the test region indicates procedure error and/or the test reagent has deteriorated. If this occurs, the assay is repeated with a new device (Figures 1-4).
Disposal of Used Clinical Specimens and Test Kits
All samples collected and test devices used were treated as potentially infectious. They were autoclaved at 1210C, 15psi for fifteen minutes and properly discarded by incineration at the end of the screening exercise.
Data Analysis
Raw data were entered in Microsoft Excel. Statistical analysis was carried out using SPSS Statistics software package (version 18.0). One-way analysis of variance (ANOVA) and Turkey-Kramer Multiple Comparisons Test
was used to determine the significance of the prevalence of Toxoplasma gondii, Rubella virus, Cytomegalovirus and Herpes Virus Simplex Virus type -1 & 2 infection among HIV infected patients on HAART in Ogun State. P values <0.05 was considered to be significant.
Results
The present study investigated the prevalence of some opportunistic pathogens among HIV positive patients on HAART in Ogun State, Nigeria. The demographic characteristics of the study participants including age range, religion, tribe, educational status and marital status is presented in Table 1. Majority of the participants are within the age range of 18-25 years (33.7%), while the least were between >50 years (8.0%). 49.7% of the participant are singles, 12.3% of the participants are divorced, 22.0 % of the participant are married, 9.0% of the participant are separated, while 7.0% of the participant are widows.
| Characteristics | Category | Number (N) | Percentage (%) |
|---|---|---|---|
| Age range (Yrs) | 18-25 | 101 | 33.7 |
| 26-33 | 77 | 25.7 | |
| 34-41 | 60 | 20 | |
| 42-49 | 38 | 12.7 | |
| >50 | 24 | 8 | |
| Total | 300 | 100 | |
| Marital status | Divorced | 37 | 12.3 |
| Married | 66 | 22 | |
| Separated | 27 | 9 | |
| Single | 149 | 49.7 | |
| Widow | 21 | 7 | |
| Total | 300 | 100 | |
| Religion | Christianity | 177 | 59 |
| Islam | 90 | 30 | |
| Traditional | 4 | 1.3 | |
| Others | 29 | 9.7 | |
| Total | 300 | 100 | |
| Tribe | Hausa | 69 | 23 |
| Igbo | 81 | 27 | |
| others | 71 | 23.7 | |
| Yoruba | 79 | 26.3 | |
| Total | 300 | 100 | |
| Education Status | 56 | 18.7 | |
| Primary | 12 | 4 | |
| Secondary | 74 | 24.7 | |
| Tertiary | 158 | 52.7 | |
| Total | 300 | 100 | |
| Location of Residence | Rural | 155 | 51.7 |
| Urban | 145 | 48.3 | |
| Total | 300 | 100 | |
| Household monthly income | Nil | 4 | 1.3 |
| <20,000 | 72 | 24 | |
| 20-50,000 | 71 | 23.7 | |
| 51-100,000 | 43 | 14.3 | |
| >100-000 | 110 | 36.7 | |
| Total | 300 | 100 |
Table 1: Demographic characteristics of the study participants.
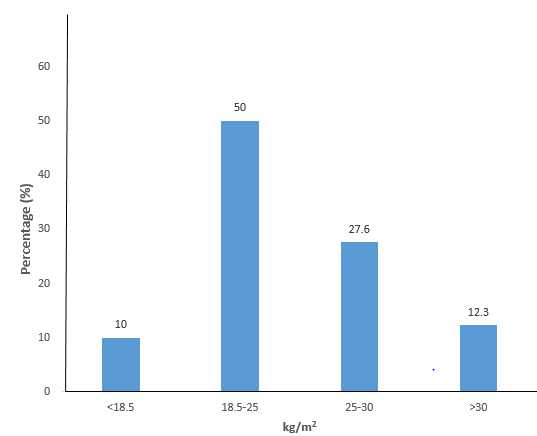
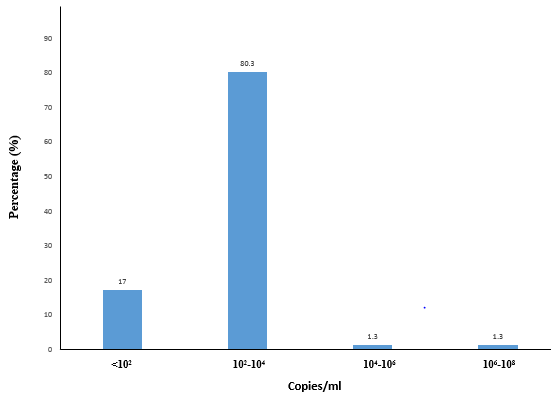
The distribution of the Body Mass Index (BMI) of the study participants is presented using a bar chart (Figure 5). A greater proportion of the participants had a BMI of 18.5- 25 kg/m2 (50%), followed by 25-30 kg/m2 (27.6%), >30 kg/m2 (12.3%) and lastly <18.5 kg/m2 (10.0%). Meanwhile, the distribution of the viral load of the study participants is presented using a bar chart (Figure 6). A larger proportion of the study participant had a viral load of 102-104 RNA copies/ ml (80.3%), followed by <102 RNA copies/ml (17.0%), 104- 106 RNA copies/ml (1.3%) and lastly 106-108 RNA copies/ ml (1.3%).
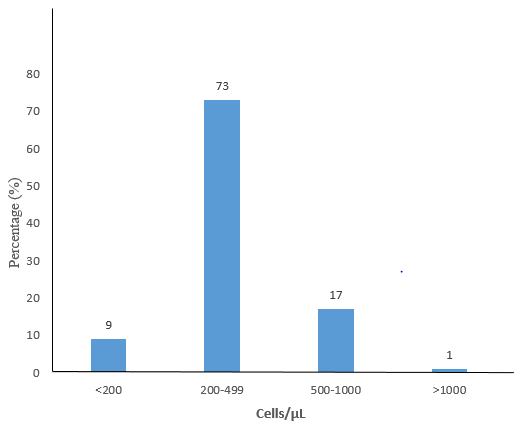
Furthermore, the distribution of the CD4 Cell Count of the study participants is presented using a bar chart (Figure
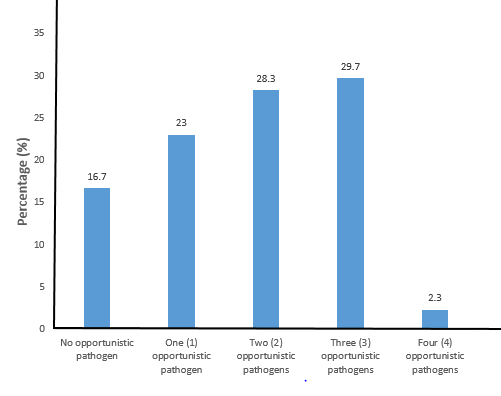
7). Majority of them had a CD4 Cell count of 200-499 cell/ µL (73%), followed by 500-1000 cell/µL (17.0%), <200 cell/µL (9.0%) and lastly >1000 cell/µL (1.0%). While the distribution of the number of opportunistic infections present among the study participants is presented using a bar chart (Figure 8). Fifty (16.7%) of the study participants were negative for all the five (5) opportunistic pathogens screened for. Meanwhile, 23%, 28.3%, 29.7% and 2.3% of the study participants tested positive for one, two, three and four opportunistic pathogens, respectively.
The frequency of occurrence of Toxoplasma gondii infection among the study participants is presented in Table 2. Out of the 300 study participants examined, 155 (51.7%) were positive for toxoplamosis, while the remaining 145
(48.4%) were negative. Based on age, the occurrence of Toxoplasma gondii infection was significantly (P=0.000, X2=31.851) higher among participants within age 26- 33 years (13.7%) when compared with those within age 42-49 years (8.3%). Based on marital status, the highest occurrence was recorded among the singles (22.3%), while the lowest occurrence was observed among the separated and widows (5.3%). Based on educational status, the occurrence of toxoplasmosis was significantly (P=0.003, X2=14.207) higher among participants who had tertiary education (26.0%) when compared to those with primary education (2.7%). With regard to the location of residence, the occurrence of toxoplamosis was significantly (P=0.000, X2=21.203) higher among rural dwellers (33.3%) when compared to the urban dwellers (18.3%). On the basis of household monthly income, the highest occurrence was recorded among participants who earn <20,000 49 (16.3%), while the lowest was recorded among those who earn 20- 50,000 23 (7.7%). The difference was statistically significant (P=0.000, X2=56.887).
| Characteristics | Category | Number examined N (%) | Number positive N (%) | Number negative N (%) | Pearson Chi- Square (X2) | P-value |
|---|---|---|---|---|---|---|
| Age range (Yrs) | 18-25 | 101(33.7) | 33(11.0) | 68(22.7) | 31.851 | 0.000* |
| 26-33 | 77(25.7) | 41(13.7) | 36(12.0) | |||
| 34-41 | 60(20.0) | 38(12.7) | 22(7.3) | |||
| 42-49 | 38(12.0) | 25(8.3) | 13(4.3) | |||
| >50 | 24(8.0) | 18(11.6) | 6(4.1) | |||
| Total | 300(100) | 155(51.7) | 145(48.4) | |||
| Marital status | Divorced | 37(12.3) | 26(8.7) | 11(3.7) | 14.507 | 0.006 |
| Married | 66(22.0) | 30(10.0) | 36(12.0) | |||
| Separated | 27(9.0) | 16(5.3) | 11(3.7) | |||
| Single | 149(49.7) | 67(22.3) | 82(27.3) | |||
| Widow | 21(7.0) | 16(5.3) | 5(1.7) | |||
| Total | 300(100) | 155(51.7) | 145(48.4) | |||
| Religion | Christianity | 177(59.0) | 98(32.7) | 79(26.3) | 24.582 | 0.000* |
| Islam | 90(30.0) | 33(11.0) | 57(19.0) | |||
| Others | 29(9.7) | 24(8.0) | 5(1.7) | |||
| Traditional | 4(1.3) | 0(0.0) | 4(1.3) | |||
| Total | 300(100) | 155(51.7) | 145(48.4) | |||
| Tribe | Hausa | 69(23.0) | 34(11.3) | 35(11.7) | 2.487 | 0.478 |
| Igbo | 81(27.0) | 38(12.7) | 43(14.3) | |||
| Others | 71(23.7) | 42(14.0) | 29(9.7) | |||
| Yoruba | 79(26.3) | 41(13.7) | 38(12.7) | |||
| Total | 300(100) | 155(51.7) | 145(48.4) | |||
| Educational Status | 56(18.7) | 22(7.3) | 34(11.3) | 14.207 | 0.003* | |
| Primary | 12(4.0) | 4(1.3) | 8(2.7) | |||
| Secondary | 74(24.7) | 51(17.0) | 23(7.7) | |||
| Tertiary | 158(52.6) | 78(26.1) | 80(26.7) | |||
| Total | 300(100.0) | 155(51.7) | 145(48.4) | |||
| Location of Residence | Rural | 155(51.7) | 100(33.3) | 55(18.3) | 21.203 | 0.000* |
| Urban | 145(48.3) | 55(18.3) | 90(30.0) | |||
| Total | 300(100) | 155(51.6) | 145(48.4) | |||
| Household monthly income | Nil | 4(1.3) | 0(0.0) | 4(1.3) | 56.887 | 0.000* |
| <20,000 | 72(24.0) | 49(16.3) | 23(7.7) | |||
| 20-50,000 | 71(23.7) | 23(7.7) | 48(16.0) | |||
| 51-100,000 | 43(14.3) | 38(12.7) | 5(1.7) | |||
| >100,000 | 110(36.6) | 45(15.0) | 65(21.6) | |||
| Total | 300(100) | 155(51.7) | 145(48.4) |
Table 2: Frequency of occurrence of Toxoplasma gondii infection among study participants.
*P<0.05 is considered statistically significant. Table 2: Frequency of occurrence of Toxoplasma gondii infection among study participants.
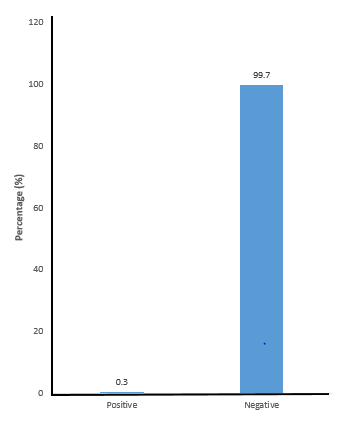
The frequency of occurrence of Rubella virus infection among the study participants is presented using a bar chart (Figure 9). Overall, only one person (0.3%) tested positive to Rubella virus while, others were negative (99.7%). Table 3 shows the frequency of occurrence of Cytomegalovirus infection among study participants. Overall, 220 (73.3%) participants tested positive with the highest occurrence among age 18-25 years (25.7%), while the lowest occurrence was recorded among those who are >50 years (8.6%). The difference is statistically significant (P=0.002, X2=18.911). Based on their marital status, the highest occurrence was recorded among singles (37.3%), while the lowest was recorded among the widows (4.7%). Based on educational status, the highest occurrence of Cytomegalovirus was recorded among participant with tertiary education (39.0%), the lowest was recorded among those with primary education (4.0%). Regarding household monthly income, the highest occurrence was recorded among participants with monthly income >N100, 000 (28.3%) and N51-100, 000 (13.0%).
| Characteristics | Category | Number examined N (%) | Number positive N (%) | Number negative N (%) | Pearson Chi- Square (X2) | P-value |
|---|---|---|---|---|---|---|
| Age Range (Yrs) | 18-25 | 101(33.7) | 77(25.7) | 24(8.0) | 18.911 | 0.002* |
| 26-33 | 77(25.7) | 43(14.3) | 34(11.3) | |||
| 34-41 | 60(20.0) | 47(15.7) | 13(4.3) | |||
| 42-49 | 38(12.0) | 34(11.3) | 4(1.3) | |||
| >50 | 24(8.0) | 19(8.6) | 5(6.3) | |||
| Total | 300(100) | 220(73.4) | 80(26.6) | |||
| Marital status | Divorced | 37(12.3) | 29(9.7) | 8(2.7) | 2.988 | 0.56 |
| Married | 66(22.0) | 44(14.7) | 22(7.3) | |||
| Separated | 27(9.0) | 21(7.0) | 6(2.0) | |||
| Single | 149(49.7) | 112(37.3) | 37(12.3) | |||
| Widow | 21(7.0) | 14(4.7) | 7(2.3) | |||
| Total | 300(100) | 220(73.4) | 80(26.6) | |||
| Religion | Christianity | 177(59.0) | 139(46.3) | 38(12.7) | 9.594 | 0.022* |
| Islam | 90(30.0) | 56(18.7) | 34(11.3) | |||
| Others | 29(9.7) | 21(7.0) | 8(2.7) | |||
| Traditional | 4(1.3) | 4(1.3) | 0(0.0) | |||
| Total | 300(100) | 220(73.4) | 80(26.6) | |||
| Tribe | Hausa | 69(23.0) | 51(17.0) | 18(6.0) | 4.072 | 0.254 |
| Igbo | 81(27.0) | 64(21.3) | 17(5.7) | |||
| Others | 71(23.7) | 46(15.3) | 25(8.3) | |||
| Yoruba | 79(26.3) | 59(19.7) | 20(6.7) | |||
| Total | 300(100) | 220(73.4) | 80(26.6) | |||
| Educational status | 56(18.7) | 33(11.0) | 23(7.7) | 11.31 | 0.010* | |
| Primary | 12(4.0) | 12(4.0) | 0(0.0) | |||
| Secondary | 74(24.7) | 58(19.3) | 16(5.3) | |||
| Tertiary | 158(52.7) | 117(39.0) | 41(13.7) | |||
| Total | 300(100) | 220(73.4) | 80(26.6) | |||
| Location of Residence | Rural | 155(51.7) | 112(37.3) | 43(14.3) | 0.19 | 0.663 |
| Urban | 145(48.3) | 108(36.0) | 37(12.4) | |||
| Total | 300 (100) | 220(73.4) | 80(26.6) | |||
| Household monthly income | Nil | 4(1.3) | 0(0.0) | 4(1.3) | 21.569 | 0.000* |
| <20,000 | 72(24.0) | 47(15.7) | 25(8.3) | |||
| 20-50,000 | 71(23.7) | 49(16.3) | 22(7.3) | |||
| 51-100,000 | 43(14.3) | 39(13.0) | 4(1.3) | |||
| >100,000 | 110(36.6) | 85(28.3) | 25(8.3) | |||
| Total | 300(100) | 220(73.4) | 80( 26.6) |
Table 3: Frequency of occurrence of Cytomegalovirus infection among study participants Table 4 shows the frequency of occurrence
*P<0.05 is considered statistically significant. Table 3: Frequency of occurrence of Cytomegalovirus infection among study participants Table 4 shows the frequency of occurrence of Herpes Simplex Virus Type-1 (HSV-1) infection among study participants. Out of the 300 participants examined, only 7 (2.3%) tested positive for HSV-1, while the remaining 293 (97.7%) tested negative. Based on their age distribution, the highest and lowest occurrence of HSV-1 was recorded among participants within the age range 34-41 years (2.0%) and 18-25years (0.3%), respectively. Based on marital status, 6 single women (2.0%) tested positive for HSV-1, while only one married (0.3%) person had HSV-1. Based on educational status, the highest occurrence of HSV-1 was recorded among participants with secondary education (2.0%), while the lowest occurrence was found among participant with no any form of formal education (0.3%). On the basis of household monthly income, the highest and lowest occurrence was recorded among participants who receive N20-50,000 (2.0%) as monthly income, while lowest was found among those who earn < N 20,000 (0.3%).
| Characteristics | Category | Number examined N (%) | Number positive N (%) | Number negative N (%) | Pearson Chi- Square (X2) | P-value |
|---|---|---|---|---|---|---|
| Age range (Yrs) | 18-25 | 101(33.7) | 1(0.3) | 100(33.3) | 19.596 | 0.003* |
| 26-33 | 77(25.7) | 0(0.0) | 77(25.7) | |||
| 34-41 | 60(20.0) | 6(2.0) | 54(18.0) | |||
| 42-49 | 38(12.0) | 0(0.0) | 35(11.7) | |||
| >50 | 24(8.0) | 0(0.0) | 24(8.0) | |||
| Total | 300(100) | 7(2.3) | 293(97.7) | |||
| Marital status | Divorced | 37(12.3) | 0(0.0) | 37(12.3) | 4.1 | 0.393 |
| Married | 66(22.0) | 1(0.3) | 65(21.7) | |||
| Separated | 27(9.0) | 0(0.0) | 27(9.0) | |||
| Single | 149(49.7) | 6(2.0) | 143(47.7) | |||
| Widow | 21(7.0) | 0(0.0) | 21(7.0) | |||
| Total | 300(100) | 7(2.3) | 293(97.7) | |||
| Religion | Christianity | 177(59.0) | 0(0.0) | 177(59.0) | 32.612 | 0.000* |
| Islam | 90(30.0) | 2(0.7) | 88(29.3) | |||
| Others | 29(9.7) | 5(1.7) | 24(8.0) | |||
| Traditional | 4(1.3) | 0(0.0) | 4(1.3) | |||
| Total | 300(100) | 7(2.4) | 296(97.6) | |||
| Tribe | Hausa | 69(23.0) | 2(0.7) | 67(22.3) | 8.92 | 0.030* |
| Igbo | 81(27.0) | 5(1.7) | 76(25.3) | |||
| Others | 71(23.7) | 0(0.0) | 71(23.7) | |||
| Yoruba | 79(26.3) | 0(0.0) | 79(26.3) | |||
| Total | 300(100) | 7(2.4) | 293(97.6) | |||
| Education | 56(18.7) | 1(0.3) | 55(18.3) | 14.964 | 0.002* | |
| Primary | 12(4.0) | 0(0.0) | 12(4.0) | |||
| Secondary | 74(24.7) | 6(2.0) | 68(22.7) | |||
| Tertiary | 158(52.7) | 0(0.0) | 158(52.7) | |||
| Total | 300(100.1) | 7(2.3) | 293(97.7) | |||
| Location of Residence | Rural | 155(51.7) | 1(0.3) | 154(51.3) | 4.01 | 0.045 |
| Urban | 145(48.3) | 6(2.0) | 139(46.3) | |||
| Total | 300(100) | 7(2.3) | 293(97.6) | |||
| Household monthly income | Nil | 4(1.3) | 0(0.0) | 4(1.3) | 15.692 | 0.003* |
| <20,000 | 72(24.0) | 1(0.3) | 71(23.7) | |||
| 20-50,000 | 71(23.7) | 6(2.0) | 65(21.7) | |||
| 51-100,000 | 43(14.3) | 0(0.0) | 43(14.3) | |||
| >100,000 | 110(36.6) | 0(0.0) | 110(36.6) | |||
| Total | 300(99.9) | 7(2.3) | 293(97.6) |
Table 4: Frequency of occurrence of Herpes Simplex Virus Type-1 infection among study participants.
P<0.05 is considered statistically significant. Table 4: Frequency of occurrence of Herpes Simplex Virus Type-1 infection among study participants.
Table 5 shows the frequency of occurrence of Herpes Simplex Virus Type-2 (HSV-2) infection among study participants. Overall, 155(51.6%) participants tested positive, while 145 (48.4%) were negative. Based on age distribution, the highest and lowest occurrence of HSV- 2 was recorded among participants within the age range 18-25years (19.3%) and 50years (7.0%), respectively. Difference was found to be statistically significant (P<0.05).
Based on marital status, majority of the study participants who tested positive for HSV-2 were singles (30.0%). This was found to be significantly higher (P<0.05) when compared to the married and widows with the lowest occurrence (4.3%, each). Based on educational status, the occurrence of Herpes Simplex Virus Type-2 was significantly (P<0.05) higher among participants with tertiary education (33.3%) when compared with those with no formal education (1.0%). Regarding household monthly income, HSV-2 was found to be significantly (P<0.05) higher among participants who earn > N100, 000 (22.7%) when compared to those who earn < N 20, 000 (7.7%).
| Characteristics | Category | Number examined N (%) | Number positive N (%) | Number negative N (%) | Pearson Chi- Square (X2) | P-value |
|---|---|---|---|---|---|---|
| Age range (Yrs) | 18-25 | 101(33.7) | 58(19.3) | 43(14.3) | 29.349 | 0.000* |
| 26-33 | 77(25.7) | 29(9.7) | 48(16.0) | |||
| 34-41 | 60(20.0) | 25(8.3) | 35(11.7) | |||
| 42-49 | 38(12.0) | 0(0.0) | 3(1.0) | |||
| >50 | 24(8.0) | 21(7.0) | 14(4.7) | |||
| Total | 300(100) | 155(51.6) | 145(48.4) | |||
| Marital status | Divorced | 37(12.3) | 25(8.3) | 12(4.0) | 36.194 | 0.000* |
| Married | 66(22.0) | 13(4.3) | 53(17.7) | |||
| Separated | 27(9.0) | 14(4.7) | 13(4.3) | |||
| Single | 149(49.7) | 90(30.0) | 59(19.7) | |||
| Widow | 21(7.0) | 13(4.3) | 8(2.7) | |||
| Total | 300(100) | 155(51.6) | 145(48.4) | |||
| Religion | Christianity | 177(59.0) | 94(31.3) | 83(27.7) | 6.33 | 0.097 |
| Islam | 90(30.0) | 40(13.3) | 50(16.7) | |||
| Others | 29(9.7) | 17(5.7) | 12(4.0) | |||
| Traditional | 4(1.3) | 4(1.3) | 0(0.0) | |||
| Total | 300(100) | 155(51.6) | 145(48.4) | |||
| Tribe | Hausa | 69(23.0) | 39(13.0) | 30(10.0) | 36.169 | 0.000* |
| Igbo | 81(27.0) | 62(20.7) | 19(6.3) | |||
| Others | 71(23.7) | 23(7.7) | 48(16.0) | |||
| Yoruba | 79(26.3) | 31(10.3) | 48(16.0) | |||
| Total | 300(100) | 155(51.7) | 145(48.3) | |||
| Education | 56(18.7) | 3(1.0) | 53(17.7) | 63.418 | 0.000* | |
| Primary | 12(4.0) | 4(1.3) | 8(2.7) | |||
| Secondary | 74(24.7) | 48(16.0) | 26(8.7) | |||
| Tertiary | 158(52.7) | 100(33.3) | 58(19.3) | |||
| Total | 300(100) | 155(51.6) | 145(48.4) | |||
| Location of Residence | Rural | 155(51.7) | 67(22.3) | 88(29.3) | 9.15 | 0.002* |
| Urban | 145(48.3) | 88(29.3) | 57(19.0) | |||
| Total | 300(100) | 155(51.6) | 145(48.4) | |||
| Household monthly income | Nil | 4(1.3) | 0(0.0) | 4(1.3) | 41.975 | 0.000* |
| <20,000 | 72(24.0) | 23(7.7) | 49(16.3) | |||
| 20-50,000 | 71(23.7) | 28(9.3) | 43(14.3) | |||
| 51-100,000 | 43(14.3) | 36(12.0) | 7(2.3) | |||
| >100,000 | 110(36.6) | 68(22.7) | 42(14.0) | |||
| Total | 300(100) | 155(51.6) | 145(48.4) |
Table 5: Frequency of occurrence of HSV Type-2 infection among study participants.
*P<0.05 is considered statistically significant. Table 5: Frequency of occurrence of HSV Type-2 infection among study participants.
Table 6 shows the prevalence of opportunistic pathogens in relationship with the time of HIV diagnosis of the study participants. Majority of the participants who tested positive to Toxoplasma gondii, Rubella virus, Cytomegalovirus, HVS- 1 and HVS-2 were diagnosed with HIV infection for over 1-5years: TOXO (20.3%), RV (0.3%), CMV (31.0%), HVS-1 (2.3%) and HVS-2 (19.3%).
Table 7 shows Prevalence of opportunistic pathogens in relationship with the viral load of the study participants. The prevalence of Toxoplasma gondii, Cytomegalovirus, HSV-1 and HSV-2 was found to be highest among participants with a viral load of 102-104 copies/ml: 48.7%, 69.7%, 1.7% and 48.7%, respectively. Whereas, the prevalence of Rubella virus was found to be highest among participants with viral load of 104-106 copies/ml (0.3%).
| Opportunistic pathogens | Test Result | <6 months | >6 months | 1-5 YRS | 5-10 YRS | >10 YRS | Total | P-value |
|---|---|---|---|---|---|---|---|---|
| Toxoplasma gondii | Negative | 13(4.3) | 37(12.3) | 67(22.3) | 21(7.0) | 7(2.3) | 145(48.3) | 0.013* |
| Positive | 14(4.7) | 28(9.3) | 61(20.3) | 26(8.7) | 26(8.7) | 155(51.7) | ||
| Rubella Virus | Negative | 27(9.0) | 65(21.7) | 127(42.3) | 47(15.7) | 33(11.0) | 299(99.7) | 0.853 |
| Positive | 0(0.0) | 0(0.0) | 1(0.3) | 0(0.0) | 0(0.0) | 1(0.3) | ||
| Cytomegalovirus | Negative | 11(3.7) | 16(5.3) | 35(11.7) | 12(4.0) | 6(2.0) | 80(26.7) | 0.386 |
| Positive | 16(5.3) | 49(16.3) | 93(31.0) | 35(11.7) | 27(9.0) | 220(73.3) | ||
| HVS-1 | Negative | 27(9.0) | 65(21.7) | 121(40.3) | 47(15.7) | 33(11.0) | 293(97.7) | 0.047* |
| Positive | 0(0.0) | 0(0.0) | 7(2.3) | 0(0.0) | 0(0.0) | 7(2.3) | ||
| HVS-2 | Negative | 18(6.0) | 28(9.3) | 70(23.3) | 20(6.7) | 9(3.0) | 145(48.3) | 0.012* |
| Positive | 9(3.0) | 37(12.3) | 58(19.3) | 27(9.0) | 24(8.0) | 155(51.7) |
Table 6: Prevalence of opportunistic pathogens in relationship to the time of HIV diagnosis.
| Viral Load (Copies per ml) | |||||||
|---|---|---|---|---|---|---|---|
| Opportunistic pathogens | Test Result | <102 | 102-104 | 104-106 | 106-108 | Total | P-value |
| Toxoplasma gondii | Negative | 50(16.7) | 95(31.7) | 0(0.0) | 0(0.0) | 145(48.3) | 0.000* |
| Positive | 1(0.3) | 146(48.7) | 4(1.3) | 4(1.3) | 155(51.7) | ||
| Rubella Virus | Negative | 51(17.0) | 241(80.3) | 3(1.0) | 4(1.3) | 299(99.7) | 0.000* |
| Positive | 0(0.0) | 0(0.0) | 1(0.3) | 0(0.0) | 1(0.3) | ||
| Cytomegalovirus | Negative | 48(16.0) | 32(10.7) | 0(0.0) | 0(0.0) | 80(26.7) | 0.000* |
| Positive | 3(1.0) | 209(69.7) | 4(1.3) | 4(1.3) | 220(73.3) | ||
| Herpes Simplex Virus Type-1 | Negative | 5117.0) | 236(78.7) | 3(1.0) | 3(1.0) | 293(97.7) | 0.000* |
| Positive | 0(0.0) | 5(1.7) | 1(0.3) | 1(0.3) | 7(2.3) | ||
| Herpes Simplex Virus Type-2 | Negative | 49(16.3) | 95(31.7) | 1(0.3) | 0(0.0) | 145(48.3) | 0.000* |
| Positive | 2(0.7) | 146(48.7) | 3(1.0) | 4(1.3) | 155(51.7) |
Table 7: Prevalence of opportunistic pathogens in relationship to the CD4 Counts of the study.
Table 8 shows the prevalence of opportunistic pathogens in relationship with the CD4 Counts of the study participants. The prevalence of Toxoplasma gondii, Cytomegalovirus and HSV-1 was found to be highest among participants with CD4 Cell Count of 104-106cells/µL: 41.0%, 66.7% and 2.0%, respectively. The prevalence of Rubella virus was found to be highest among participants with CD4 Cell Count of <102 cells/ µL (0.3%), whereas HSV-2 was highest among participants with CD4 Cell Count of 102 -104 cells/µL (48.7%).
| Opportunistic pathogens | Test Result | CD4 Cell Count cells/µL | Total | P-value | |||
|---|---|---|---|---|---|---|---|
| <200 | 200-499 | 500-1000 | >1000 | ||||
| Toxoplasma gondii | Negative | 0(0.0) | 1(0.3) | 96(32.0) | 48(16.0) | 145(48.3) | 0.000* |
| Positive | 27(9.0) | 2(0.7) | 123(41.0) | 3(1.0) | 155(51.7) | ||
| Rubella Virus | Negative | 26(8.7) | 3(1.0) | 219(73.0) | 51(17.0) | 299(99.7) | 0.017* |
| Positive | 1(0.3) | 0(0.0) | 0(0.0) | 0(0.0) | 1(0.3) | ||
| Cytomegalovirus | Negative | 15(5.0) | 1(0.3) | 19(6.3) | 45(15.0) | 80(26.7) | 0.000* |
| Positive | 12(4.0) | 2(0.7) | 200(66.7) | 6(2.0) | 220(73.3) | ||
| Herpes Simplex Virus Type-1 | Negative | 26(8.7) | 3(1.0) | 213(71.0) | 51(17.0) | 293(97.7) | 0.643 |
| Positive | 1(0.3) | 0(0.0) | 6(2.0) | 0(0.0) | 7(2.3) | ||
| Herpes Simplex Virus Type-2 | Negative | 8(2.7) | 1(0.3) | 88(29.3) | 48(16.0) | 145(48.3) | 0.000* |
| Positive | 2(0.7) | 146(48.7) | 3(1.0) | 4(1.3) | 155(51.7) |
Table 8: Prevalence of opportunistic pathogens in relationship to the CD4 Counts of the study.
*P<0.05 is considered statistically significant. Table 8: Prevalence of opportunistic pathogens in relationship to the CD4 Counts of the study.
Table 9 shows the prevalence of opportunistic pathogens in relationship to the body mass index (BMI) of the study participants. The prevalence of Toxoplasma gondii, Cytomegalovirus and HSV-2 was found to be highest among participants with BMI of 18.5-25kg/m2: 21.0%, 37.3% and
26.7%. On the other hand, the prevalence of Rubella virus was found to be highest among participants with BMI > 30 kg/m2 (0.3%), whereas HSV-1 was highest among those with BMI <18.5kg/m2 (2.0%).
| Opportunistic pathogens | Test Result | BMI (Kg/m2) | >30 | Total | P-value | |||
|---|---|---|---|---|---|---|---|---|
| <18.5 | 18.5-25 | 25-20 | 25-30 | |||||
| Toxoplasma gondii | Negative | 12(4.0) | 87(29.0) | 0(0.0) | 28(9.3) | 18(6.0) | 145(48.3) | 0.002* |
| Positive | 18(6.0) | 63(21.0) | 7(2.3) | 55(19.3) | 19(6.3) | 155(51.7) | ||
| Rubella Virus | Negative | 30(10.0) | 150(50.0) | 7(2.3) | 83(27.6) | 36(12.0) | 299(99.7) | 0.129 |
| Positive | 0(0.0) | 0(0.0) | 0(0.0) | 0(0.0) | 1(0.3) | 1(0.3) | ||
| Cytomegalovirus | Negative | 7(2.3) | 38(12.7) | 0(0.0) | 24(8.0) | 11(3.7) | 80(26.7) | 0.41 |
| Positive | 23(7.7) | 112(37.3) | 7(2.3) | 59(19.6) | 26(8.7) | 220(73.3) | ||
| Herpes Simplex Virus Type-1 | Negative | 24(8.0) | 150(50.0) | 7(2.3) | 83(27.6) | 36(12.0) | 293(97.7) | 0.000* |
| Positive | 6(2.0) | 0(0.0) | 0(0.0) | 0(0.0) | 1(0.3) | 7(2.3) | ||
| Herpes Simplex Virus Type-2 | Negative | 12(4.0) | 70(23.3) | 0(0.0) | 45(15.0) | 18(6.0) | 145(48.3) | 0.025* |
| Positive | 18(6.0) | 80(26.7) | 7(2.3) | 38(12.6) | 19(6.3) | 155(51.7) |
Table 9: Prevalence of opportunistic pathogens in relationship to the Body Mass Index of the study participants.
*P<0.05 is considered statistically significant. Table 9: Prevalence of opportunistic pathogens in relationship to the Body Mass Index of the study participants.
Table 10 shows the risk factors associated with opportunistic infections among the study participants. Majority of the participants who indicated they have awareness of opportunistic infection (63.7%), use opportunistic infection prophylaxis (46.7%), always adhere to HAART medication (41.0%) and indulge in the act of smoking (19.3%) were positive to Cytomegalovirus. While majority of them who engage in alcohol intake tested positive for Toxoplasma gondii (26.3%). Still, most of the participants who engage in unprotected sex were positive to Toxoplasma gondii and Cytomegalovirus (25.0%, each). Meanwhile, majority of the participants who indicated that they changed sex partners recently were positive to Cytomegalovirus (24.3%).
| Characteristics | Responses | No. Positive for T. gondii N (%) | No. Positive for Rubella virus N (%) | No. Positive for CMV N (%) | No. Positive for HSV-1 N (%) | No. Positive for HSV-2 N (%) |
|---|---|---|---|---|---|---|
| Awareness of opportunistic infection | No | 17(5.7) | 0(0.0) | 29(9.7) | 0(0.0) | 18(6.0) |
| Yes | 138(46.0) | 1(0.3) | 191(63.7) | 7(2.3) | 137(45.7) | |
| Opportunistic infection prophylaxis | No | 55(18.3) | 1(0.3) | 80(26.7) | 1(0.3) | 48(16.0) |
| Yes | 100(33.3) | 0(0.0) | 140(46.7) | 6(2.0) | 107(35.7) | |
| Adherence of HAART Medication | Always | 74(24.7) | 1(0.3) | 123(41.0) | 2(0.7) | 88(29.3) |
| Often | 58(19.3) | 0(0.0) | 69(23.0) | 0(0.0) | 51(17.0) | |
| Sometimes | 23(7.7) | 0(0.0) | 28(9.3) | 5(1.7) | 16(5.3) | |
| Smoke | No | 110(36.7) | 0(0.0) | 162(54.0) | 0(0.0) | 121(40.3) |
| Yes | 45(15.0) | 1(0.3) | 58(19.3) | 7(2.3) | 34(11.3) | |
| Alcohol Intake | No | 76(25.3) | 0(0.0) | 145(48.3) | 0(0.0) | 94(31.3) |
| Yes | 79(26.3) | 1(0.3) | 75(25.0) | 7(2.3) | 61(20.3) | |
| Underlying Condition | Diabetes | 23(7.7) | 0(0.0) | 25(8.3) | 6(2.0) | 25(8.3) |
| Hypertension | 16(5.3) | 0(0.0) | 29(9.7) | 0(0.0) | 15(5.0) | |
| Kidney disorder | 6(2.0) | 0(0.0) | 6(2.0) | 0(0.0) | 6(2.0) | |
| 110(36.7) | 1(0.3) | 160(53.3) | 1(0.3) | 109(36.3) | ||
| Engage in unprotected sex | No | 80(26.7) | 1(0.3) | 145(48.3) | 1(0.3) | 101(33.7) |
| Yes | 75(25.0) | 0(0.0) | 75(25.0) | 6(2.0) | 54(18.0) | |
| Number of sex partner | 1-2 partner | 102(34.0) | 1(0.3) | 139(46.3) | 1(0.3) | 89(29.7) |
| 3-5 partner | 17(5.7) | 0(0.0) | 24(8.0) | 6(2.0) | 17(5.7) | |
| 36(12.0) | 0(0.0) | 57(19.0) | 0(0.0) | 49(16.3) | ||
| Recent change of sex partners | No | 107(35.7) | 1(0.3) | 147(49.0) | 1(0.3) | 119(39.7) |
| Yes | 48(16.0) | 0(0.0) | 73(24.3) | 6(2.0) | 36(12.0) | |
| Frequency of sexual intercourse per week | 1-2 week | 82(27.3) | 1(0.3) | 115(38.3) | 1(0.3) | 69(23.0) |
| 3-5 week | 42(14.0) | 0(0.0) | 53(17.7) | 6(2.0) | 37(12.3) | |
| Nil | 31(10.3) | 0(0.0) | 52(17.3) | 0(0.0) | 49(16.3) | |
| Frequency of Medical check up | Less often | 58(19.3) | 0(0.0) | 74(24.7) | 6(2.0) | 72(24.0) |
| often | 0(0.0) | 0(0.0) | 4(1.3) | 0(0.0) | 0(0.0) | |
| Often | 48(16.0) | 0(0.0) | 100(33.3) | 0(0.0) | 64(21.3) | |
| Very often | 49(16.3) | 1(0.3) | 42(14.0) | 1(0.3) | 19(6.3) |
Table 10: Risk factors associated with the occurrences of opportunistic infections among the study participants.
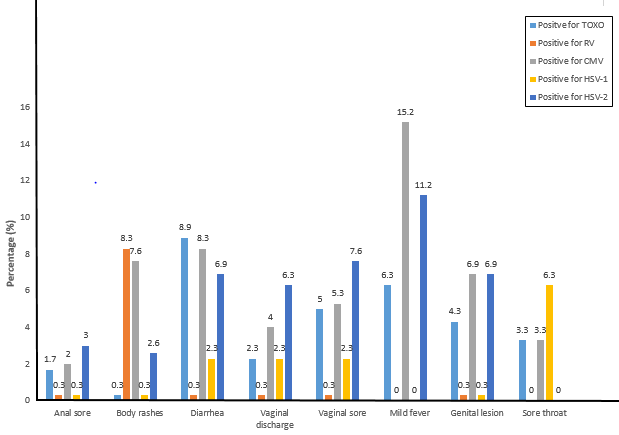
The signs and symptoms associated with opportunistic infections among the study participants is presented using a histogram (Figure 10). Majority of those who indicated diarrhea tested positive for T. gondii (8.9%), Majority of those who indicated body rashes were positive for Rubella virus (8.3%), A larger proportion of those who indicated mild fever tested positive for Cytomegalovirus (15.2%), most of those who complained of sore throat tested positive for HSV-1 (6.3%), while most of those who indicated vaginal discharge (6.3%), vaginal sore (7.6%) and genital lesion (6.9%) were positive for HSV-2.
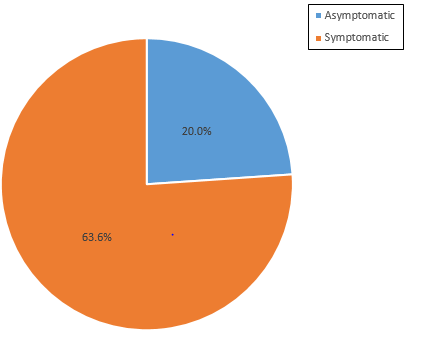
Finally, the distribution of symptomatic and asymptomatic opportunistic infections among the study participants is presented using a pie chat (Figure 11). The percentage of those who were symptomatic (63.6%) was significantly (P<0.05) higher than those that were asymptomatic (20.0%).
Discussion
HIV infection in particular is characterized by progressive and continuous impairment of the immune system function, with varying rates of progression among patients depending on whether the individual is on medication or not. Highly active antiretroviral treatments (HAARTs) have been shown to be effective in arresting immune system impairment and prevention of disease progression, yet the incidence of opportunistic infections (OIs) does not seem to cease. OIs occur in about 40% of people living with HIV, with a CD4 lymphocyte count less than 200 cells/mm3 and high plasma HIV RNA loads. Organisms that cause OIs are frequently present in the body but are generally kept under control by a healthy immune system [27, 37].
To the best of our knowledge, this present study is the first to determine and document the prevalence of some opportunistic infections (Toxoplasma gondii, Rubella virus, Cytomegalovirus, Herpes Simplex Virus Type-1 and 2) among HIV positive adult female patients receiving HAART in Ogun State, Nigeria. The outcome of this study shows that out of the 300 women screened using rapid diagnostic test (RDT) method, 155 (51.7%) were positive for Toxoplasma gondii, 1(0.3%) was positive for Rubella, 220 (73.3%) were positive for Cytomegalovirus, 7 (2.3%) were positive for HSV-1, while 155 (51.7%) were positive for HSV-2.
The result of this present study differs from those of previous studies. For instance, the 51.7% positivity for T. gondii reported in this current study was slightly lower than the 54.2% reported by Osunkalu VO, et al. [38] among HIV-infected patients (with or without neurological complications) in Lagos, Nigeria. Earlier serological studies in many groups showed that the prevalence varied depending on the geographical location, between 15% and 68%. Some values either lower or higher than reported in this current study. Galva RML, et al. [39] and Nissapatorn V, et al. [40] estimated a prevalence rate of 50% and 44.8% among HIV-
infected population in Mexico and Malaysia, respectively. In a study carried among HIV/AIDS patients in Eastern China, Shen G, et al. [41] reported a Seroprevalence of 13.2% and 5.5% of anti-T. gondii IgG antibody in immunocompromised patients with CD4 cell counts between ≥200 and <500 cells/ ml and severely immunocompromised patients with CD4 cell counts between ≥50 and <200 cells/ml, respectively. Still, Rezanezhad H, et al. [42] reported a prevalence of 21.1% among HIV-infected patients evaluated by ELISA method in Jahrom, Southern Iran. T. gondii positivity was significantly higher in age group of 30-39 years old (P=0.05); whereas in this current study it was significantly higher in age 26-33 years (P=0.000). The Seroprevalence of toxoplasmosis was significantly higher (P=0.042) in patients with CD4+<100 cells/μL (33.3%); unlike in this present study, toxoplasmosis was significantly higher (P=0.000) among those with CD4+ ranging between 500-1000 cells/µL. In a recent meta- analysis, Yenilmez E, et al. [43] reported a Seroprevalence of 40.03% in HIV-positive patients with CD4 counts ≥200 cells/ mm3, and 43.5% in the group with CD4 counts <200 cells/ mm3. Unlike in this study a higher seropositivity (41.0%) was reported among those with CD4 counts between 500- 1000 cells/µL, compared to the 9.0% reported among those with CD4 counts less than 200 cells/µL. Zakari MM, et al. [44] reported a Seroprevalence of 29.4% and 4.4% for anti-T. gondii IgG and IgM, respectively, among HIV-seropositive pregnant women in North-Central Nigeria. There was no significant association between the seroprevalence of anti-T. Gondii-IgG and IgM with age, gestational age, education level, parity or place of residence (P > 0.05). However, there was significant association between the seroprevalence of anti-T. Gondii-IgG (P = 0.03) and anti-T. Gondii-IgM (P = 0.01) with education level. Still, Sajedi HR, et al. [45] reported a seropositivity of 4.9% for anti-T. Gondii IgM antibodies among HIV/AIDS patients in Northern Iran.
However, on the other hand, higher prevalent rates than observed in this study have been reported researchers who did similar works. For instance, Meisheri VV, et al. [46] and Wanachiwanawin D, et al. [47] reported a prevalence rate of 67.8% and 53.7% among HIV-infected persons in India and Thailand, respectively. Lindstrom I, et al. [48] evaluated 130 HIV-positive patients in Uganda and reported a prevalence rate of 54%. Dutta A, et al. [49] reported a prevalence rate of 73% among HIV seropositive patients in Indian. The proportion of anti-Toxoplasma IgG positivity showed no significant association with age, gender and risk factors of the patients. And in a recent study, Sajedi HR, et al. [45] reported a seropositivity of 60.3% for anti-T. gondii IgG antibodies among HIV/AIDS patients in Northern Iran, with a mean CD4+count of 549±27cells/µL and viral load less than 1000 copies/ml. The slight variations in T. gondii prevalence rate obtained in this study compared with other earlier studies could be attributed to differences in geographical location.
Infection is more common in warm climates, and at lower altitudes than in cold climates and mountainous regions [40]. However, public enlightenment/health education, and high Human Development Index (HDI) standards could also be responsible for decrease in prevalent rate.
The prevalence rate of Rubella in the study was extremely very low, as only one person tested positive (0.3%). On one hand, it is comparable with the work of Madi JM, et al. [50] carried out in Brazil, in which only 15 (1%) out of the 1510 puerperal women examined tested for rubella. But on the other hand, it differs from the work of Sticchi L, et al. [51], who reported 94.1% among 305 subjects tested. Interestingly, in patients aged 20–40 years, positivity rate was <85%. This is crucial especially for a susceptible woman of childbearing age. It also differs from the work of Taku NA, et al. [52] who reported a seroprevalence of 94.4% for rubella specific IgG (presumably due to immunity induced by wild-type rubella virus; although none had received Rubella vaccine) and 5.0% for rubella specific IgM (possibly indicating rubella infection) among pregnant women in South-West regions of Cameroon. The outcome of this study also differ from the work of Akele RY, et al. [19] who reported a seroprevalence rate of 95.7% and 12% for rubella IgG and IgM, respectively among pregnant women in South-West Nigeria.
Furthermore, the result obtained from the study showed that the prevalence rate of Cytomegalovirus infection among HIV positive women on HAART in Ogun State is high (73.3%), but less than the 100%, 100% and 99.4%, reported by Akinbami AA, et al. [53]; Ibrahim MK, et al. [54] and Aliyu A, et al. [55], respectively in South-West Nigeria, North-East Nigeria and North-Central Nigeria, respectively. This shows that HIV is a predisposing factor for Cytomegalovirus infection. This report however, differs from those of Manjusha P, et al. [56] who reported low prevalent rates: anti-CMV- IgG (10.4%) and anti-CMV - IgM (8.4%) antibodies among HIV positive patients in North India. The reason for the high prevalence of CMV infection among HIV positive patients in this study may be associated with the depreciating socioeconomic standard, poor hygienic practices, and low standard of education among the rural populace. Racial differences between the populations, enormous cultural and economic differences between developed countries (where the study was previously carried out) and developing countries like Nigeria are valid factors that might be responsible for this variation in prevalence rates obtained, which justifies the previous reports of Neto WC, et al. [57] and Nishimura N, et al. [58].
Regarding HVS-1 and HVS-2 prevalence rates, studies from different parts of the world demonstrated that rates of HSV-1 infection were much higher in HIV-positive patients or those with a high risk of HIV than in the general population.
The prevalence rates of HSV type 1 (HSV-1) among HIV-1 infected people ranging from 90% to 100% [27]. However, in a previous study among HIV patients in South Africa, a prevalence rate of 11% has been reported for HSV-1 among HIV positive patients suffering from keratitis Iran. This was lower than the 2.3% observed in this current study. HSV-2 prevalence on the other hand, is highly variable and depends on many factors, including: country and region of residence, population subgroup, sex, and age. According to Mugo N, et al. [59, 60], HSV-2 affects 50–90% of HIV-1 infected people higher than in the general population. This present study found a high prevalence of HSV-2 (51.7%) from blood samples compared to HSV-1 (2.3%) using rapid diagnostic test kits. This report disagrees with those of previous studies who reported a higher prevalence rates of HSV-1 compared to HSV-2. For instance, in a study conducted in Maryland, Mark HD, et al. [61] obtained a sero-prevalence of 48% and 3.4% for HSV-1 and HSV-2, respectively, using Western Blot assay. Similarly, studies conducted in South West of Iran showed that the HSV-1 sero-prevalence (79.2%) was higher than HSV-2 (23.3%) [62]. Still Samie A, et al. [63] reported a high prevalence of HSV-1 (48.3%) from urine samples compared to HSV-2 (10.7%) when real-time PCR assay was used.
According to Mugo N, et al. [59] the Sub-Saharan Africa has the highest HSV-2 seroprevalence in the world, reaching 80% in adult population. Epidemiologic studies conducted among miners and commercial sex workers in South Africa reported sero-prevalence rates of 60% and 90%, respectively, for HSV- 2 [64]. Still, a meta-analysis of the association between HSV- 2 infection and risk of HIV-1 acquisition reviewed 31 studies has demonstrated that HSV-2 prevalence is associated with a 2- to 4-fold increased risk of HIV-1 acquisition. This epidemiological evidence indicated a strong relationship exist between HSV-2 and HIV [59]. The seroprevalence of HSV-2 infection (51.7%) observed in this study was also found to be far lower the 2.7% and 3.3%, HSV-2 IgM and HSV-2 IgG antibodies, respectively, reported by Enitan SS, et al. [27] among apparently healthy undergraduate female students of a private tertiary institution in South-West, Nigeria, further indicating that non-HIV infected individuals are less likely to be infected by HSV compared with their HIV infected counterparts.
In this study HSV-2 seropositivity was more prevalent (48.7%) among HIV patients with CD4 counts between 200- 499 cells/µL. Previous studies have demonstrated that HSV infections are associated with a compromised immune system in HIV-positive patients. There was a statistically significant association between HSV seropositivity and the degree of immunosuppression, as reflected by cluster difference 4 (CD4) count. Other studies showed that asymptomatic HSV shedding increases with lower CD4 count in HIV-positive patients [59]. Still, another study also confirmed that risk factors for increased HSV shedding among HIV-positive men were low CD4 cell counts. However, other studies have shown conflicting results, Santos FC, et al. [65], reported a weak and statistically non-significant association of HSV infection and CD4 counts. Patients with HSV infection can present with severe manifestations even after their CD4 count increases to >500 cells/mm3. It has been suggested that immune reconstitution inflammatory syndrome (IRIS), usually occurs in individuals with a rapidly rising CD4 count, associated with severe HSV lesions after HAART initiation.
Conclusion
The outcome of this study shows that regardless of the levels of the CD4 cell counts, opportunistic infections (OIs) exist among HIV positive patients receiving HAART in South-West Nigeria: Toxoplasma gondii (51.7%), Rubella Virus (99.7%), Cytomegalovirus (26.7%), HSV-1 (2.3%) and HSV-2 (51.7%). This finding highlights the importance of opportunistic infections (OIs) surveillance and the use of OIs prophylaxis among HIV patients. A high index of suspicion should be maintained for opportunistic infection in people living with HIV despite the use of HAART considering that one-fifth of patients receiving HAART in this study were found to have at least one opportunistic infection. Health education on HIV screening and early presentation should be intensified to encourage early diagnosis, and prompt access to HIV care and treatment. Individuals, who continue to have low CD4 cell count while on HAART, should be aggressively evaluated for opportunistic diseases and practical efforts to optimize their immunological recovery should be made which may involve evaluation for drug resistance followed by appropriate drug switch. HAART adherence counseling should be intensified in patients receiving HAART. Measures that may be instituted could include use of treatment partners, use of alarm reminders, reducing pill burdens, and drug switch following non-tolerable side effects. Earlier initiation of HAART before progression to advanced immunosuppression should be encouraged in order to decrease the likelihood of opportunistic diseases. Also, the use and adherence to Cotrimoxazole prophylaxis should be encouraged until patients on HAART achieve sustained immunological recovery as recommended by WHO guidelines.
References
-
(2019) HIV. CDC.
-
(2019) Global HIV & AIDS Statistics-Fact Sheet. UNAIDS.
-
Awofala AA, Ogundele OE (2016) HIV epidemiology in Nigeria. Saudi J Biol Sci 25(4): 697-703.
-
NACA (2019) Nigeria HIV Prevalence Rate. National Agency for the Control of AIDS, Nigeria.
-
Brooks JT, Kaplan JE, Holmes KK, Benson C, Pau A, et al. (2009) What’s New in the 2009 US Guidelines for prevention and Treatment of opportunistic Infection Among Adults and Adolescents with HIV?. Top HIV Med 17(3): 109-114.
-
Cheesbrough M (2006a) Opportunistic Virus infection. In: Cheesbrough M (Eds.), District Laboratory Practice in Tropical Countries, Part 2. Cambridge University Press, Cape Town, South Africa, pp: 27-30.
-
Cheesbrough M (2006b) Human Deficiency Virus (HIV) In: Cheesbrough, M. (Eds.), District Laboratory Practice in Tropical Countries, Part 2. Cambridge University Press, Cape Town, South Africa, pp: 253-268.
-
Jain S, Singh AK, Singh RP, Bajaj KJ, Damle SA (2014) Spectrum of Opportunistic Fungal Infection in HIV- Infected Patients and Their Correlation with CD4+ Counts in Western India. J Med Microbiol Infec Dis 2(1): 19-22.
-
Agarwal SG, Powar RM, Tankhiwale S, Rukadikar A (2015) Study of opportunistic infection in HIV-AIDS patients and their co-relation with CD4+ cell count. Int J Curr Microbiol App Sci 4(6): 848-861.
-
UNAIDS (2016) The Joint United Nations Programme on HIV and AIDS. Global AIDS Update.
-
Esquivel CA, Corella Madueno MA, Tinoco JH, Careaga AR, Sanchez Anguiano LF, et al. (2018) Seroepidemiology of Toxoplasma gondii Infection in Women of Reproductive Age: A Cross-Sectional Study in a Northwestern Mexican City. J Clin Med Res 10(3): 210-216.
-
Coccaro EF, Lee R, Groer MW, Adem C, Read MC, et al. (2016) Toxoplasma gondii Infection: Relationship with Aggressions in psychiatric Subjects. J Clin Psychlatry 77(3): 334-341.
-
Ohiolei JA, Isaac C (2016) Toxoplasmosis in Nigeria: the story so far: a review. Folia Parasitol (Praha), pp: 63.
-
Enitan SS, Adejumo AO, Oluremi AS, Ileoma E, Adejumo EN, et al. (2019) Prevalence of Anti-Toxoplasma gondii IgM and IgG Antibodies among Young Adults with History of Ocular Infection in South-Western Nigeria. EAS Journal of Parasitology and Infectious Diseases 1(6): 133-143.
-
Akele RY, Olayanju AO, Bala ND, Chollom SC, Enitan SS, et al. (2015). Haematological parameters in Human Immunodeficiency Virus positive individuals on different HAART regimen. World Journal of Pharmaceutical Research 4(12): 30-42.
-
Banatvala JE, Brown DWG (2004) Rubella. Lancet 363(9415): 1127-1137.
-
Deka D, Rustgi R, Sarman S, Roy KK, Neena M (2006) Diagnosis of acute Rubella Infection during pregnancy. The Journal of Obstetric and Gynacology on India 56(1): 44-46.
-
Avinash M, Prashant G (2018) A Mini Review on Rubella Virus. Acta Scientific Medical Sciences 2(9): 10-14.
-
Akele RY, Pam BN, Oluboyo BO, Enitan SS, Akinseye JF, et al. (2020) Seroprevalence of Rubella IgG and IgM Antibodies among Pregnant Women Attending Antenatal Clinic in Federal Teaching Hospital Ido-Ekiti, Nigeria. Asian Journal of Immunology 4(1): 27-35.
-
CDC (2013) Rubella in-short (German measles). Centers for Disease Control and prevention.
-
Mitiku K, Bedada T, Masresha B, Kegne W, Traore FN, et al. (2011) The epidemiology of Rubella Disease in Ethiopia: data from the measles case based surveillance system. J Infect Dis 204(S1): 239-242.
-
Petrova AG, Dimitrova M, Gyokova EH, Ivanova Yoncheva YG, Popov ID (2019) Risk factors of cytomegalovirus infection during pregnancy. J of IMAB 25(1): 2323-2326.
-
Oladipo EK, Akinpelu OO, Oladipo AA, Edowhorhu G (2014) Seroprevalence of Cytomegalovirus (CMV) among Blood Donors at Bowen University Teaching Hospital Ogbomoso, Nigeria. American Journal of Medical and Biological Research 2(3): 72-75.
-
Nwafor IE, Ogbonnaya O (2017) Prevalence of Human Cytomegalovirus Infection among Human Immunodeficiency Virus Position Woman Receiving Antiretroviral Treatment at Federal Teaching Hospital Abakaliki, Ebonyi State, Nigeria. J Biomedical Sci 6(4): 29.
-
Petrov AG, Dimitrova M, Gyokova E, Yoncheva YI, Popov J, et al. (2019) Risk factors of cytomegalovirus infection during pregnancy. Journal of IMAB - Annual Proceeding (Scientific Papers). 25(1): 2323-2326.
-
Cannon MJ, Hyde TB, Schmid DS (2011) Review of cytomegalovirus shedding in bodily fluids and relevance to congenital cytomegalovirus infection. Rev Med Virol 21(4): 240-255.
-
Enitan SS, Ihongbe JC, Ochei JO, Oluremi AS, Itodo GE, et al. (2020) Seroprevalence of Herpes Simplex Virus Type 2 and Association Risk Factors among Undergraduate Female Students of Babcock University, Nigeria. International STD Research and Reviews 9(1): 1-15.
-
Straface G, Selmin A, Zanardo V, De Santis M, Ercoli A, et al. (2012) Herpes Simplex Virus Infection in Pregnancy. Infect Dis Obstet Gynecol 2012: 385697.
-
Ayoub HH, Chemaitelly H, Abu Raddad LJ (2019) Characterizing the transitioning epidemiology of herpes simplex virus type 1 in the USA: Model-based predictions. BMC Med 17(1): 57.
-
Biškup UG, Uršič T, Petrovec M (2015) Laboratory diagnosis and epidemiology of herpes simplex 1 and 2 genital infection. Acta Dermatovenerol Alp Pannonica Adriat 24(2): 31-35.
-
Alemayehu M, Wubshet M, Mesfin N, Gebayehu A (2017) Prevalence of Human Immunodeficiency Virus and associated factors among Visceral Leishmaniasis infected patients in Northwest Ethiopia: a facility based cross-sectional study. BMC Infect Dis 17(1): 152.
-
Auvert B, Taljaard D, Lagarde E, Tambekou, JS, Sitta R, et al. (2006) Randomized, Controlled Intervention Trial of Male Circumcision for Reduction of HIV Infection Risk: The ANRS 1265 Trial. Plos Medicine 3(5): e226.
-
Itodo GE, Enitan SS, Samanu VO, Ehiaghe FA, Akele YR, et al. (2015) Effect of highly active antiretroviral therapy (HAART) On CD4+ cell count and liver enzymes in HIV infection at Lokoja, Nigeria. African Journal of Cellular Pathology 3(3): 24-28.
-
Asmarawati TP, Putranti A, Rachman BE, Hadi U, Nasronudin (2018) Opportunistic infection manifestation of HIV-AIDS patients in Airlangga University hospital Surabaya. IOP Conference Series: Earth and Environmental Science 125: 012061.
-
Charan J, Biswas T (2013) How to Calculate Sample Size for Different Study Designs in Medical Research?. Indian J Psychol Med 35(2): 121-126.
-
Iroezindu MO, Ofondu EO, Hausler H, Wyk BV (2013) Prevalence and Factors for Opportunistic Infections in HIV Patients Receiving Antiretroviral in a Resource- Limited Setting in Nigeria. J AIDS Clinic Res S3: 002.
-
Shenoy N, Ramapuram JT, Shenoy A, Ahmed J, Srikant N (2017) Incidence of Opportunistic Infections among HIV-Positive Adults on Highly Active Antiretroviral Therapy in a Teaching Hospital, India: Prospective Study. J Int Assoc Provid AIDS Care 16(3): 309-311.
-
Osunkalu VO, Akanmu SA, Ofomah NJ, Onyiaorah IV, Adediran AA, et al. (2011) Seroprevalence of Toxoplasma gondii IgG antibody in HIV-infected patients at the Lagos University Teaching Hospital. HIVAIDS (Auckl) 3: 101- 105.
-
Galvan RML, Valdez AV, Vargas GG, Jimenez GO, Garcia CC, et al. (1997) Prevalence of IgG and Igm anti-Toxoplasma antibodies in patients with HIV and AIDS. Rev Soc Bras Med Trop 30(6): 465-467.
-
Nissapatorn V, Lee CKC, Cho SM, Rohela M, Anuar AK, et al. (2003) Toxoplasmosis in HIV/AIDS patients in Malaysia. Southeast Asian J Trop Med Public Health. 34(2): 80-85.
-
Shen G, Wang X, Sun H, Gao Y (2016) Seroprevalence of Toxoplasma gondii Infection among HIV/AIDS Patients in Eastern China. Korean J Parasitol 54(1): 93-96.
-
Rezanezhad H, Sayadi F, Shadmand E, Nasab SDM, Yazdi HR, et al. (2017) Seroprevalence of Toxoplasma gondii among HIV Patients in Jahrom, Southern Iran. Korean J Parasitol 55(1): 99-103.
-
Yenilmez E, Çetinkaya RA (2019) Difference in Toxoplasma gondii Seroprevalence Rates Due to Low and High CD4 Counts in Patients with HIV/AIDS. Turkiye Parazitol Derg 43(S1): 1-7.
-
Zakari MM, Isah AY, Offiong R, Yunusa T, Abdullahi IN (2020) Serological survey and risk factors associated with Toxoplasma gondii infection among HIV-infected pregnant women attending Abuja Tertiary Hospital, Nigeria. Malawi Med J 32(3): 160-167.
-
Sajedi HR, Shad BM, Shakib RJ, Roshan ZA, Mahmoudi MR, et al. (2021) Serological Evaluation of Toxoplasmosis and Related Risk Factors Among HIV+/AIDS Patients in Northern Iran. Acta Parasitol.
-
Meisheri YV, Mehta S, Patel U (1997) A prospective study of seroprevalence of Toxoplasmosis in general population, and in HIV/AIDS patients in Bombay, India. J Postgrad Med 43(4): 93-97.
-
Wanachiwanawin D, Sutthent T, Chokephaibultkit K, Mahakittikun V, Ongrotchnakun J, et al. (2001) Toxoplasma gondii antibodies in HIV and non HIV infected Thai pregnant women. Asian Pac J Allergy Immunol 19(4): 291-293.
-
Lindstrom I, Kaddu Mulindwa DH, Kironde F, Lindh J (2006) Prevalence of latent and reactivated Toxoplasma gondii parasites in HIV-patient from Uganda. Acta Trop 100(3): 218-222.
-
Dutta A, Mehta PR, Ingole N (2020) Seroprevalence of Toxoplasma gondii in newly diagnosed HIV seropositive patients. Indian J Med Res 152(5): 515-518.
-
Madi JM, de Souza RD, de Araújo BF, de Oliveira BF, Rombaldi RL, et al. (2010) Prevalence of toxoplasmosis, HIV, syphilis and rubella in a population of puerperal women using Whatman 903® filter paper. Brazilian Society of Infectious Diseases 14(1): 24-29.
-
Sticchi L, Astengoa M, Iavarone IG, Icardi G (2019) Utility of serological screening for measles, mumps and rubella in immunocompromised patients. Hum Vaccin Immunother 15(12): 2854-2855.
-
Taku NA, Ndze VN, Abernathy E, Hao L, Kouomou DW, et al. (2019) Seroprevalence of rubella virus antibodies among pregnant women in the Center and South-West regions of Cameroon. PLoS One 14(11): e0225594.
-
Akinbami AA, Adewunmi AA, Rabiu KA, Wright KO, Dosunmu AO, et al. (2010) Seroprevalence of Toxoplasma gondii antibodies amongst pregnant women at the Lagos State University Teaching Hospital, Nigeria. Niger Postgrad Med J 17(2): 164-167.
-
Ibrahim MK, Ballah AD, Bukar B, Baba GW, Mohammed AT, et al. (2014) Seroprevalence of and risk factors for cytomegalovirus among HIV-infected patients at University of Maiduguri Teaching Hospital, Nigeria. Open Journal of Immunology 4(2): 54-59.
-
Aliyu A, Aminu M, Olonitola SO, Umar M, Tahir IM (2016) Seroprevalence and Molecular Detection of Human Cytomegalovirus in HIV Positive Patients Attending Some Selected Hospitals in Kaduna State, Nigeria. Journal of Advances in Biology & Biotechnology 9(3): 1-22.
-
Manjusha P, Shailja P, Pande RC, Singh KP, Harshita G (2014) Prevalence of cytomegalovirus infection among HIV seropositive patients-case study from North India. International Journal of Innovation and Scientific Research 11(1): 48-52.
-
Neto WC, Rubin R, Shulter J, Giugliana R (2004) Newborn screening for congenital infectious disease. Emerging Infectious Diseases 10(6): 1069-1073.
-
Nishimura N, Kimura H, Rabuta Y, Tanaka N, Ishikawa K, et al. (1999) Prevalence of material cytomegalovirus (CMV) antibody and detection of CMV DNA in amniotic fluid. Medical Immunology 43(8): 781-784.
-
Mugo N, Dadabhai SS, Bunnell R, Williamson J, Bennett E, et al. (2011) Prevalence of herpes simplex virus type 2 infection, human immunodeficiency virus/herpes simplex virus type 2 co-infection and associated risk factors in a national, population-based survey in Kenya. Sex Trans Dis 38(11): 1059-1066.
-
Schaftenaar E, Peters RP, Baarsma GS, Meenken C, Khosa NS, et al. (2016) Clinical and corneal microbial profile of infectious keratitis in a high HIV prevalence setting in rural South Africa. Eur J Clin Microbiol Infect Dis 35(9): 1403-1409.
-
Mark HD, Nanda JP, Roberts J, Rompalo A, Melendez JH, et al. (2007) Performance of focus Elisa tests for HSV-1 and HSV-2 antibodies among university students with no history of genital herpes. Sex Transm Dis 34(9): 681- 685.
-
Tayyebi D, Sharifi S (2010) Seroepidemiology of infection with Herpes Simplex Virus types 1 and 2 (HSV1 and HSV2) among asymptomatic university students attending Islamic Azad University of Kazeroun, southwest of Iran. Iranian Clin Infect Dis 5(2): 84-88.
-
Samie A, Mnisi HP, Ramantswana MN (2017) Prevalence of HSV1 and HSV2 among HIV Patients in Northern South Africa as Determined by Real Time PCR in Urine Samples. American Journal of Infectious Diseases 13(1): 3-12.
-
Auvert B, Ballard R, Campbell C, Carael M, Carton M, et al. (2001) HIV infection among youth in South African mining town is associated with herpes simplex virus-2 seropositivity and sexual behaviour. AIDS 15(7): 885- 898.
-
Santos FC, de Oliveira SA, Setubal S, Camacho LA, Faillace T, et al. (2006) Sero-epidemiological study of herpes simplex virus type 2 in patients with the acquired immunodeficiency syndrome in the city of Niterói, Rio de Janeiro, Brazil. Mem Inst Oswaldo Cruz 101(3): 315- 319.
- Epidemiological Surveillance and Rumors on Social Media
- Awareness and Treatment of Uncontrolled Hypertension in US Overweight/Obese Youths Aged 16–24 Years, NHANES 2021–2023
- Strengthening EPI Through Parental Engagement: Lessons from Dhaka Slums for IA-2030
- Mothers Knowledge of the Prevalence, Causes, Effects, Prevention and Control of Diarrhoea among Children in Ife East Local Government Area, Ile Ife, Osun State, Nigeria
- Covid-19 Reinfections Case Series from October 2023 to October 2024 in A General Medicine Office in Toledo (Spain)
- Water Contact! One Risk Too Many: Risk Factors Associated with Schistosoma haematobium infection in Osun State, Nigeria