Epidemic Curves of COVID-19 Unaffected by Vaccination
For monitoring the SARS-CoV-2 epidemic, the number of patients, that of deaths and the case-fatality rate were plotted in the vertical axis against time in the horizontal axis. Among countries with similar epidemiological curves, there were countries with vaccine coverage lower than 10% and countries with vaccine coverage higher than 60%, i.e. vaccine coverage was not correlated with the number of patients.
Introduction
The epidemic of SARS-CoV-2 that started in late 2019 spread worldwide. Vaccines were developed. As of August 2021, more than 60% of the population was vaccinated in 39 countries with more than 5.25 billion doses worldwide (New York Times August 29, 2021). Though vaccine efficacy was confirmed by clinical trials [1, 2, 3], its effect on ongoing epidemic remains to be verified. I tried to find pairs of countries with similar epidemiological curves with widely different vaccination coverages. Absence of such pairs will confirm the efficacy of the vaccines in stopping the SARS- CoV-2 epidemic.
Data Source
The data used for the present analysis were: Coronavirus disease (COVID-19) Weekly Epidemiological Update (https://www.who.int/emergencies/diseases/novel- coronavirus-2019/situation-reports) for morbidity and mortality in the world; “nhk_news_covid19_prefectures_ daily_data – Microsoft Excel” (https://www3.nhk.or.jp/ news/special/coronavirus/data/) for morbidity and mortality in prefectures in Japan, and “Covid World Vaccination Tracker - The New York Times” (www.nytimes. com/interactive/2021/world/covid-vaccinations-tracker.
html) for vaccination coverage in countries in the world, and NHK’s special site for New Coronavirus (https://www3.nhk. or.jp/news/special/coronavirus/vaccine/progress/) for vaccination coverage in prefectures in Japan.
Epidemiological Curves of SARS-CoV-2 in Japan
Figure 1 shows epidemiological curves of SARS-CoV-2 in different prefectures in Japan. The number of patients/day (P), that of deaths/day (D) and the case-fatality rate (D/P) were plotted in the vertical axis against days starting from 16 January 2020 to 1 November 2021 in the horizontal axis. The name of the prefecture, vaccination coverage (%), and its population size (x1,000) are shown on the upper left of each panel. Hokkaido (panel A), Tokyo (panel B), Aichi (panel C), Osaka (panel D) and Fukuoka (panel E) are highly populated prefectures. Kagoshima (panel F), Aomori (panel G) and Miyagi (panel H) are prefectures with smaller population. There were five epidemic waves in all the prefectures. The waves were synchronized among prefectures. The wave of the deaths emerged 30-40 days after that of the patients. The wave of the patients became larger while the wave of the deaths remained in the similar level: consequently, the wave of the case-fatality D/P became lower indicating emergence of more spreadable less virulent variants [4].
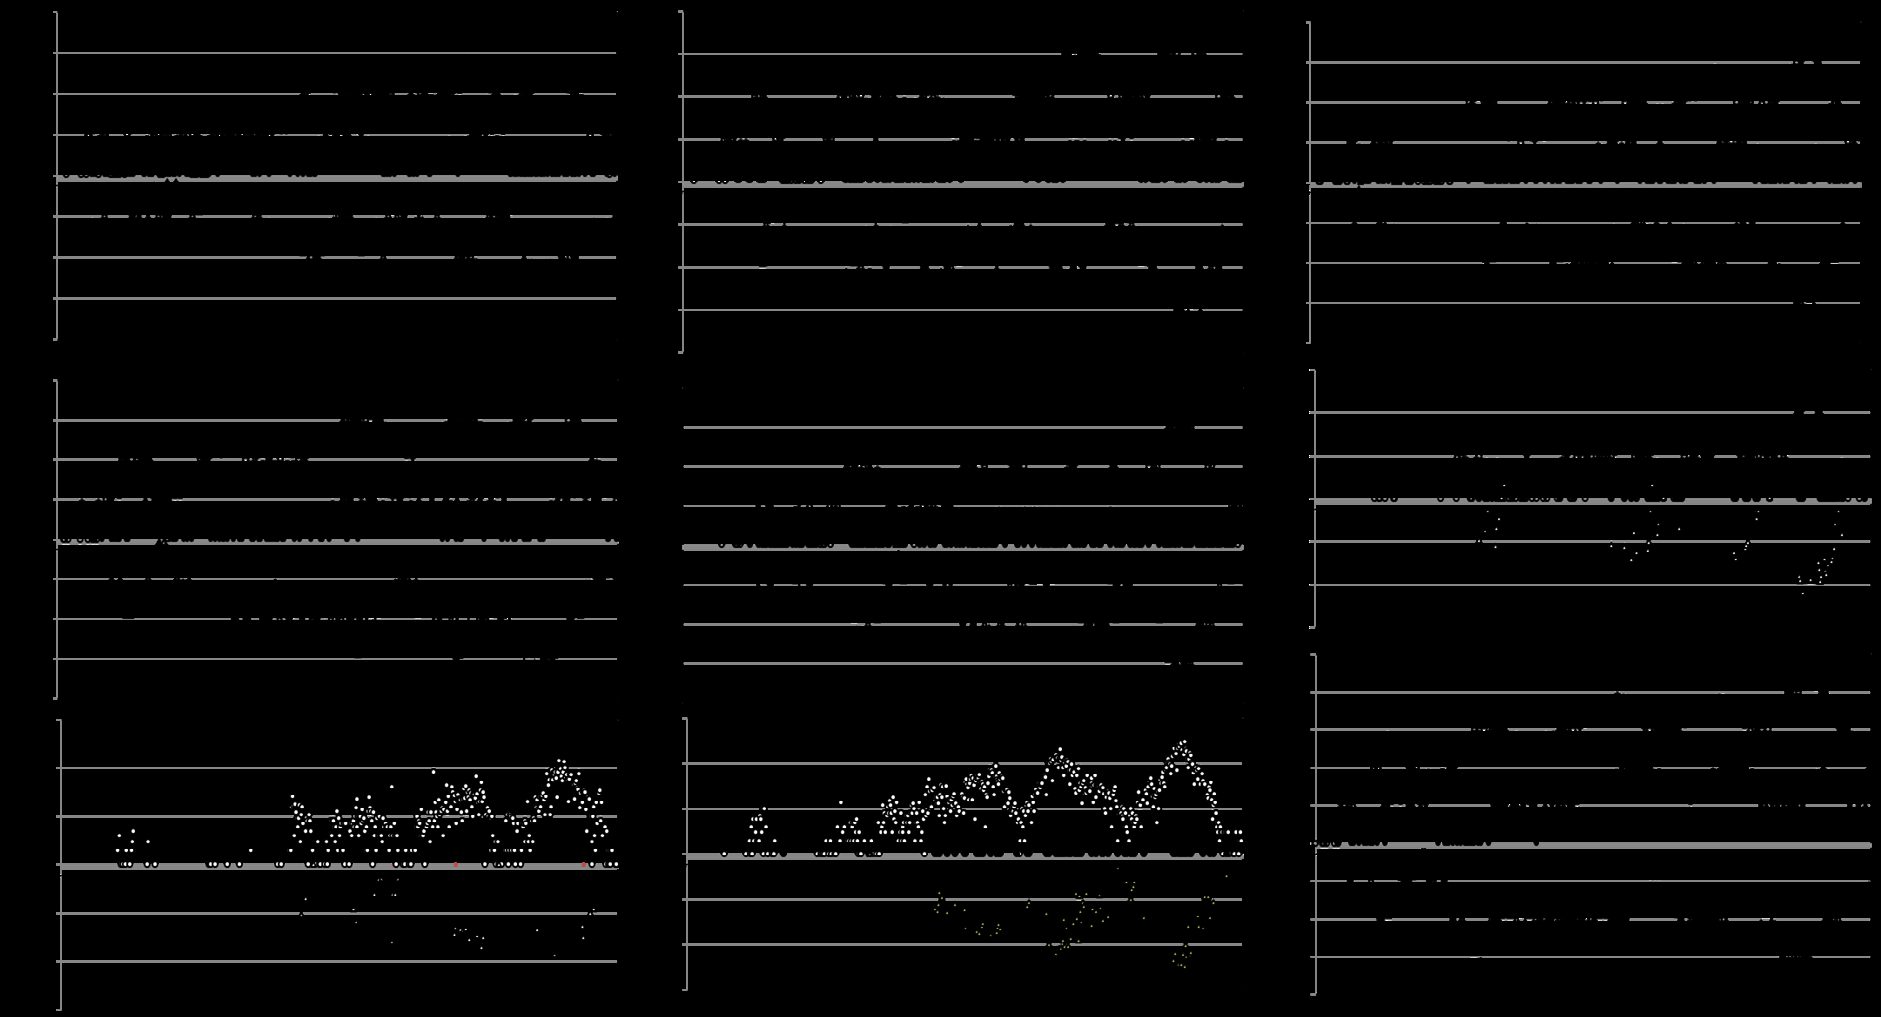
Figure 1: Epidemiological curves of SARS-CoV-2 epidemic of prefectures in Japan. Horizontal axis: days starting from 16 January 2020. Vertical axis: logarithm of the number of the patients (P), that of the deaths (D) and that case-fatality rate (D/P). Prefecture name, vaccine coverage (https://cio.go.jp/c19vaccine_dashboard down loaded on 23 November 2021) and population size (x1,000) (Statistics Bureau, Ministry of Internal Affairs and Communications https://www.stat.go.jp/data/ nihon/02.html down loaded on 23 November 2021) are shown in the upper left of the panels.
In Japan, the vaccination of SARS-Cov-12 started in early May 2021, around day 500 of the epidemic (Fig. 1). By day 612 in mid-September 2021, 50.47% of the population had received two vaccine shots, and by day 656 in early November 2021, 67.75% of the population had been vaccinated (GOVERNMENT CIOS’s PORTAL JAPAN https://cio.go.jp/ c19vaccine_dashboard). As the vaccination coverage was similar among prefectures, vaccine efficacy could not be evaluated by comparing the number of the patients among prefectures with different vaccine coverages. Evaluation by comparing the number of the patients before and after the vaccination was inappropriate because if vaccination is started at the peak of the epidemic, the number of the patients will decline irrespectively of vaccine efficacy.
Epidemiological Curves of SARS-CoV-2 in Countries in the World
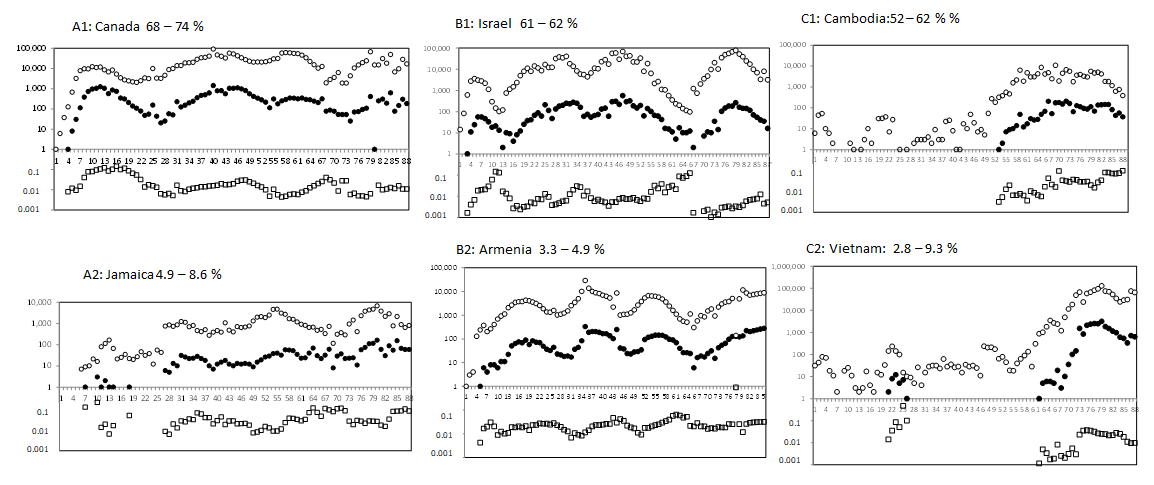
In the world level, vaccination started in December 2020 (around week 45 in Figure 2) according to “WHO Coronavirus disease (COVID-19): vaccines” (https://www.who.int/ emergencies/diseases/novel-coronavirus-2019/question- and-answers-hub/q-a-detail/coronavirus-disease-(covid- 19)-vaccines?adgroupsurvey={adgroupsurvey}&gclid=Cj0 KCQiA-eeMBhCpARIsAAZfxZBhcwTvwwJLRz88ywZyNxvP b4uT9caRoxs_RtwGXxsp4tmb2lDA9sYaAnB_EALw_wcB). I searched for pairs of countries with similar epidemiological curves with widely different vaccine coverages, because presence of such pairs implies that vaccine had little impact on SARS-CoV-2 epidemic. There were such pairs actually. In American region, vaccine coverage of two doses by 3 September 2021 (week 82) and by 18 October in 2021 (week 89) were 53 % and 56 % for Canada (panel A1) but 4.9 and 8.6% for Jamaica (panel A2); in European region, 61 % and 62 % for Israel (panels B1) but 3.3 % and 4.9 % for Armenia (panel B2); and in Western Pacific, 52 % and 62 % for Cambodia (panel C1) but 2.8 % and 9.3% for Vietnam (panels C2). The plot pattern was almost identical between the pairs particularly in the right half of the epidemic curves, which corresponds to the period after the start of the vaccination, Presence of such pairs indicated limited impact of vaccination on SARS-CoV-2 epidemic [5]. It could be attributable to the limited duration, 6-8 months, of immune protection conferred by the vaccine (Centers for Disease Control and Prevention: Science Brief: COVID-19 Vaccines and Vaccination, updated on 15 September 2021, downloaded on 22 September 2021: https://www.cdc. gov/coronavirus/2019-ncov/science/science-briefs/fully- vaccinated-people.html).
Why Are Epidemic Curves Wavy?
The epidemic curves of prefectures are similar to each other and similar to the epidemic curve of Japan as a whole. The epidemic curve is a kind of fractal, because the epidemic curves are characterized by self-similarity and invariance with respect to scaling [6]. As the number of new infections (y) is proportional to the population size (N) (4-5) and to the number of encounters between the infected and the uninfected, the relation is represented by y = kN2x(1-x), where x is fraction of the infected, 1-x fraction of the population to be infected, and k a constant. Plot of the equation in Cartesian space is ⋂-shaped reproducing the shape of the epidemic waves. Succession of the epidemic waves is probably produced by successive emergence of more spreadable variants, such as, α, β, γ and δ (see WHO’s Coronavirus disease (COVID-19) Weekly Epidemiological Update).
Conflict of Interest
None to declare
Acknowledgements
The author’s thanks are due to AIDS Research Centre, National Institute of Infectious Diseases, for providing him with the research space.
References
-
Baden L, El Sahly HM, Essink B, Koyloff K, Frey S, et al. (2021) Efficacy and safety of the mRNA-1273 SARS- CoV-2 vaccine. N Engl J Med 384: 403-416.
-
Swift MD, Breeher LE, Tande AJ, Tammaso CP, Hainy CM, et al. (2021) Effectiveness of messenger RNA coronavirus disease 2019 (COVID-19) vaccines against severe acute respiratory syndrome coronavirus 2 (SARS-CoV-2) infection in a cohort of health personnel. Clin Infect Dis 73(6): e1376-e1379.
-
Tregoning JS, Flight KE, Higham SL, Wang Z, Pierce BF (2021) Progress of the COVID-19 vaccine effort: viruses, vaccines and variants versus efficacy, effectiveness and escape. Nat Rev Immunol 21(10): 626-636.
-
Yoshikura H (2021) Epidemiological correlation between COVID-19 epidemic and prevalence of α-1 antitrypsin deficiency in the world. Glob Health Med 3(2): 73-81.
-
Yoshikua H (2021) Regionality of SARS-CoV-2 epidemic under the influence of prevalence of alpha-1 antitrypsin deficiency: similar case-fatality rate in all the regions but about 10-fold higher number of patients or deaths per population in American and European regions. London Journal of Medical and Health Research 21(3): compilation 10: 1-6.
-
Schroeder M (1991) Fractals, Chaos, Power Laws 1st (Edn.), Dover Publications, Inc. New York, USA, pp: 1-8.
- Epidemiological Surveillance and Rumors on Social Media
- Awareness and Treatment of Uncontrolled Hypertension in US Overweight/Obese Youths Aged 16–24 Years, NHANES 2021–2023
- Strengthening EPI Through Parental Engagement: Lessons from Dhaka Slums for IA-2030
- Mothers Knowledge of the Prevalence, Causes, Effects, Prevention and Control of Diarrhoea among Children in Ife East Local Government Area, Ile Ife, Osun State, Nigeria
- Covid-19 Reinfections Case Series from October 2023 to October 2024 in A General Medicine Office in Toledo (Spain)
- Water Contact! One Risk Too Many: Risk Factors Associated with Schistosoma haematobium infection in Osun State, Nigeria