Polymerase Chain Reaction Positivity Rate for Covid-19 in General Medicine in Toledo (Spain) from May 19 to September 30, 2020. Is it Re-Outbreak, Second Wave of Virus or Lack of Testing?
Objective: Describe the positivity rate of COVID-19 with polymerase chain reaction (PCR) test with the aim of discovering temporal trends that may reflect the local dynamics of the epidemic. Methodology: A retrospective and descriptive study was carried out on patients suspected of COVID-19 diagnosed with PCR, who consulted in general medicine office at a health center in Toledo, Spain, from May 15 to September 30, 2020. Results: 186 patients were included as suspected cases or contacts. There were 56 positives (30%). Its distribution in number of PCR test and positivity rate in % by fortnights from May 15 to September 30, was: 3 (0%); 9 (0%); 1 (0%): 6 (9%); 9 (22%); 19 (47%); 61 (41%); 44 (34%); and 24 (21%). The number of tests needed to find a case varied between 2.1 and 4.8, and the number of tests that should have been done in relation to the number of positives varied between 20 and 250, depending on the time dates. Conclusion: The data are compatible with the existence of a second wave of COVID-19 infections, and an insufficient number of tests performed.
Introduction
At the end of 2019, China reported an outbreak of atypical pneumonia in Wuhan, a large city of 12 million people located along the Yangtse River, 500 km west of Shanghai on the coast. By mid-January 2020, Chinese media announced that a novel coronavirus was responsible for the emerging respiratory illness, named COVID-19. Thousands of people had become sick, and local hospitals collapsed [1]. The severe acute respiratory syndrome coronavirus 2 (SARS- CoV-2) causing of coronavirus disease 2019 (COVID-19), which emerged in the human population at the end of 2019, had already reached pandemic proportions in March 2020 [2, 3]. To date, COVID-19 has caused more than 45 million cases and 1 million deaths worldwide [4].
COVID-19 has hit Spain hard, with more than 800,000 cases, 30,000 confirmed deaths, there have been very important differences between regions within Spain, with Madrid, Castilla-La Mancha and Catalonia in the first places. Possible explanations point to a lack of preparedness for a pandemic (weak surveillance systems, low capacity for polymerase chain reaction (PCR) tests and a shortage of personal protective equipment), a late reaction by central and regional authorities, slowness in the processes of decision-making, high levels of population mobility, lack of coordination between authorities, little dependence on scientific advice, aging of the population, vulnerable groups experiencing social and health inequalities, and lack of preparedness in nursing homes [5, 6].
Around the world, epidemiologists are building short- term and long-term projections to prepare for and potentially mitigate the spread and impact of SARS-coronavirus-2 (SARS- CoV-2), the virus that causes coronavirus disease 2019 (COVID-19). Although their forecasts and timelines vary, the future depends on many unknowns, such as whether people develop lasting immunity to the virus, whether seasonality affects its spread, and the choices made by governments and individuals. In places where blockages are decreasing, it is not known for sure whether the “new normal” of hand washing and the use of masks will be enough to stop the second waves [7]. But, after blockages of different durations outbreaks are observed. As a consequence, many European countries are seeing a recent increase in COVID-19 cases [8].
In regions where COVID-19 appears to be on the decline, researchers say the best approach is careful surveillance testing and isolating new cases and tracing their contacts. Although in many countries asymptomatic people or with mild symptoms are being tested, which has resulted in an increase in the positives detected, there is a real increase in cases in several countries as a result of the relaxation of social distancing measures [8]. But test and trace programs have difficulties [9]. On one side, exactly how much contact tracing and isolation is required to effectively contain an outbreak?. In the other hand, the PCR smear test is useful (but not perfect) for detecting SARS- CoV-2 virus RNA in symptomatic patients. However, problems arise when using the test for purposes that ignore symptoms or timing of infection, i.e. case detection, mass screening, and disease surveillance. People with any symptoms that suggest COVID should be tested, ideally as soon as possible, but given the constant shortage of tests, that may not be possible, especially for those who only require symptomatic care. Ideally, testing of those with known exposures should be done approximately 5 days after exposure, which is the median incubation period [10].
The “positivity rate” is the percentage of tests that are positive. A high percentage usually reveals problems in case detection. However, there are discrepancies on the interpretation of the quantity and test results that are carried out with respect to its interpretation on the epidemic trend [11, 12]. The lack of data on the evolution of the number of COVID-19 cases is a factor that can lead to wrong decisions. Sometimes it is known that cases are increasing, but there is no data to define this as a new outbreak of COVID-19. The figures of new cases with positive tests in people with symptoms who come to the health services can be known, but sometimes the total number of tests carried out is not known. In this way, comparisons of average rates of new infections between different places can generate erroneous interpretations, giving rise to unjustified concerns or, on the contrary, dynamics of the outbreak that would require immediate actions [13].
In this scenario, a study is presented on the positivity rate of COVID-19 with PCR test in cases with suspicious symptoms and contacts, who consulted in general medicine (GM), in Toledo (Castilla-La Mancha, Spain) from mid-May to the end of September 2020, dates when COVID-19 re- outbreaks began to occur after a large reduction in cases, with the aim of discovering temporal trends that may reflect the local dynamics of the pandemic and assessing the significance of this indicator to identify the presence of re- outbreaks, new waves of the virus or lack of diagnostic tests.
Material and Methods
A retrospective and descriptive study of patients clinically suspected of COVID-19 was conducted at a GM consultation in the Santa Maria de Benquerencia Health Center, Toledo, Spain, which has a list of 2,000 patients > 14 years of age (in Spain, general practitioners (GPs) care for people ≥14 years of age, but there may be exceptions requested by the child’s family and accepted by the GP), from May 15, 2020 (date the PCR test could be started on all suspected cases of COVID-19 and some of the contacts of the positive cases) until September 30, 2020.
Suspected Case of SARS-CoV-2 infection was considered as:
- Any person with a clinical picture of Acute Respiratory Infection of sudden onset of any severity that occurs, among others, with fever, cough or feeling of shortness of breath.
- Other symptoms such as odynophagia, anosmia, ageusia, muscle aches, diarrhea, chest pain or headaches, among others, could also be considered symptoms of suspected SARS-CoV-2 infection according to clinical criteria Regarding contacts, from May 15 to August 1, following the protocol of the Health Authorities in Spain, PCR was only recommended for close contacts, and prioritizing vulnerable people, people who care for vulnerable people , partners or health personnel of health or socio-health or essential centers or in certain contexts of high risk of transmission [14]. But, since August 1, tests were started on all close contacts (not casual contact, or contact of contact), defined as: duration more than 15 minutes, less than 2 meters apart, without a mask, and from 48 hours before confirming the positive or the onset of symptoms [15].
This change of criteria in Spain followed the line of the United States CDC which, in August, reversed its initial recommendation that contacts only needed a test if they had a high risk of complications from COVID-19, and recommended testing asymptomatic contacts of people with COVID-19, due to the potential for asymptomatic and presymptomatic transmission [16]. Like other respiratory viruses, the primary diagnosis of coronavirus disease 2019 (COVID-19) is routinely made by detecting PCR of SARS- CoV-2 (oropharyngeal) [17, 18, 19].
The following variables were collected: date of the CRP test, age, sex, and presence of symptoms or asymptomatic (in contacts). When a patient had multiple results, only the first positive test was included. Data were only collected from contacts that were seen in the consultation object of the study. The data of positivity rates found in the GM consultation were compared with the official data for those dates for the province where the consultation is located (Toledo is a Spanish province of the autonomous community of Castilla-La Mancha, with capital in the city homonymous to Toledo, with a population of 687,391 inhabitants), and a protocol for their interpretation was conceptualized.
Results
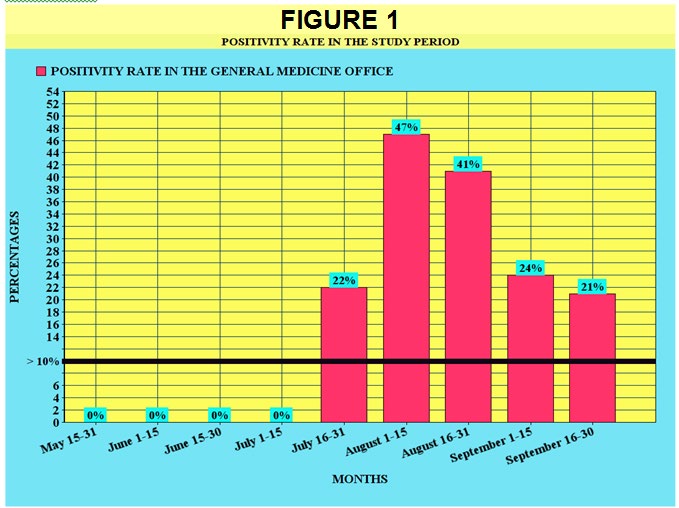
186 patients were included. All had symptoms compatible with a suspected COVID-19 case or contact with a case. All underwent PCR; 56 of them were positive. This means 30% positivity for the entire period studied. Their temporal distribution by fortnights is shown in Figure 1 & Table 1 presents the number of tests performed on suspected cases and contacts and the rate of positivity in the study period. The positivity rates of SARS-CoV-2, what were of 0% in May and June, begin to rise progressively, skyrocketing and reaching its maximum peak in August 1 to August 15, and they decrease very slowly until the end September, where there is still a high figure.
| Number and Percentage of Tests Done in the Consultation on the Population Served (2,000 Patients) | PCR Tests Performed / Positive Tests | Positivity Rate (Level of "Warning Flag">10% *) | Number of PCR Tests per Positive Case ** | Number of Tests that Should have been Performed in Relation to The Number of Positives * | |
|---|---|---|---|---|---|
| May 15-31 | 13 (1%) | 13 PCR, all negative | 0 | - | - |
| June 1-15 | 9 (0.5%) | 9 PCR, all negative | 0 | - | - |
| June 15-30 | 1 (0.05%) | 1 PCR, negative | 0 | - | - |
| July 1-15 | 6 (0.3%) | 6 PCR, all negative | 0 | - | - |
| July 16-31 | 9 (0.5%) | 9 PCR, 2 positive | 22% | 4.5 | 20-60 PCR |
| August 1-15 (contacts begin to test) | 19 (1%) | 19 PCR, 9 positive | 47% | 2.1 | 90-270 PCR |
| August 16-31 | 61 (3%) | 61 PCR, 25 positive | 41% | 2.4 | 250-750 PCR |
| September 1-15 | 44 (2%) | 44 PCR, 15 positive | 34% | 2.9 | 150-450 PCR |
| September 16-30 | 24 (1%) | 24 PCR, 5 positive | 21% | 4.8 | 50-150 PCR |
Table 1: ** Number of Tests Made to Suspicious Cases and Case Contacts and Positivity Rate in the Study Period.
* Indicator that testing is not widespread enough, and that there is massive outbreak of COVID-19. Number of tests needed to find a case. WHO quality criterion: 10-30 tests per confirmed case, as a general benchmark for number of adequate tests. * Data was only collected from contacts that were treated in the consultation object of the study, so the total number of tests actually performed may be higher. Table 1: Number of Tests Made to Suspicious Cases and Case Contacts and Positivity Rate in the Study Period.
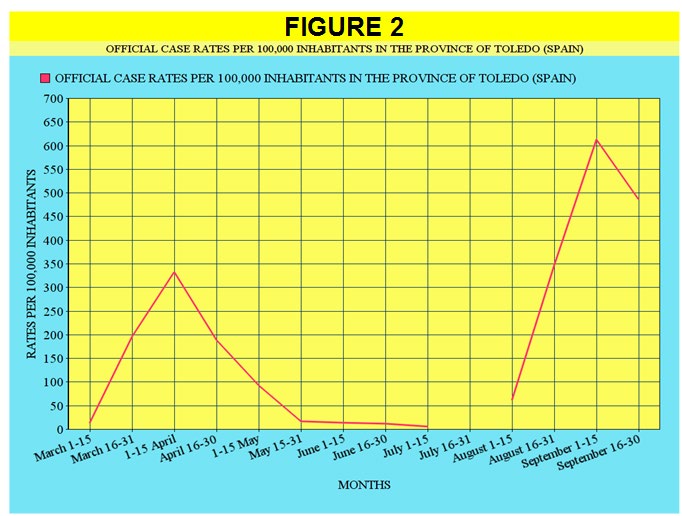
This trajectory of the positivity rates in the study consultation is aligned with the official data of the province (Figure 2), as shown in Table 2, which exposes the comparison of the official rates per 100,000 inhabitants for the province of Toledo (Spain) since the beginning of COVID-19 [20, 21], taking into account that the real data are only those of the second wave, since during the first wave they did not include light or asymptomatic infections who did not undergo PCR. In this way, it was considered that the official data of the “first wave” should be multiplied by at least 3 or 5 or even by 10 to get closer to the real ones, so the size of the waves is reversed (Figure 3).
| Number Of New Official Cases In The Province Of Toledo (Spain) | Official Case Rates Per 100,000 Inhabitants In The Province Of Toledo (Spain) | “Corrected” Rates (Approximation To The Real Or True Figures) Of Cases Per 100,000 Inhabitants In The Province Of Toledo (Spain) | Positivity Rates Of Pcr In The Study’s Consultation (Toledo, Spain) | |
|---|---|---|---|---|
| March 1-15 (March 15, 2020-Start of lockdown in Spain) | 98 | 14 | 70 | - |
| March 16-31 | 1351 | 196 | 980 | - |
| April 1-15 | 1600 | 333 | 1665 | - |
| April 16-30 | 1300 | 189 | 945 | - |
| May 1-15 | 638 | 93 | 465 | - |
| May 16-31 | 114 | 17 | 114 | 0 |
| June 1-15 | 95 | 14 | 95 | 0 |
| June 16-30 (June 21 end of lockdown) | 85 | 12 | 85 | 0 |
| July 1-15 | 43 | 6 | 43 | 6% |
| July 16-31 | Official count change | - | - | 22% |
| August 1-15 | 427 | 62 | 427 | 47% |
| August 16-31 | 2388 | 347 | 347 | 41% |
| September 1-15 | 4211 | 613 | 613 | 34% |
| September 16-30 | 3343 | 486 | 486 | 21% |
Table 2: Comparison of Official Rates Per 100,000 Inhabitants for the Province of Toledo (Spain) Since the Beginning of Covid-19,
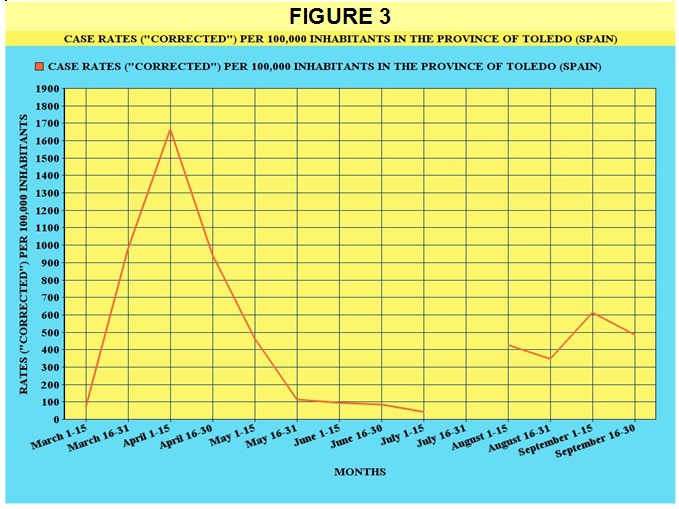
Figure 3: Case Rates (“Corrected”) per 100,000 Inhabitants in the Province of Toledo (Spain). Note: From March to May 15, PCR was only performed on severe cases in the hospital. According to mathematical approximations, the real number of cases should be multiplied by 5. From May 15, all patients with symptoms have been performed PCR. It is only from August 1 that tests also begin to be carried out on contacts of positive cases.
The number of PCR tests per positive case (number of tests needed to find a case) varied between 2.1 and 4.8, and the number of tests that should have been done according to WHO criteria (a minimum of 10 tests per confirmed case, as a point general reference number of adequate tests) ranged between 20 and 250, depending on the time dates.
Regarding the positive PCR, 25 patients (45%) were men, and 31 women (55%); The mean age was 36 years (range: 1-78 years); There were 3 patients>65 years (5%); Eleven people (20%) were asymptomatic (and they were contacts; it should be remembered that not all contact was asymptomatic, nor all the contacts were included in the study -only those contacts of the case who were seen in the consultation object of the study were incorporated, but these were probably the majority), with a mean age of 25 years (range 3-51) (Table 3).
| PCR Test Number | POSITIVITY RATE (“warning flag”> 10%: Indicator that the tests are not sufficiently extended and of massive outbreak of COVID-19) | ||
|---|---|---|---|
| High | High | Low | |
| Re-outbreak / new virus wave | Controlled epidemic situation | ||
| (Exceeding the threshold of 10 to 30 tests per confirmed case or greatly increasing the pre- test probability) | |||
| Low | COVID-19 cases are escaping. It is being detected poorly, or few patients with suspicious symptoms consult; In any case, infections are escaping, another way of acting must be found to detect more cases: random tests in the community, in workplaces, etc. | Undetermined situation - other sources of data must be sought to interpret the epidemiological situation (serology data, mobile phones, wastewater ...) |
Table 3: Conceptualization of a Protocol for the Interpretation of the Positivity Rate.
Discussion
Epidemic Waves
There is no exact technical definition of what an epidemic wave is or is not. A wave implies a rise in the number of sick individuals, a definite peak, and a decline. The question of whether there are first and second waves, or whether they are ups and downs of the same wave, is difficult to decide. For the WHO, the COVID-19 pandemic behaves like a single great wave that rises and falls [22]. However, if after a peak the number of infections there are an almost total decrease, it is possible to speak of a wave [23, 24].
In our study, in the context of Toledo (Spain) a second wave can be clearly observed during the months of July- September, after a large decrease in cases of the first wave (March-June 2020), and the lifting of social confinement measures. In reality, this was the expectation during the summer months, with more people travelling and creating new chains of transmission [25, 26]. As Europe reopens, COVID-19 cases have accelerated almost everywhere, leaving countries in a battle to control outbreaks before undoing months of hard-earned progress [11, 27, 28]. On the other hand, the transmission pattern in Latin America is different from that in Europe. In Latin America they seem to have given rise to waves whose evolution is slower and more extended over time, which gradually grow without reaching a defined maximum height, at least when the cases are counted at the national level. This is most likely due to the fact that the control measures have been sufficient to prevent exponential growth, but insufficient to reduce the basic reproductive number below 1 [23].
Spain is reporting 10,000 cases a day, more than it had at the height of the outbreak in the spring. France has once again reported thousands of cases a day. In Germany, the numbers are still low, but are constantly increasing. The pandemic is affecting countries that saw few cases in the spring, such as Greece and Malta, but it is also rebounding in places that suffered terribly, including the cities of Madrid and Barcelona. In short, the number of weekly infections in Europe is higher now than in the first peak of March [11, 29, 30]. It has been speculated that in many countries, the resurgence is driven by “young people who are living their lives in a normal way”, because new cases are younger [26]. This situation also seems to be shown in our study, with a mean age of the positive cases of 36 years, and with only 5% of patients>65 years.
Although, at first glance, the numbers of second wave infections could be higher than in the first wave, this is a confusion of terms; one factor of course is increased testing: many countries did not have the capacity to conduct such high-volume testing at the beginning of the year. But, also, in Spain, where PCR was not performed, but rather seriously ill patients in hospitals, the official figures were only a “minimal morbidity”, since they did not include light infections, nor asymptomatic who did not have a PCR test. In this way, it was considered that the official data of the “first wave” should be multiplied by at least 3 or 5 or even by 10 to get closer to the real ones [31, 32, 33, 34], so the size of the waves is reversed [35].
Regarding Spain, specialists point to a precipitous de- escalation as the cause of the outbreaks and insist that the solution lies in tracing and improving data management [36]. Seroprevalence surveys that measure antibodies have shown that at most only about a fifth of people have antibodies to SARS-CoV-2. So, the pandemic will not end until we reach a level of herd immunity, either through naturally- occurring immunity and/or vaccination. Until then, testing and contact tracing remain essential public health strategies [37, 38, 39, 40, 41]. However, the “second wave” once the blockade is removed it is not happening in all places. The question is why [38]. On the contrary, other places are already facing their “third wave” [42]. In our study, if a second wave can be clearly described, beginning approximately four weeks after removing the blockage.
Re-Shoots or Second Waves. The Importance of the Total Number of PCR Performed
When cases are observed to be increasing, the word “outbreak” or “re-outbreak” or “epidemic wave” could be used. The problem can arise when only the “infection rate” (cases per 100,000 people) of one place is known compared to others, so that only this data can give rise to unnecessary worries or a false peace of mind, if it is not known, in addition to the positive results, the total number of tests performed for each location. The evidence for the increase in the outbreak may be limited, in part, by the artificial fact of the increase in the availability of test. It should be noted that high levels of test may not explain the increase in cases. When the ratio of positive PCR tests to all tests performed is increasing, this suggests a genuine increase in the number of new infections [13].
This dynamic is verified in our study, where the percentage of positives over the total tests (positivity rate), went from zero in May and June (the lifting of the quarantine at the national level occurred on June 21, 2020), to 22% at the end of July, and 47% in the middle of August (the peak of the second wave; it can be estimated in 8-10 weeks for the peak of the outbreak since the lifting of the blockade), maintaining and subsequently decreasing slightly to 41%, 38%, and 21% at the end of September, this is probably due to the fact that the control measures have been sufficient to prevent exponential growth, but insufficient to reduce the basic reproductive number by below 1 [23].
Test System, Trace. Is it Being Detected Eell? Is the Outbreak Out of Control?
The test is our window to the pandemic and how it is spreading. Without evidence we have no way of understanding the pandemic. The tests allow us to identify infected people, guiding the medical treatment they receive. It allows the isolation of the infected and the tracking and quarantine of their contacts. And it can help allocate medical and staff resources more efficiently [43]. For some places, after the first wave of COVID-19, an elimination strategy has been advocated, or of “COVID zero” (that it requires strict quarantine measures and border closures) and a tracing and isolation system to “suppress” localized outbreaks [25].
While the virus spread largely undetected in February, widespread testing now reveals its movements. Less than 3% of tests have been reported to be positive in most European countries, a sign of healthy testability. The WHO suggests that a country cannot bring the coronavirus under control until less than 5% of tests are positive. It has been reported that by September 11, 2020, in Spain, the rate of positive PCR tests is around 11% [44]. But our study, for Toledo (Spain) shows 30% positivity for the entire period studied.
One of the keys to slowing the spread of the virus is to perform PCR testing on as many people as possible who have been in contact with infected people. But the average number of potential cases that Spain manages to track is, for example, lower than that of Zambia (9.7 for each confirmed case of COVID-19), a quarter than that of Italy (37.5 for each confirmed case of COVID-19) and a twentieth that of Finland (185 for each confirmed case of COVID-19) [45].
In this context, the GP will play a key role in controlling outbreaks of the COVID-19 pandemic: detecting suspected cases as early as possible and conducting tests to confirm new infections so that transmission chains can be shortened [46]. In any case, a pure test, trace and isolation strategy is probably not feasible, nor totally useful in isolation from other measures in most countries, and a degree of social distancing, would be a tool for public health needed to mitigate the COVID-19 pandemic [47, 48].
Positivity Rate
As more and more people are being tested, the focus is shifting to the positivity rate: how many of the people tested are actually infected?. The positivity rate is the percentage of tests that are positive (number of tests per confirmed case) and aims to answer the question: How many tests does it take to find a case?. In our study, it is evident that by August 2020 transmission was not decreasing due to the increase in cases produced. The same pattern could be observed in Spain at that time, where there were more cases than in other comparable European countries.
A key question is: Are enough tests being done to monitor the outbreak? In order to adequately control the spread of the virus, countries with more widespread outbreaks need more testing. So an important way to understand whether countries are testing enough is to look at the proportion of tests that return a positive result, known as the positive rate. There are huge differences between countries. Some countries, such as Australia, South Korea, and Uruguay have a positive rate of less than 1%: hundreds or even thousands of tests are needed to find a case in these countries. Others, like Mexico and Nigeria, have positive rates of 20% to 50% or even more. In these countries, one case is found for every few tests performed. Countries with a very high positive rate are unlikely to test extensively enough to find all cases [43]. In other places such as Italy, a drop in the number of daily cases of coronavirus has been reported despite increased testing [30].
In our study, there are very high positivity rates at the peak of the second wave, and a high number of tests, which should be interpreted as confirmation of a re-outbreak, although certainly not all cases were found, as the number of tests was not sufficiently increased. One might think that “a large part” of the increase in cases is due to the increase in diagnostic capacity (the number of tests), but the data do not support this statement. Few tests are done in May and June because there are few patients; since the end of July there are more patients, and more tests have to be done. In addition, the increase in the positivity rate is a bad sign because it suggests that fewer tests are done to rule out infections and more to confirm them. The same dynamic has been described for the whole of Spain [49].
A positivity rate below 7.2% has been reported to be a good number; if the positivity test rate is greater than 10%, it is one of those red flags (the “warning flag” level). The increase in the positivity rate means a higher percentage of the infected population. Rates depend really on how many people are being tested and who is being tested. If tests are done only on people who are fairly certain they have the disease, there will be a high positive rate. If 10 times more than suspect people are tested and many of them are not infected, then the positivity rate will decrease. For other experts, high data for the positivity rate may also indicate that insufficient testing is being done. Some scientists have suggested that this 10% mark is really relevant as an indicator that the tests are not sufficiently widespread and that there is really not a good handling of the situation. While a 0% positivity rate would be ideal, the goal may be to get it below 10% [50, 51, 52].
Another way of looking at the scope of testing relative to the scale of the outbreak is to ask: How many tests are done to find a COVID-19 case? It is simply the inverse of data on the positive rate. It is unlikely that where very few tests are done per confirmed case, they will do so broadly enough to find all cases [43]. The WHO has suggested around 10 to 30 tests per confirmed case as a general benchmark of adequate testing. In general, when the tests are carried out quite extensively, it has been found that between 3 and 12% of the tests are positive. Thus, the level of ten negative tests by one positive is proposed as a general benchmark of a system that is doing enough tests to collect all cases [53]. Thus, the WHO percentage of positive PCR should be less than 5% to consider that the epidemic is being controlled [54]. At the end of March, during the worst of the pandemic, the positivity rate in Spain was 28.2%, which indicated that only those people with a high probability of having the infection were being tested [31, 32]. In our study, the positivity rates during the rise, peak, and subsequent plateau suggest that not enough tests are being done to find all cases, as the number of tests is not sufficiently increased.
The use of pre-test probability among the evaluated subjects has been proposed to know the sufficiency of the test availability instead of the number of tests. Pre- test probability means the “level of suspicion”, of having coronavirus among the tested subject [55]. In our study, all patients who consulted the GP with suspicious symptoms of COVID-19 were included. While a wide range of symptoms can accompany the coronavirus, the majority of patients exhibited one of three symptoms: fever, cough, and shortness of breath [56, 57].
Thus, in our study, PCR was performed on all suspected cases at the general medical level, which greatly increased the pre-test probability. Thus, the conclusion of having missed cases for not performing the necessary number of tests would be nuanced. In the United States, some lawmakers have focused on the positive coronavirus test rate among the general population, with some saying it must be below 3 percent to safely reopen schools. But most places have much higher positive rates: 7 percent for the entire United States, 8 percent for Spain, and more than 40 percent for some Latin American countries [12, 58].
Testing Accuracy: the Main Problem is False Negatives
There is broad consensus that widespread testing for SARS-CoV-2 is essential to safely reopen a country. A
major concern has been the availability of the tests, but the precision of the tests can be a major problem in the long term [59].
PCR diagnostic tests involving a nasopharyngeal swab can be inaccurate in two ways. A false positive result mislabels an infected person, with consequences including unnecessary quarantine and contact tracing. False negative results are more problematic because infected people, who may be asymptomatic, may not be isolated and can infect others. If the SARS-CoV-2 diagnostic tests were perfect, a positive test would mean someone carries the virus and a negative test would not. With imperfect tests, a negative result just means that a person is less likely to become infected. In our study, the PCR tests were the standard of the Regional Health System of Castilla-La Mancha, but the Health Authorities do not routinely report their sensitivity and specificity. In any case, to calculate the probability, you can use Bayes’ theorem, which incorporates information about the person and the precision of the test. Any result of a diagnostic test should be interpreted in the context of the probability of disease prior to the test. The pre-test probability may depend on the local prevalence of Covid-19, history of exposure to SARS-CoV-2, and symptoms. While the exact sensitivity and specificity of RT-PCR tests for COVID-19 is unknown, it appears that a positive test is highly suggestive of true COVID-19 [60, 61].
But, if the pre-test probability is too high (above 50%, for example), the test loses its value because negative results cannot reduce the probability of infection enough to reach the threshold. Negative results, even on a highly sensitive test, cannot rule out infection if the pre-test probability is high. It is possible that multiple simultaneous or repeated tests may exceed the limited sensitivity of a single test; however, these strategies need validation [60, 62]. In summary, a positive RT-PCR test for the covid-19 test carries more weight than a negative test due to the high specificity of the test but moderate sensitivity [10, 63]. However, it must be remembered that since the sensitivity of molecular detection depends on the severity of the disease, the type of sample and the time of sampling during the course of infection [17, 19].
Due to the sensitivity of the test, a single strand of viral RNA can be detected, but this does not necessarily mean that someone is infected or contagious. This can be a problem in general population screenings, where many of these people may have had an active infection a few weeks ago and still carry the RNA in their nasal swabs, but less in the context of clinically suspicious cases in GM, as in our study [61]. On the other hand, false positive results from the COVID-19 swab test could be increasingly likely in a future context of the low prevalence of the virus in the population. When there is a low pre-test probability, positive results should be interpreted with caution and a second sample should be tested for confirmation [61].
Conclusion
Our study shows data compatible with the existence of a second wave of COVID-19 infections, and an insufficient number of tests performed, especially in contact tracing. In the current context of GM in Toledo (Spain) our data showed re-growth that becomes a second wave of the virus in August, and that is still maintained but slightly decreasing at the end of September. This trajectory is aligned with the official data of the province. The positivity rates suggest that not enough tests are being done to find all cases, as the number of tests is not sufficiently increased. Although the fact of being done in GM on all suspected cases that they consulted greatly increased the probability prior to the test. Probably the proper tests were not done in the contact tracing. It can be conceptualized, considering a level of “warning flag”>10% (Indicator that the tests are not widespread enough and massive outbreak of COVID-19) that if the positivity rate is high and the number of PCR tests is low: the COVID-19 cases are escaping; If the positivity rate is high and the number of tests is high (exceeding the threshold of 10 to 30 tests per confirmed case or greatly increasing the pre-test probability): we are facing a re-outbreak/new virus wave. A pure test, trace, and isolate strategy is probably not feasible in most contexts, and a degree of social distancing guided by reliable surveillance data may be required to achieve a low and stable infection rate until a level is reached herd immunity, either through naturally occurring immunity and or vaccination.
References
-
Huang C, Wang Y, Li X, Ren L, Zhao J, et al. (2020) Clinical features of patients infected with 2019. novel coronavirus in Wuhan, China. Lancet 395(10223): 497- 506.
-
Cucinotta D, Vanelli M (2020) WHO Declares COVID-19 a Pandemic. Acta Biomed 91(1): 157-160.
-
Guan WJ, Ni ZY, Hu Y, Liang WH, Ou CQ, et al. (2020) Clinical Characteristics of Coronavirus Disease 2019 in China. N Engl J Med 382(18): 1708-1720.
-
Coronavirus COVID-19 Global Cases by the Center for Systems Science and Engineering (CSSE) at Johns Hopkins.
-
Basteiro AG, Dardet CA, Arenas A, Bengoa R, Borrell C, et al. (2020) The need for an independent evaluation of the COVID-19 response in Spain. The Lancet 396(10250): 529-530.
-
Soriano V, Barreiro P (2020) Why such excess of mortality for COVID-19 in Spain?. Ther Adv Infect Dis 7: 1-4.
-
Scudellari M (2020) How the pandemic might play out in 2021 and beyond. This coronavirus is here for the long haul-here’s what scientists predict for the next months and years. Nature 584: 22-25.
-
(2020) Coronavirus disease 2019 (COVID-19) in the EU/ EEA and the UK-eleventh update. ECDC.
-
Deeks JJ, Brookes AJ, Pollock AM (2020) Operation Moonshot proposals are scientifically unsound. BMJ 370: 3699.
-
Scudder L (2020) Diagnostic Testing for COVID-19: A Quick Summary for PCPs. Medscape.
-
Ojeda D (2020) The positivity rate increased in all the Autonomous Communities in the last month except in Extremadura. Aragon and Catalonia suffer the highest increases, but the rise is widespread throughout the country. At the national level, it quadrupled in a month, although it remains at an acceptable level. El Confidencial.
-
Díaz S (2020) New coronavirus infections soar to 1,153 in the last 24 hours. El Confidencial.
-
Wise J (2020) Leicester lockdown: could better data have prevented it?. BMJ 370: 3028.
-
(2020) Estategia precoz, detection and control of COVID-19 Act 9 July 2020. Ministerio Sanidad. España.
-
You need to identify and contact COVID-19. Activate your case on 13.05.2020. Direct General of Salud Public, Calidad and Innovacin. Center for Coordinates Alertas and Emergencies Sanitarias. España.
-
(2020) Overview of Testing for SARS-CoV-2 (COVID-19). CDC.
-
Liu Y, Yan LM, Wan L, Xing TX, Le A, et al. (2020) Viral dynamics in mild and severe cases of COVID-19. Lancet Infect Dis 20(6): 656-657.
-
Corman VM, Landt O, Kaiser M, Molenkamp R, Meijer A, et al. (2020) Detection of 2019 novel coronavirus (2019-nCoV) by real-time RT-PCR. Euro Surveill 25(3): 2000045.
-
Zhang W, Du RH, Li B, Zheng XS, Yang XL, et al. (2020) Molecular and serological investigation of 2019-nCoV infected patients: implication of multiple shedding routes. Emerg Microbes Infect 9(1): 386-389.
-
(2020) Sanidad Castilla La Mancha Nº Casos nuevos PCR.
-
Alonso JL (2020) Toledo. Coronavirus Today: Updated Information on COVID-19.
-
Rojido MC (2020) Spain facing a second wave of COVID-19?. Medscape.
-
Loewy MA (2020) From the “cuareterna” to the eternal wave: why was the peak in Latin America delayed so much?. Medscape.
-
Mahase E (2020) Sixty seconds on waves. BMJ 370: 3074.
-
Torjesen I (2020) Covid-19: Should the UK be aiming for elimination?. BMJ 370: 3071.
-
Kupferschmidt K (2020) Can Europe tame the pandemic’s next wave?. Science 369(6508): 1151-1152.
-
Pollet M (2020) Coronavirus second wave: Which countries in Europe are experiencing a fresh spike in COVID-19 cases?. Euronews.
-
(2020) A second wave of coronavirus across Europe. The New York Time.
-
Limón R (2020) Spain is already the country with the most infections in Western Europe, according to Johns Hopkins University. El País.
-
(2020) Latest news of the coronavirus in Spain and in the world, live | Covid-19 infections exceed 19.6 million and more than 726,000 deaths are registered. El País.
-
Turabian JL (2020) Micro-Impact of the Pandemic by Covid-19 in the General Medicine: Clinical and Epidemiological Reflections from the Situation in Spain March 2020. Epidemol Int J 4(2): 1-11.
-
Turabian JL (2020) Clinical-Epidemiological Characteristics That May Help the General Practitioner to Consider Covid-19 Diagnosis in Acute Respiratory Infections When Diagnostic Tests Are Not Accessible. Epidemol Int J 4(2): 1-10.
-
Turabian JL (2020) The Epidemiological Hypothesis of “The Trojan Horse”: Were Hospitals the Main Vectors of the Exponencial Beginning of Coronavirus Disease 2019 (Covid-19) in Spain and other Countries?. Epidemol Int J 4(3): 1-6.
-
Turabian JL (2020) Incidence Rate of Acute Respiratory Infections in General Medicine as a Tool to Correcting Official Data of Covid-19 in Places where the Tests of Polymerase Chain Reaction are not Accessible. Epidemol Int J 4(1): 1-11.
-
Ruíz Téllez A (2020) Listen! where we are? I’m lost. (1st part). Health, money and primary care.
-
Güell O (2020) The second wave of the virus hits Spain: 11 experts analyze its dramatic progress and how to stop it. El País.
-
Turabian JL (2020) Uncertainties in Preliminary Seroprevalence Estimation of Sars-Cov-2. Looking at the Whole Covid-19 Iceberg. Implications for General Medicine. Epidemol Int J 4(2): 1-11.
-
Doshi P (2020) Covid-19: Do many people have pre- existing immunity?. BMJ 370: 3563.
-
Eckerle I, Meyer B (2020) SARS-CoV-2 seroprevalence in COVID-19 hotspots. The Lancet 396(10250): 514-515.
-
Bhopal RS (2020) To achieve “zero covid” we need to include the controlled, careful acquisition of population (herd) immunity. BMJ 370: 3487.
-
Britton T, Ball F, Trapman P (2020) A mathematical model reveals the influence of population heterogeneity on herd immunity to SARS-CoV-2. Science 369(65050): 846-849.
-
Hurtado LM (2020) Iran is riding the third wave of the pandemic looking for a vaccine. The country emulates what happened in South Korea and Hong Kong, with the infections triggered. El Mundo.
-
Hannah Ritchie, Ospina EO, Beltekian D, Mathieu E, Hasell J, et al. (2020) The positive rate: Are countries testing enough to monitor their outbreak? Coronavirus (COVID-19) Testing. Statistics and Research.
-
(2020) A world news agency warns of the risk posed by the “great experiment” that Spain is doing with the virus. The HuffPost.
-
Jiménez D (2020) There’s a Simple Reason Spain Has Been Hit Hard by Coronavirus. Spaniards did their part, staying home and wearing masks. But politicians quarreled among themselves and repeated the mistakes of the first wave of the virus. The New York Times.
-
Sutter A, Llor C, Maier M, Mallen C, Tatsioni A, et al. (2020) Family medicine in times of ‘COVID-19’: A generalists’ voice. Eur J Gen Pract 26(1): 58-60.
-
Lytras T, Tsiodras S (2020) Lockdowns and the COVID-19 pandemic: What is the endgame?. Scand J Public Health 1-4.
-
Kucharski AJ, Klepac P, Conlan AJK, Kissler SM, Tang ML, et al. (2020) Effectiveness of isolation, testing, contact tracing, and physical distancing on reducing transmission of SARS-CoV-2 in different settings: a mathematical modelling study. Lancet Infect Dis 20(10): 1151-1160.
-
Llaneras K, Galocha A (2020) What do the August data say about the new expansion of the coronavirus in Spain?. El País.
-
Champagne SR, Najmabadi S (2020) Texas’ coronavirus positivity rate exceeds “warning flag” level Abbott set as businesses reopened. The Texas Tribune.
-
Waldrop T (2020) Coronavirus positivity rate: What the term means. CNN.
-
Randhawa AK, Fisher LH, Greninger AL, Li SS, Andriesen J, et al. (2020) Changes in SARS-CoV-2 Positivity Rate in Outpatients in Seattle and Washington State, March 1-April 16, 2020. JAMA 323(22): 2334-2336.
-
(2020) COVID-19-virtual press conference-30 March 2020. WHO.
-
Ojeda D (2020) Spain exceeds the threshold of 5% positives set by the WHO. El Confidencial.
-
Suzuki S (2020) Positive Rate Is Useful to Evaluate the Sufficiency of RT-PCR Test Availability for COVID-19. Preprints.
-
Ellis R (2020) CDC Says Three COVID-19 Symptoms Are Most Common. Medscape.
-
Turabian JL (2020) Coronavirus Disease 2019 (COVID-19) in General Medicine: A Clinical-Epidemiological Case Series Reporting of 16 Patients in Toledo (Spain), March- May 2020 also in Covid-19, “If you Hear Hoofbeats, Think Horses not Zebras. Epidemol Int J 4(1): 1-10.
-
Bennhold K (2020) Schools Can Reopen, Germany Finds, but Expect a ‘Roller Coaster’. The New York Times.
-
Guglielmi G (2020) The explosion of new coronavirus tests that could help to end the pandemic. Researchers are scrambling to find other ways to diagnose the coronavirus and churn out millions of tests a week-a key step in returning to normality. Nature 583: 506-509.
-
Zitek T (2020) The Appropriate Use of Testing for COVID-19. Western J Emerg Med 21(3): 470-472.
-
Surkova E, Nikolayevskyy V, Drobniewski F (2020) False- positive COVID-19 results: hidden problems and costs. Lancet Respir Med.
-
Woloshin S, Patel N, Kesselheim AS (2020) False Negative Tests for SARS-CoV-2 Infection-Challenges and Implications. N Engl J Med 383: 38.
-
Watson J, Whiting PF, Brush JE (2020) Interpreting a covid-19 test result. BMJ 369: 1808.
- Epidemiological Surveillance and Rumors on Social Media
- Awareness and Treatment of Uncontrolled Hypertension in US Overweight/Obese Youths Aged 16–24 Years, NHANES 2021–2023
- Strengthening EPI Through Parental Engagement: Lessons from Dhaka Slums for IA-2030
- Mothers Knowledge of the Prevalence, Causes, Effects, Prevention and Control of Diarrhoea among Children in Ife East Local Government Area, Ile Ife, Osun State, Nigeria
- Covid-19 Reinfections Case Series from October 2023 to October 2024 in A General Medicine Office in Toledo (Spain)
- Water Contact! One Risk Too Many: Risk Factors Associated with Schistosoma haematobium infection in Osun State, Nigeria