Assessing the Accuracy of Refractive Prediction of Different IOL Formulas in Medium Long Eyes
Purpose: To evaluate and compare the prediction errors (PE) between seventeen different IOL power calculation formulas in medium long eyes (>25mm). Design: Retrospective study. Setting: Public hospital in Victoria, Australia. Methods: Medical records of uncomplicated cataract surgery patients from 2008-2019 with axial length of >25mm were collected. The post-operative refraction for each patient was noted and the PE was calculated for each of the 17 different formulas. Mean, median, and absolute prediction errors (MPE, MedPE, APE respectively) and standard deviation (SD) was calculated. Results: 106 patients (106 eyes) were included in the study. Okulix showed the lowest MedAPE (0.224), and SRK-T had the highest (0.400). The SD for Okulix and Olsen PO formulas was the lowest. After reducing the mean to zero, the MedAPE of all formulas ranged from 0.155 to 0.379 and Okulix and Olsen PO had the lowest APE and SD (0.155±0.164 and 0.169±0.168 respectively). Furthermore, Okulix formula has the most patients with APE of within ± 0.25D (42%) and Olsen PO and Okulix have the least number of patients with APE of > ±1.0D (2%). Conclusion: Okulix and Olsen PO formulas have the MedPE closest to zero with smaller standard of deviation then the rest of the formulas. The Barrett U2, EVO, Haigis, Hill RBF 3.0, Holladay 2 NLR, Kane, K6, Okulix, Olsen Lenstar, Olsen PO, Pearl DGS, T2 formulas tend to have more myopic MPE.
Abbreviations
ACD: Anterior Chamber Depth; AD: Aqueous Depth; AXL: Axial Length; IOL: Intraocular Lens; WTW: White-To-White.
Introduction
Modern-day cataract surgery has gradually transformed into a refractive procedure with a high demand for spectacle independence. To improve the post-operative refractive outcomes, there has been an ongoing attempt to increase the accuracy of the intraocular lens (IOL) power calculation formulas [1, 2, 3]. Over time, there has been a remarkable change in the IOL power calculations from simple first and second generations formulas like SRK-I and SRK-II, in which the effective lens position was constant for each patient, to third (SRK/T, Holladay 1, Hoffer Q), fourth (Haigis, Holladay 2, Hill-RBF) and fifth generation formulas (Barrett Universal II, Olsen) [4]. In these newer formulas, the effective lens position is determined for each individual eye by using multiple biometry variables including keratometry, axial length (AXL), pre-operative anterior chamber depth (ACD), white- to-white diameter (WTW) and lens thickness (LT) which predict the IOL power with better precision and accuracy [5]. Ray tracing is a promising approach to calculating IOL power which is the basis of the Olsen and Okulix formula [6]. Formulas derived using artificial intelligence (Pearl DGS, Kane) are also growing in popularity [4].
Despite these advances, accurate prediction of IOL power in myopic eyes still poses a challenge with higher probability of attaining a postoperative hyperopic surprise. Precise AXL measurement preoperatively is of particular significance as they account for 54% of prediction errors in IOL power calculations [7]. Several studies have been designed to measure and compare the accuracy of different formulas in long eyes [8, 9, 10, 11, 12, 13]. In our study, we aim to evaluate and compare the absolute prediction errors between seventeen different IOL power calculation formulas for medium long eyes (>25mm) and to analyse the correlation between the median absolute error (MAE) provided by different formulas and multiple biometric variables like AXL, keratometry, and ACD.
Patients and Methods
Our study is retrospective data collection for cataract surgery performed at a tertiary Ophthalmology centre.
Local ethics approval was sought from the hospital ethics committee for data collection and the tenets of the declaration of Helsinki were followed. Medical records of patients from January 2008 to July 2019 with AXL >25mm that underwent uncomplicated cataract surgery at our centre were reviewed. In patients with both AXL >25mm, one eye was randomly selected in the study due to the correlation between eyes [14].
The inclusion criteria were as follows: (1) Biometric measurements (AXL, K1K2, ACD) assessed by LenStar 2 (Haag-Streit International, Switzerland, LS 900). (2) Had undergone pre-operative and post-operative assessment and subjective refraction at least 3 weeks post- surgery. (3) Cataract surgery performed by phacoemulsification and in-the-bag monofocal lens implantation with 2.4mm clear corneal incision. (4) All eyes implanted with Alcon AcrySof IQ SN60WF intraocular lens. (5) Postoperative BCVA of 6/12 or better at 3+ weeks follow-up.
The exclusion criteria were as follows: (1) Patients with history of any previous intraocular surgery or any intraoperative or postoperative complication (2) Patients with cognitive impairment or pre-existing ocular disease that may impact the post-operative refraction including keratoconus, corneal scarring, amblyopia, glaucoma or any other retinal pathology. (3) Post-operative follow-up of less than one month.
For the study we noted the patients’ demographics, laterality, pre-operative and post-operative subjective refraction, keratometry readings, AXL, ACD, and IOL power from the biometry device.
The pre-operative and post-operative spherical equivalent were determined for each patient [spherical power + ½ cylindrical power].
Formulas and Constant
The predicted refraction values of the implanted IOL, calculated by integrating formulas (Barret Universal II, Haigis, Hoffer Q, Holladay 1, Holladay 2, SRK/T) into the Lenstar were retrospectively recorded.
The EVO, H-2 (2014) (Lens factor (LF) = 5.517), H-2 (NLR) (LF = 5.425), Hill-RBF, Kane, K-6 (LF = 118.930), Olsen – Lenstar (LF = 4.60), Olsen PhacoOptics (LF = 4.59), Okulix, Pearl DGS, T2 (A constant = 118.930), VRF (LF = 5.5170) formulas prediction error were analysed by respective authors.
Evaluation of predicted errors: The predicted refraction rendered by each of the seventeen formulas was noted and the prediction error (PE) was calculated as [actual postoperative subjective refraction – predicted refraction]. The absolute prediction error (APE) is the absolute value of the derived numerical error. A negative numerical value implied a myopic prediction error, whereas a positive numerical value implied a hyperopic prediction error. The subjective post-operative refraction was recorded at least 3 weeks after surgery.
Mean prediction error (MPE), Median prediction error (MedPE), APE and standard deviation (SD) was calculated along with the percentage of eyes that were within ± 0.25D, ± 0.5D, ± 0.75D, ± 1.00D, and > ± 1.00D of predicted refractive error for each formula. To reduce systematic bias, the mean for each formula was adjusted to zero and normalized mean and absolute MPE were calculated. Mean and median absolute errors were then calculated and compared [15].
Further correlations between APE and AXL, Keratometric values, IOL power implanted during surgery, post-operative best corrected visual acuity (BCVA), and ACD were analysed.
Statistical Analysis
In this analysis, the power is the probability the Friedman test can correctly reject the null hypothesis that the absolute zero re-centred prediction errors between different IOL formulas are all the same.
To estimate the power, simulations were conducted based on the natural error distributions of the IOL formulas. Following are the steps:
Simulate the prediction errors of 17 IOL formulas for 100/200/300/……/1,300 sample points based on the associated empirical distributions.
Re-centre the prediction errors to 0 and convert them to absolute prediction errors (APE) Conduct Friedman test to see whether the effects between the IOL formulas are significant (p <= 0.05) for each simulation Repeat step 1-3 5,000 times. Assuming the absolute re- centred prediction errors from seventeen IOL formulas are indeed different, the proportion of simulations that were significant will be the power that the Friedman test can correctly reject the null hypothesis.
Based on this simulation, the estimated power for the analysis with 101 samples (5 outliers excluded) is ~100% to reject the null hypothesis that the absolute zero re-centred prediction errors between different IOL formulas are all the same.
Through the deviation testing, out of 106 samples (1802 data points in 17 IOL formula), 23 outliers were spotted in 5 samples. They were excluded from the analysis data.
The Shapiro-Wilk test and Q-Q plot were used to determine the normality of distribution of data.
Estimated Power vs. Simulation
The estimated powers for all sample sizes are 100%.
Estimated Power vs. Sample Size
The estimated power for the analysis for 101 samples is ~100% to reject the null hypothesis that the absolute zero re- centred prediction errors between different 17 IOL formulas are all the same. The Friedman test was used to determine the statistically significant difference between APE of the different IOL formulas.
Results
A total of 106 patients were included in the study with a mean age of 77.96 ± 9.08 years (range = 46 to 93 years). 57.5% were male patients. The mean ± SD, median and the percentiles of all the variables in this study are tabulated below (Table 1).
| VARIABLE | AVG | MED | SD | MIN | Q05 | Q25 | Q75 | Q95 | MAX |
|---|---|---|---|---|---|---|---|---|---|
| ACD_MM | 3.43 | 3.46 | 0.37 | 2.41 | 2.83 | 3.19 | 3.66 | 4.03 | 4.33 |
| AD_MM | 2.88 | 2.92 | 0.37 | 1.85 | 2.28 | 2.62 | 3.09 | 3.47 | 3.81 |
| AGE | 78.74 | 78.65 | 9.13 | 46 | 61.44 | 73.5 | 84.99 | 92.78 | 93.77 |
| AXL_MM | 25.7 | 25.4 | 0.82 | 25 | 25.02 | 25.15 | 25.93 | 27.36 | 28.84 |
| IOL_D | 15.88 | 16.5 | 3.4 | 6.5 | 8.3 | 14.5 | 18 | 20.5 | 21.5 |
| K1_D | 42.21 | 42.15 | 1.67 | 38.26 | 39.49 | 41.03 | 43.38 | 44.72 | 46.36 |
| K2_D | 43.2 | 43.2 | 1.85 | 39.37 | 40.39 | 41.72 | 44.49 | 46.28 | 48.56 |
| WTW_MM | 12.24 | 12.28 | 0.43 | 11.05 | 11.59 | 11.89 | 12.54 | 12.83 | 13.23 |
Table 1: Shows the mean ± SD, median and the percentiles of all the variables analysed in this study.
Correlation Analysis with Attributes/ Parameters
Between the different variables the correlation index of >0.7 was considered to be strongly associated. Our study shows that - K1 strongly correlated to K2, AXL was correlated to IOL power, and ACD and aqueous depth (AD) were strongly correlated (Supplemental graph 1). Distribution Check Both Shapiro-Wilk test and Q-Q plot suggests that the samples are all normally distributed except for Olsen Lenstar and Pearl DGS (Supplemental Graphs 2 & 3).
Mean and Median Prediction Errors (MPE/ MedPE)
Table 2 shows the MPE and MedPE ± SD for all formulas respectively along with the minimum and maximum prediction error and percentile values (p25, p50, p75).
| METRIC | AVG_PE | MED_PE | SD_PE | MIN_PE | Q05_PE | Q25_PE | Q75_PE | Q95_PE | MAX_PE |
|---|---|---|---|---|---|---|---|---|---|
| 01. Barrett Universal 2 | -0.034 | 0.028 | 0.487 | -1.356 | -0.949 | -0.42 | 0.324 | 0.591 | 1.212 |
| 02. EVO | -0.113 | -0.027 | 0.495 | -1.481 | -1.025 | -0.518 | 0.26 | 0.536 | 1.11 |
| 03. Haigis | -0.025 | 0.028 | 0.473 | -1.195 | -0.836 | -0.329 | 0.293 | 0.756 | 1.139 |
| 04. Hill-RBF | -0.142 | -0.07 | 0.487 | -1.4 | -1.01 | -0.53 | 0.195 | 0.508 | 1.14 |
| 05. HofferQ | 0.141 | 0.128 | 0.502 | -1.107 | -0.678 | -0.182 | 0.461 | 0.926 | 1.382 |
| 06. Holliday 1 | 0.054 | 0.076 | 0.542 | -1.33 | -0.925 | -0.308 | 0.437 | 0.824 | 1.39 |
| 07. Holliday 2 (2014) | 0.046 | 0.087 | 0.506 | -1.239 | -0.866 | -0.285 | 0.425 | 0.745 | 1.363 |
| 08. Holliday 2 (NLR) | -0.066 | 0.01 | 0.487 | -1.3 | -0.947 | -0.392 | 0.293 | 0.62 | 1.02 |
| 09. Kane | -0.101 | -0.025 | 0.475 | -1.334 | -0.988 | -0.467 | 0.248 | 0.582 | 1.039 |
| 10. K-6 | -0.098 | -0.01 | 0.48 | -1.269 | -1.011 | -0.483 | 0.236 | 0.548 | 1.079 |
| 11. Olsen- Lentar | -0.117 | -0.02 | 0.491 | -1.47 | -0.916 | -0.51 | 0.23 | 0.52 | 0.91 |
| 12. Olsen PO | -0.296 | -0.32 | 0.263 | -0.99 | -0.73 | -0.45 | -0.09 | 0.147 | 0.34 |
| 13. Okulix | -0.18 | -0.201 | 0.261 | -0.792 | -0.664 | -0.334 | -0.026 | 0.284 | 0.377 |
| 14. Pearl DGS | 0.015 | 0.115 | 0.49 | -1.372 | -0.843 | -0.325 | 0.361 | 0.676 | 1.078 |
| 15. SRK-T | 0.069 | 0.131 | 0.561 | -1.392 | -0.879 | -0.29 | 0.478 | 0.827 | 1.6 |
| 16. T2 | -0.029 | 0.035 | 0.494 | -1.289 | -0.915 | -0.373 | 0.288 | 0.623 | 1.227 |
| 17. VRF | 0.027 | 0.092 | 0.501 | -1.252 | -0.831 | -0.287 | 0.362 | 0.736 | 1.352 |
Table 2: Shows the MPE and MedPE ± SD for all formulas respectively along with the minimum and maximum prediction error and perce
The MPE was closest to zero when the following formulas were applied: Barrett U2, Haigis, Holladay 1, Holladay 2 (2014), Pearl DGS, T2, and VRF.
In terms of myopic prediction errors, Barett U2, EVO, Haigis, Hill RBF, Holladay 2 NLR, Kane, K6, Okulix, Olsen Lenstar, Olsen PO, T2 have more negative prediction errors than the other formulas. Supplemental Table 1 shows the mean APE and Med APE± SD for all the formulas.
Median Absolute Prediction Errors (MedAPE)
The Okulix had the lowest MedAPE (0.224) followed by Hill RBF (0.295) with SRK-T formula noted to have the highest MedAPE of 0.400. In terms of SD, Okulix and Olsen PO formulas have the lowest SD (± 0.182 and ± 0.210 respectively), whereas Hill RBF has the highest SD (0.333).
The box plot comparison of the APE between different formulas (Graphs 1 & 2) depicts that Okulix and Olsen PO have the smallest SD among the other formulas for our subset of eyes. Also, Okulix has the lowest mean and median APE.
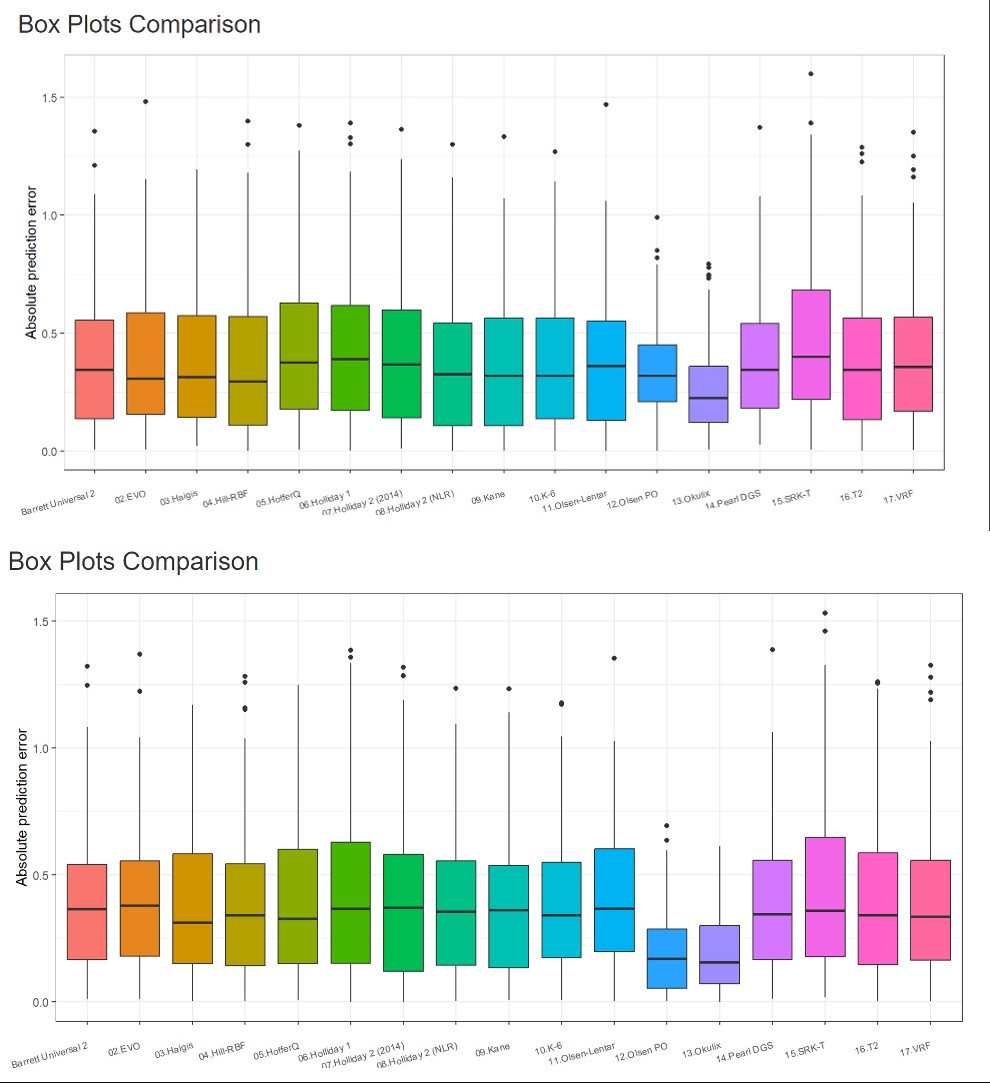
Graph 1: Depicts the box plot comparison of the APE between different formulas.
Graph 2: Depicts the box plot comparison of the APE between different formulas after reducing the mean to zero.
Reducing Mean to Zero
Table 3 and Graph 2 shows the changes in the median after reducing the mean to zero for all formulas.
| METRIC | AVG_PE | MED_PE | SD_PE | MIN_PE | Q05_PE | Q25_PE | Q75_PE | Q95_PE | MAX_PE |
|---|---|---|---|---|---|---|---|---|---|
| 01. Barrett Universal 2 | 0 | 0.062 | 0.487 | -1.322 | -0.914 | -0.386 | 0.359 | 0.625 | 1.247 |
| 02. EVO | 0 | 0.086 | 0.495 | -1.368 | -0.912 | -0.405 | 0.373 | 0.649 | 1.223 |
| 03. Haigis | 0 | 0.053 | 0.473 | -1.17 | -0.811 | -0.304 | 0.317 | 0.781 | 1.163 |
| 04. Hill-RBF | 0 | 0.072 | 0.487 | -1.258 | -0.868 | -0.388 | 0.337 | 0.65 | 1.282 |
| 05. HofferQ | 0 | -0.013 | 0.502 | -1.249 | -0.82 | -0.323 | 0.32 | 0.784 | 1.24 |
| 06. Holliday 1 | 0 | 0.022 | 0.542 | -1.385 | -0.98 | -0.362 | 0.383 | 0.769 | 1.336 |
| 07. Holliday 2 (2014) | 0 | 0.041 | 0.506 | -1.285 | -0.912 | -0.331 | 0.378 | 0.699 | 1.317 |
| 08. Holliday 2 (NLR) | 0 | 0.076 | 0.487 | -1.234 | -0.881 | -0.327 | 0.358 | 0.686 | 1.086 |
| 09. Kane | 0 | 0.076 | 0.475 | -1.233 | -0.886 | -0.366 | 0.349 | 0.683 | 1.14 |
| 10. K-6 | 0 | 0.089 | 0.48 | -1.171 | -0.913 | -0.385 | 0.334 | 0.646 | 1.177 |
| 11. Olsen- Lentar | 0 | 0.097 | 0.491 | -1.353 | -0.799 | -0.393 | 0.347 | 0.637 | 1.027 |
| 12. Olsen PO | 0 | -0.024 | 0.263 | -0.694 | -0.434 | -0.154 | 0.206 | 0.443 | 0.636 |
| 13. Okulix | 0 | -0.021 | 0.261 | -0.612 | -0.484 | -0.154 | 0.153 | 0.463 | 0.557 |
| 14. Pearl DGS | 0 | 0.1 | 0.49 | -1.387 | -0.858 | -0.34 | 0.346 | 0.661 | 1.063 |
| 15. SRK-T | 0 | 0.063 | 0.561 | -1.46 | -0.947 | -0.359 | 0.41 | 0.758 | 1.531 |
| 16. T2 | 0 | 0.064 | 0.494 | -1.26 | -0.887 | -0.345 | 0.317 | 0.652 | 1.255 |
| 17. VRF | 0 | 0.065 | 0.501 | -1.278 | -0.857 | -0.313 | 0.336 | 0.71 | 1.326 |
Table 3: Shows the MedPE ± SD for all formulas after reducing the mean to zero.
MedPE ranged from -0.013 to 0.100 with Hoffer Q having the MedPE closest to zero (-0.013). Hoffer Q, Okulix, and Olsen PO have negative Median PE establishing that they are more skewed towards the myopic end in comparison.
The MedAPE of all formulas ranged from 0.155 to 0.379 and Okulix and Olsen PO had the lowest APE and SD (0.155±0.164 and 0.169±0.168 respectively). EVO showed the highest MedAPE of 0.379 and Holladay 1 and SRK-T proved to have the highest SD of ±0.334.
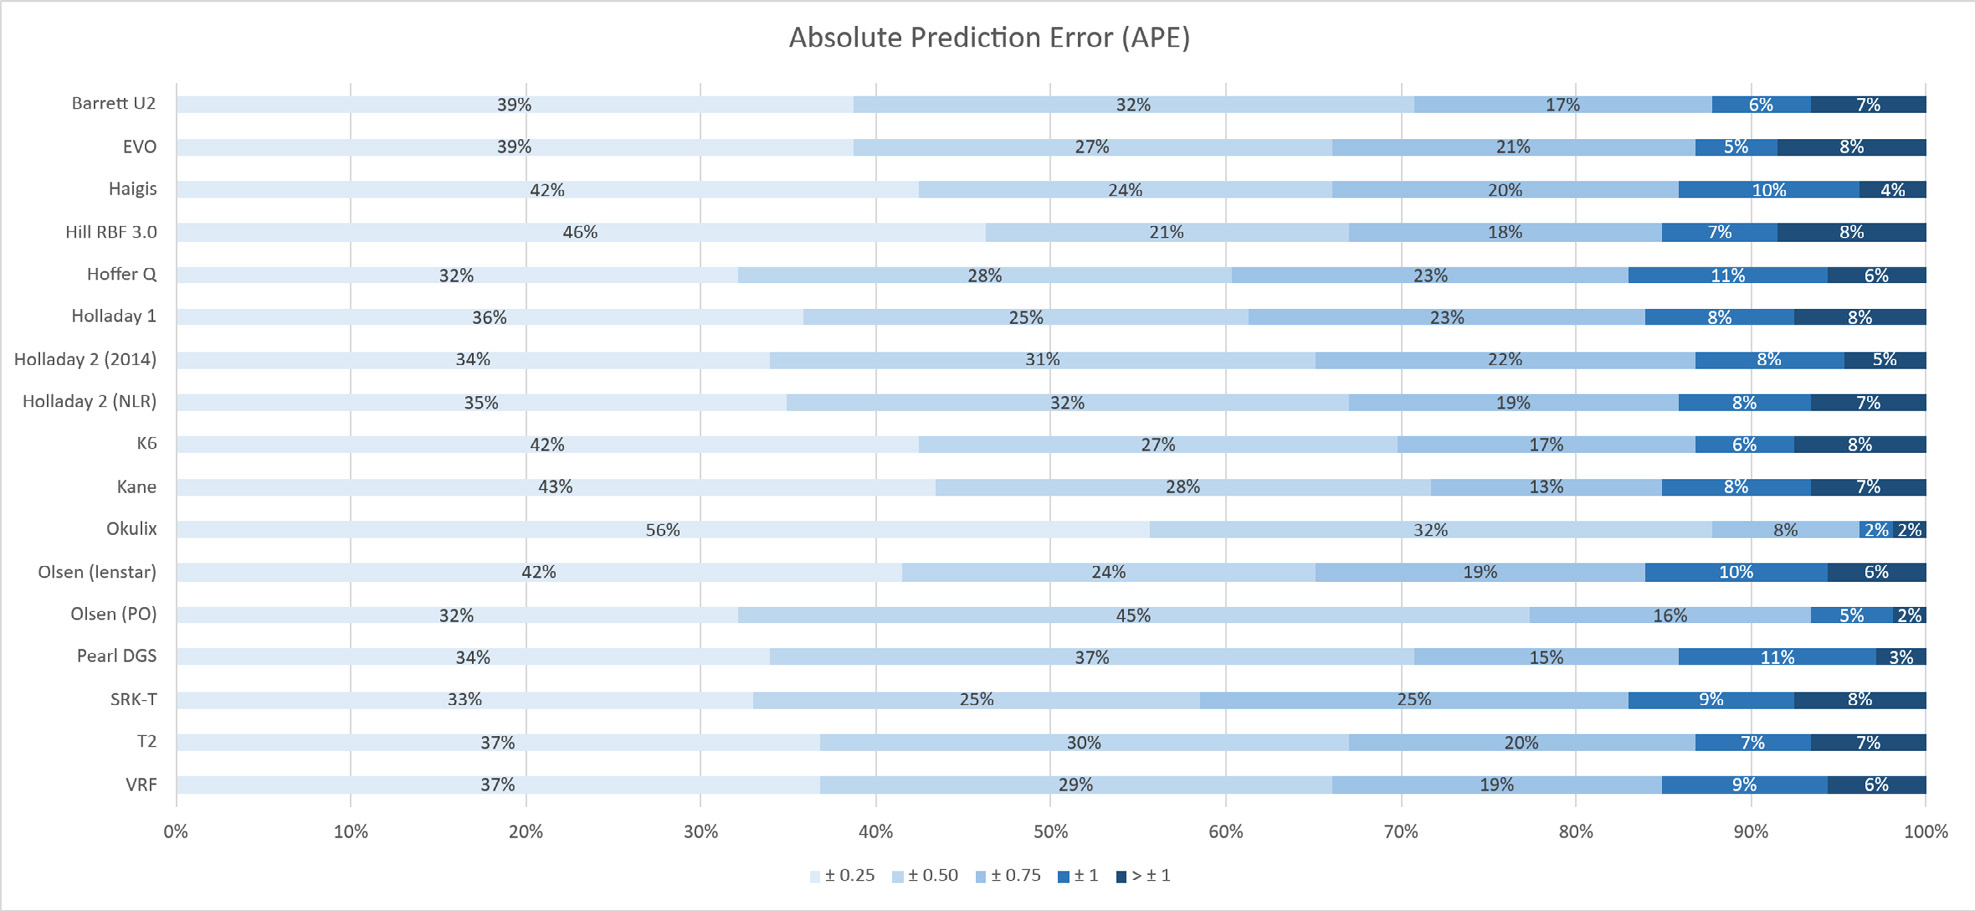
Graph 2 shows the box plot of prediction errors for all the formulas. It shows that the mean of the Okulix and Olsen PO formulas are the most skewed to the myopic side, however they also have the least deviation in their prediction errors (p<0.001) Figure 1 shows the percentage of patients with absolute prediction errors of within ± 0.25, ±0.50, ±0.75, ±1.0, and > ±1.0D. It represents that Okulix formula has the most patients with APE of within ± 0.25D (42%) and Olsen PO and Okulix have the least number of patients with APE of > ±1.0D (2%).
Variables and PE Analysis
All the 5 variables (namely K1, K2, AXL, ACD, and AD) were divided into 3 quantiles (<=33th percentile, 33th-66th percentile, >=66th percentile).
K1, K2 and PE Analysis
When comparing different formulas at the different K1 and K2 quantile group - Okulix and Olsen PO have significantly lower APE and SD then the rest of the IOL formulas.
K1/K2- <=33rd percentile group- Okulix (0.11±0.20, 0.11±0.19) and Olsen PO (0.19±0.20, 0.12±0.20) had the lowest MedAPE with SRK-T having the highest in K1 quantile (0.45±0.35) and Barrett U2 in K2 quantile (0.36±0.28) (Supplemental graphs 4 & 7).
33rd-66th percentile- MedAPE of Okulix (0.16±0.14, 0.15±0.12) and Olsen PO (0.17±0.16, 0.16±0.14) was the lowest whereas Holladay 1 had the highest MedAPE in K1 quantile (0.37±0.32) and VRF in K2 quantile (0.46±0.32) (Supplemental graphs 5 & 8).
>=66th percentile – Olsen PO MedAPE (0.16±0.13, 0.19±0.16) and Okulix MedAPE (0.21±0.14, 0.22±0.17) was significantly lower than the rest of the IOL formulas. On the other hand, Holladay 1 had the highest MedAPE in K1 (0.46±0.34) and K2 (0.47±0.33) quantiles (Supplemental graphs 6 & 9).
To illuminate, Olsen PO performs better than Okulix in higher K1 and K2 quantile groups.
AXL and PE Analysis
In the lower AXL percentile group (<=33rd percentile)- Okulix (0.13±0.16), followed by Haigis (0.21±0.29), Holladay 2 NLR (0.21±0.31), and Olsen PO (0.21±0.17) have the lowest MedAPE with SRK-T showing the highest MedAPE (0.37±0.37). In the mid percentile group (33rd-66th percentile) and the top percentile group (>= 66th percentile) Okulix (0.17±0.18 and 0.16±0.16 respectively) and Olsen PO (0.21±0.16 and 0.14±0.18 respectively) demonstrate lower MedAPE than the rest of the formulas whereas Holladay 1 shows the highest MedAPE (0.45±0.33 and 0.46±0.30 respectively) (Supplemental graph 10,11,and 12 respectively).
To highlight, Okulix consistently performs better in all the AXL percentile groups. In the top quantile, Olsen PO achieves lower MedAPE then Okulix.
ACD and PE Analysis
In all the 3 percentile groups for ACD -Okulix and Olsen PO have the lowest MedAPE compared to the rest of the IOL formulas (Supplemental graphs 13-15).
ACD- <=33rd percentile group- Okulix (0.15±0.17) and Olsen PO (0.19±0.18) had the lowest MedAPE with Olsen Lenstar having the highest MedAPE of 0.44±0.28.
33rd-66th percentile MedAPE of Olsen PO (0.12±0.15) and Okulix (0.22±0.15) was the lowest whereas Holladay 1 had the highest MedAPE (0.43±0.28).
>=66th percentile-Okulix MedAPE (0.15±0.17) and Olsen PO MedAPE (0.21±0.17) was significantly lower than the rest of the IOL formulas. On the other hand, Holladay 1 was noted to have the highest MedAPE (0.45±0.34).
Discussion
The increase in incidence of myopia day by day is a constant stress on the health resources worldwide. It is estimated that by 2050, 50% of the world population will be affected by myopia [16]. Even though the prevalence is more in east and southeast-Asian countries [17, 18], due to the current migration and resettling of population, and the change in lifestyle factors, this condition has affected all the countries world-wide [19]. Infact, the Sydney Myopia study conducted in 2006 reported an incidence of myopia of 31% [20]. In a few years’ time, there will be a rise in the myopic patients requiring cataract surgeries with spectacle independence. Our study focuses on mild to moderate myopic eyes as the majority of myopes fall in this category [21].
Despite the continued aim to improve outcomes in myopic eyes, there are errors in axial length calculation, effective lens position prediction, and lens constant optimisation. Hyperopic surprise is a common complication post cataract surgery in myopic patients and thus choosing the correct formula becomes a crucial part in the surgery preparation. With so many different formulas currently available, we aimed to compare them to find the formulas with least prediction errors and least hyperopic surprise.
In our study, we found that the Okulix and Olsen PO formulas have the least variation even though they tend to have slightly higher MPE and trend towards more myopic outcomes. However, on reducing the mean to zero, these two formulas have their MedPE closer to zero than the rest of the formulas which is statistically significant. They also had least number of patients with postoperative refractive error >± 1.0D. They also tend to have lower MedPE when comparing across different K1, K2, ACD, AD, and AXL values and quantile groups. Interestingly, the rest of the formulas had similar SD.
In a study by Abulafia, et al. [22] that compared the SRK/T, Hoffer Q, Haigis, Barrett Universal II, Holladay 2, and Olsen formulas, found that all these formulas met the benchmark criteria of having PE of ± 0.5D in at least 71% of eyes and they performed similar in patients with AXL >26mm and requiring IOL power ≥ 6.0D. Similarly, in our cohort, we found the Barrett U2, Kane, Okulix, Olsen PO, and Pearl DGS formulas meeting these benchmark criteria.
Doshi, et al. [9] found that all 3 of the formulas (Holladay 1, Hoffer Q, and SRK-T) performed well in AXL >24.5mm with the Haigis formula showing more hyperopic results.
Though this study did not measure AXL with an IOL Master/ Lenstar. In our study, the Haigis formula, however, showed a more myopic tendency and the HofferQ formula resulted in a significant hyperopic result.
There are several studies in literature comparing the different third and fourth generation formulas and most of the studies have found them to be comparable in predicting refractive errors in myopic eyes [11, 23, 24, 25, 26]. However, there are not many studies reporting accuracy of newer formulas.
Okulix is one of the newer formulas which works on ray-tracing software and uses multiple biometric values (including AXL, IOL curvature radii, IOL central thickness, asphericity, refractive index, corneal topography, and CCT) to determine the IOL power. In a study comparing Okulix with the pre-existing formulas like SRK-T and Hoffer Q, they noted that MPE by Okulix was not significantly different from that of the other two formulas (P=0.25) and 63.5% of eyes had their prediction errors within ± 0.50D [27]. In our study, the MPE of Okulix was determined to be -0.20D but had a small standard of deviation. Due to the skewed data points, the MedPE after reducing the mean to zero, the Okulix formula performed well (-0.002). It also had the highest number of patients with postoperative refractive error within ± 0.5D (88%).
The only other formula to perform similarly in our study was the Olsen PO. Olsen formula uses a specialised C-constant, which is basically a ratio by which the empty capsular bag will capture and fix the new IOL after implantation. This increases the accuracy of predicting the effective lens position by using the preoperative ACD and LT measurements [23]. This is now included in the Lenstar LS 900 machine. PhacoOptics is a unique IOL power calculation tool and data management approach which incorporates exact and paraxial ray tracing to effectively determine the correct IOL power to implant. We found that Olsen PO has a MPE of -0.315 with a smaller standard of deviation similar to Okulix. Given the skewed data sets, the MedPE after reducing the mean to zero was -0.005 with 77% of patients having a postoperative refractive outcome of within ± 0.5D.
EVO (Emmetropia verifying Optical) formula is based on the theory of emmetropisation and in a study comparing the EVO with Barrett U2, Haigis, Kane, and SRK-T, the EVO performed better in long AXL than the others [28].
Pearl DGS (Postoperative spherical Equivalent prediction using Artificial intelligence and Linear algorithms) was developed by Debellemanière, Gatinel and Saad and is based on the prediction of the theoretical internal lens position. This formula was determined to have lower SD (± 0.269D) than the Olsen, K6, EVO, and Barrett U2 formula [29].
This study, despite being retrospective in nature, had the following strengths: First, we compared between seventeen different formulas in long to medium long eyes, which is majority of the cohort of the booming myopic population. Second, a single IOL type was used to overcome bias between different IOL designs. Third, we incorporated the newer generation formulae for the comparison with the traditional ones. However, short follow-up period, sample size and multiple surgeons were some limitations of the study. Conclusions Okulix and Olsen PO formulas have the MedPE closest to zero with smaller standard of deviation then the rest of the formulas. The Barrett U2, EVO, Haigis, Hill RBF 3.0, Holladay 2 NLR, Kane, K6, Okulix, Olsen Lenstar, Olsen PO, Pearl DGS, T2 formulas tend to have more myopic MPE whereas the Hoffer Q, Holladay 1, Holladay 2 2014, SRK T, VRF formulas have more hyperopic MPE.
Disclosures
No disclosures for any financial or proprietary interest for all authors. No disclosures of any public or private support for all authors.
Author Contributions
Tasneem. A. Arsiwalla: research idea, data collection, analysis, manuscript writing and review Cenanning Li: statistical analysis Nishant Gupta: research idea, data collection, manuscript review
Conflict of Interest
No conflict of interest or any financial or proprietary interest for any of the authors in any material or method mentioned.
Value Statement
What was known: The newer generation formulas have shown a significant improvement in accurately predicting the refractive errors post cataract surgery. Accurately assessing the prediction errors in myopic eyes is an issue. What this paper adds: The first paper, to the author’s knowledge, that compares and evaluates prediction errors between seventeen different newer generation IOL calculating formulas.
When using these formulas, one should be aware of the amount of refractive error and the myopic or hyperopic trend the formula provides.
References
-
Moschos MM, Chatziralli IP, Koutsandrea C (2014) Intraocular lens power calculation in eyes with short axial length. Indian J Ophthalmol 62: 692-694.
-
Chung J, Bu JJ, Afshari NA (2022) Advancements in intraocular lens power calculation formulas. Curr Opin Ophthalmol 33(1): 35-40.
-
Lin L, Xu M, Mo E, Huang S, Qi X, et al. (2021) Accuracy of Newer Generation IOL Power Calculation Formulas in Eyes With High Axial Myopia. J Refract Surg 37(11): 754-758.
-
Xia T, Martinez CE, Tsai LM (2020) Update on Intraocular Lens Formulas and Calculations. Asia Pac J Ophthalmol (Phila) 9(3): 186-193.
-
Savini G, Hoffer Kenneth J, Kohnen T (2024) IOL power formula classifications. Journal of Cataract & Refractive Surgery 50(2): 105-107.
-
Tsiropoulos G, Loukovitis E, Koronis SN, Sidiropoulos G, Tsotridou E, et al. (2020) Five generations of intraocular lens power calculation formulas: A review. Med Hypothesis Discov Innov Optom 1(2): 78-99.
-
Jin H, Rabsilber T, Ehmer A, Borkenstein AF, Limberger IJ, et al. (2009) Comparison of ray-tracing method and thin-lens formula in intraocular lens power calculations. J Cataract Refract Surg 35(4): 650-662.
-
Seo S, Lee CE, Kim YK, Lee SY, Jeoung JW, et al. (2016) Factors affecting refractive outcome after cataract surgery in primary angle‐closure glaucoma. Clin Exp Ophthalmol 44: 693‑700.
-
Zhang Y, Liang XY, Liu S, Lee JW, Bhaskar S, et al. (2016) Accuracy of Intraocular Lens Power Calculation Formulas for Highly Myopic Eyes. J Ophthalmol 2016: 1917268.
-
Doshi D, Limdi P, Parekh N, Gohil N (2017) A Comparative Study to Assess the Predictability of Different IOL Power Calculation Formulas in Eyes of Short and Long Axial Length. J Clin Diagn Res 11(1): NC01-NC04.
-
Wan KH, Lam TCH, Yu MCY, Chan TCY (2019) Accuracy and Precision of Intraocular Lens Calculations Using the New Hill-RBF Version 2.0 in Eyes With High Axial Myopia. Am J Ophthalmol 205: 66-73.
-
Liu J, Wang L, Chai F, Han Y, Qian S, et al. (2019) Comparison of intraocular lens power calculation formulas in Chinese eyes with axial myopia. J Cataract Refract Surg 45(6): 725-731.
-
Zhou D, Sun Z, Deng G (2019) Accuracy of the refractive prediction determined by intraocular lens power calculation formulas in high myopia. Indian J Ophthalmol 67(4): 484-489.
-
Bernardes J, Raimundo M, Lobo C, Murta JN (2021) A Comparison of Intraocular Lens Power Calculation Formulas in High Myopia. J Refract Surg 37(3): 207-211.
-
Armstrong RA (2013) Statistical guidelines for the analysis of data obtained from one or both eyes. Ophthalmic Physiol Opt 33(1): 7-14.
-
Hoffer KJ, Aramberri J, Haigis W, Olsen T, Savini G, et al. (2015) Protocols for studies of intraocular lens formula accuracy. Am J Ophthalmol 160(3): 403-405.e1.
-
Holden BA, Fricke TR, Wilson DA, Jong M, Naidoo KS, et al. (2016) Global Prevalence of Myopia and High Myopia and Temporal Trends from 2000 through 2050. Ophthalmology 123(5): 1036-1042.
-
Tang Y, Wang X, Wang J, Huang W, Gao Y, et al. (2015) Prevalence and Causes of Visual Impairment in a Chinese Adult Population: The Taizhou Eye Study. Ophthalmology 122(7): 1480-1488.
-
Jonas JB, Ang M, Cho P, Guggenheim JA, He MG, et al. (2021) IMI Prevention of Myopia and Its Progression. Invest Ophthalmol Vis Sci 62(5): 6.
-
Verkicharla PK, Chia NE, Saw SM (2016) What Public Policies Should Be Developed to Cope with the Myopia Epidemic?. Optom Vis Sci 93(9): 1055-1057.
-
Rose KA, Ip J, Robaei D, Huynh SC, Kifley A, et al. (2006) The Sydney Myopia Study, Sydney Childhood Eye Study; Near–Work and Outdoor Activities and the Prevalence of Myopia in Australian School Students Aged 12–13 Years: The Sydney Myopia Study Invest Ophthalmol Vis Sci 47(13): 5453.
-
Tideman JWL, Polling JR, Vingerling JR, Jaddoe VWV, Williams C, et al. (2018) Axial length growth and the risk of developing myopia in European children. Acta Ophthalmol 96(3): 301-309.
-
Abulafia A, Barrett GD, Rotenberg M, Kleinmann G, Levy A, et al. (2015) Intraocular lens power calculation for eyes with an axial length greater than 26.0 mm: comparison of formulas and methods. J Cataract Refract Surg 41(3): 548-556.
-
Olsen T (2012) The C-constant: New concept in IOL power calculation using ray tracing. Paper presented at: the ESCRS annual meeting; September 8, 2012; Milan, Italy.
-
El-Nafees R, Moawad A, Kishk H, Gaafar W (2010) Intra- ocular lens power calculation in patients with high axial myopia before cataract surgery. Saudi J Ophthalmol 24(3): 77-80.
-
Sakai D, Hirami Y, Nakamura M, Kurimoto Y (2021) Accuracy of Intraocular Lens Power Calculation Formulas in Myopic Eyes with Target Refractions of Emmetropia and Intentional Myopia. Clin Ophthalmol 15: 4535-4541.
-
Ghoreyshi M, Khalilian A, Peyman M, Mohammadinia M, Peyman A (2017) Comparison of OKULIX ray- tracing software with SRK-T and Hoffer-Q formula in intraocular lens power calculation. J Curr Ophthalmol 30(1): 63-67.
-
Lin L, Xu M, Mo E, Huang S, Qi X, et al. (2021) Accuracy of Newer Generation IOL Power Calculation Formulas in Eyes With High Axial Myopia. J Refract Surg 37(11): 754-758.
-
Debellemanière G, Dubois M, Gauvin M, Wallerstein A, Brenner LF, et al. (2021) The PEARL-DGS Formula: The Development of an Open-source Machine Learning- based Thick IOL Calculation Formula. Am J Ophthalmol 232: 58-69.
- The Effect of Imatinib on the Fetus Growth and Development of a Pregnant Woman Involved with CML, a Case Report and a Literature Review
- Acquired Neutropenia and Fever, its Treatment and Complications in an Infant, A Case Report
- Coccidioidomycosis with Laryngeal Nodule and Cavitary Lung Disease: A Case Report
- Hodgkin Lymphoma in a Girl with Common Variable Immune Deficiency: A Case Report and Review of Literature
- Public Administration and the Management of Beliefs in Risks and Dangers in the COVID-19 Era
- Histopathological Study of Placentas of Hypertensive Disorders