On Optimal Allocation of Oil under Uncertainty in Case of Supply Shortage in China
Energy security has become a hot issue since the oil crisis in 1970s, much attention has been paid to the problem how to mitigate the effects of a disruption or shortage to the oil supply. In this paper, we try to establish an optimal plan that allocates the limited oil optimally to the selected sectors in case of oil shortage by employing the interval-parameter fuzzy two-stage stochastic programming model combining with the dynamic computable general equilibrium model. We find that the agricultural sector seems to be the most important unit within the entire country, the oil therefore must be first delivered to this sector in case of disruption; additionally, it’s no necessary for managers in the industrial and constructional sectors to curtail their expansion plans unless a serious oil supply disruption occurs, oil demands are able to be satisfied in most targeted scenarios. In particular, the government should make great effort to improve public transport infrastructure and encourage use of public transport, they can also engage in sponsoring research and development work to increase the efficiency of transportation vehicle and facilities and promoting alternative fuels such as alcohol fuel, reducing vulnerability to oil supply shortfall and alleviating the impact of oil disruption.
Introduction
As representative of emerging economies, China’s GDP growth rate has been the highest with an average level of around 9% during the last decade. Although majority of the country’s economy has been affected by the financial crisis in 2008, China still kept its development of economy with a high GDP growth rate of 10%. Meanwhile, China’s oil demand has skyrocketed with the rapid development of its economy [1]. In 1993, China’s oil imports surpassed its exports for the first time, and became a net importer of oil since then. The demand of crude oil has surged from 241 million tons in 2000 to 442 million tons in 2010, with a rate of 6.78% per year. At the same time, the import of crude oil has risen from 60 million tons to 239 million tons, and the degree of dependence on foreign crude oil increased to 54%, with the degree of dependence on foreign oil to be around 60%. According to the forecast of International Energy Agency (IEA) [2], China’s oil demand growth will account for 30%~40% that of the world. In
Journal of Ecology & Natural Resources
terms of the date punished by Energy Research Institute of National Development and Reform Commission (ERI- NDRC), the oil demand of China will reach to 450~610 million tons in 2020, and the degree of dependence on foreign oil will approach to 60%~70%, which means that the development status of highly depending on oil won’t be changed in the short run. The majority of people may believe that oil crises just like happened in 70s of the last century is unlikely to occur again, but no one could ignore the risks of oil supply disruption, geopolitical, military and terrorist causes for disruptions are still there and never far away from us, and we could never forget the weather-related factors, such as earthquakes, tsunamis and hurricanes, which will undoubtedly increase the uncertainties of oil production or transport and influence the world’s oil supply. Recent changes in world events, famous conflicts in Libya and Syria, unrests in Egypt and Yemen have renewed people’s concept on risks of oil disruptions, and take the issue of oil supply security on the agenda again. Many geophysicists doubt that the earth’s crust active period is coming, which might exacerbate the risks of natural disasters occurrence and become the unstable factors of world’s oil supply. It’s the trend of the times that dictatorship will be replaced by democracy, the Middle East and the North Africa, as one of world’s most important oil producers, are the typical representatives of authoritarian system, hence, the movement fighting for democracy in these authoritarian bodies will never stop, which will increase the probability of oil disruption without doubt. Otherwise, Iran’s nuclear program and terrorist attacks by al qaeda might be the fuses of oil disruptions. In a word, the world is not so calm as it seems, we‘d better be ready to deal with oil supply disruptions in any time. To be one of the major oil importers, China will have to face more severe challenges. It seems that Chinese government has paid more attention to the diversification of oil import in recent years, but our imports still comes from highly centralized sources, with around 47.1% of total oil imports coming from the Middle east and 29.6% of that being from Africa in 2010, which are all politically- unstable parts of the world, the flexibility of oil supply remains lower, once there is something wrong severe with the oil production in these regions, China has to face a situation of oil disruption. To building Strategic Petroleum Reserve (SPR) is an important policy for mitigating the effects of a disruption or shortage to the oil supply, and proved to be effective in many developed countries. In present, however, we are just beginning to establish SPR, with the size of reserves less than 30 days of its net import oil, which is far from the international standard, and it might be limited even in 2020 with the participation of commercial oil reserves be absent. Hence, SPR may play a limited role in tackling oil disruption in China in the near future. Otherwise, SPR is mainly used to slow down the volatility of oil prices and reduce the loss caused by high price. When a severe disruption with long- term in duration occurs, SPR may be of little use, then rationing may be the only way of dealing with it. Therefore, it is meaningful for us to study the issue of oil allocation in case of oil disruption in China. Oil security problems have once been a popular issue during the three global oil crises, much attention has been paid to it from that time on. Beccue and Huntington (2005) [3] did some research on estimating the probability, size and duration of a disruption during the 10-year timeframe 2005-2014, they divided the major world oil supply regions into four, i.e., Saudi Arabia, Other Persian Gulf countries, West of Suez and Russia and Caspian states, and showed some interesting results. Many others focused on the impacts of different energy policies have on the oil security, these studies often try to find various effective policies on oil import in order to compensate the externalities related to insecurity supply [4, 5, 6, 7]. Besides, some attention was paid on the estimation of costs and benefits of oil imports in case of disruption. Leiby et al. (1997) [8] examined the costs and benefits of the marginal barrel of U.S oil imports, and dedicated in identifying the possible social costs of oil imports that are not included in the price paid by consumers; Parry and Damstadter (2003) [9] described trends and future predictions of factors that determine U.S. dependence on oil and its imports, and believed that the oil premium depends on the extent to which the costs to the United States as a whole from extra oil consumption may exceed the private costs to individual oil users; Leiby (2007) [10, 11] investigated the energy security benefits of reduced U.S. oil consumption and imports, he also estimated the adjustment costs of different disruption scenarios; Hedenus et al. (2010) [12] analyzed the impact on the expected cost of oil disruption under different energy policies in EU-25, they concluded that the gross expected economic gain of the policies is found to be between 9 and 22 $/bbl oil replaced. There are also lots of papers concerned on how to mitigate the effect of disruption by establishing SPR and reduce the impact of oil prices on the economy, a lot of results had been obtained including both qualitative and quantitative ones [13, 14, 15, 16]. Relative works begun later in China [17, 18, 19, 20, 21]. However, how to allocate the limited oil resources to the main economic sectors efficiently and maximize the net system benefit when shortage or disruption occurs is still left unsolved, especially for China, our work may contribute to fill this gap.
Journal of Ecology & Natural Resources
There is no doubt that a lot of uncertainties exist in our system, Markov processes is one of popular ways to deal with such uncertainties, which is employed to describe inherent uncertainties in the SPR problems by using stochastic dynamic programming. Interval-parameter is another method to character uncertainties expressed not only as possibility and probability distributions but also as discrete intervals, which proves to be an effective procedure to tackle imprecision and will be employed in our work. In the framework of interval-parameter, the lower and upper bounds of these intervals may also be uncertain, which could describe dual uncertainty problem. Interval-parameter method has an advantage of linking to fuzzy set theory and two-stage programming, which is used to increase the effectiveness of grey system and meaning of those results and incorporate pre-defined oil allocation policies into our optimization process respectively. In the process of two-stage decision, one has to make a decision about how much oil they need before the disruption occurs, this is called first-stage decision, when the uncertainties of oil shortage are quantified, a action can then be taken, and this is the so-called second- stage decision. In this paper, we try to address the optimal allocation problem of limited oil resource under uncertainty in case of supply shortage in 2020 by employing interval- parameter fuzzy two-stage stochastic programming (IFTSP). The IFTSP method is created by Imran Maqsood and Huang (2005) [22], and then applied to a case study of water resource management. To the best of our knowledge, this is the first attempt to concern on issues of oil allocation by using IFTSP model. We divide the whole economy into six sectors, what we try to do is to determine an efficient allocation of oil to agriculture, industry, construction, transportation, commercial and municipal, accounting for the inherent system uncertainties that occur under different shortage scenarios. Based on the principle of maximizing the expected value of net system benefits, an optimal quantity of oil will be allocated for each user by considering local oil management policies, which is of great importance to the users to make appropriate decisions to support their production activities. If the users get to know how much oil they can expect, then they will take the initiative to make planning and manage the production, for example, users will postpone relevant investment of high oil intensity and curb their development plan, if they get the information that the promised oil may not be delivered due to insufficient supply.
The remainder of our paper is arranged as follows: Some basic definitions for grey theory will be presented in section 2. Then, in section 3, we will show the IFTSP model and describe our problem. Computation process and results will be presented in section 4. We conclude in the last section, and give some suggestions.
Methods
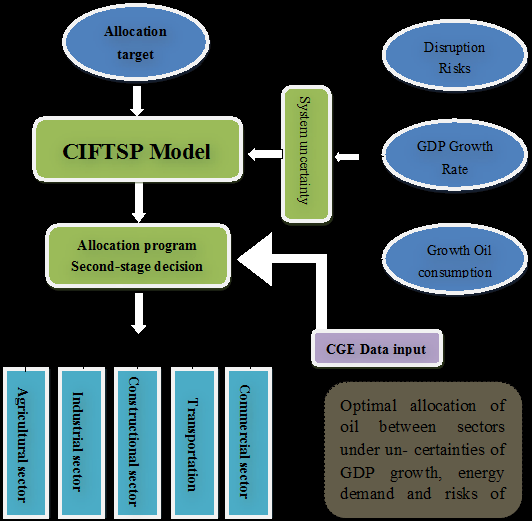
In order to study the allocation of oil shortage to the main national macro-economic sectors, we combine all the 42 sectors of I-O table into 5, e.g., Agricultural, Industry, Construction, Transportation, and Commercial sector. The target year of our paper is 2020, with the levels of shortage uncertain, our goal is to allocate the limited oil resource to all the competing sectors with the most effective and appropriate way. Suppose four market states are there, i.e., normal/ no shortage, slight shortage, moderate shortage and serious shortage. What inspires us most is to create an allocation planning in case of supply disruption or shortage, which is significant to the users, if the promised oil cannot be delivered, they will have to either obtain oil from higher-cost alternatives or curb their development plans. The framework of this work is portrayed in Figure 1.
Prior to show our model, we give some notations first which will be used in the following (the preliminary definitions of grey theory are presented in the Appendix):
$$I = \{i \mid i = 1, \ldots, 5, \text{ representing agricultural, industry, constructional, transportational, and commercial sector, respectively}\}$$
$$J = \{j \mid j = 1, 2, 3, 4, \text{ representing normal, slight shortage, moderate shortage and serious shortage, respectively}\}$$
$$BEF_i^\pm : \text{Net benefit to user } i \text{ per ton of oil allocated}, i \in I$$
$$COS_i^\pm : \text{Loss to user } i \text{ per ton of oil not delivered}, COS_i^\pm > BEF_i^\pm, i \in I$$
$$POIL_i^\pm : \text{Promised oil to user } i, \text{ which is the first-stage decision variables (ton)}$$
$$STG_{ij}^\pm : \text{The shortage of oil to users } i \text{ under the supply shortage case } j \text{ (ton)}$$
$$Q_j^\pm : \text{The amount of oil supply under shortage case } j \in J \text{ (ton)}$$
$$POIL_{i,\max}^\pm : \text{The maximum possible amount allocated to user } i \in I \text{ (ton)}$$
$$P_j : \text{The probability of occurrence of shortage case } j \in J$$
$$F^\pm : \text{The net benefit of whole system, } m, n \text{ is the total number of sectors researched and shortage cases, respectively, here we get } m = 6, n = 3.$$
The objective function of our model is as follows:
$$\text{Max } F^\pm = \sum_{i=1}^{m} BEF_i^\pm POIL_i^\pm - \sum_{i=1}^{m} \sum_{j=1}^{n} P_j COS_i^\pm STG_{ij}^\pm$$
The constrains including the maximum oil supply constrains,
$$\sum_{i=1}^{m} \left( POIL_i^\pm - STG_{ij}^\pm \right) \leq Q_j^\pm, \forall j$$
Possible oil allocation constrains,
$$STG_{ij}^\pm \leq POIL_i^\pm \leq POIL_{i,\max}^\pm \forall i, j$$
and the non-negativity constrains,
$$STG_{ij}^\pm \geq 0, \forall i, j.$$
We denote the model above as Model (1).
A common approach to decrease solution uncertainties and reduce the grey degree is to communicate membership information for admissible violations of the system objective and constrains into its optimization framework and solution procedure, the fuzzy programming will be therefore induced into Model (1). Meanwhile, addition to the goal of maximizing system net benefit, we should pay attention to the optimal set of target values. Hence, we then induce a variable $Z_i \in [0, 1], i \in I$ into our model to describe the related policy. In fact, we can set $POIL_i^\pm = POIL_i^- + \Delta POIL_i Z_i$, where $\Delta POIL_i = POIL_i^- - POIL_i^-$, and $POIL_i^\pm$ becomes a deterministic value. For example, when $Z_i = 1$, i.e., $POIL_i^\pm = POIL_i^-$, then the system benefit will be the highest as long as the demands of oil are well delivered. Meanwhile, if the promised quantity is not satisfied, they have to face a higher risk of penalty. When $Z_i = 0$, i.e., $POIL_i^\pm = POIL_i^-$, the system benefit will be the lowest, and we also have the lowest risk of violating the target amount. When $0 < Z_i < 1$, i.e., the value of $POIL_i^\pm$ stays between $POIL_i^-$ and $POIL_i^-$, and the system benefit as well. Then the Model (2) is as follows:
Max $\lambda$
$$\sum_{i=1}^{m} BEF_{i}^{+} \left( POIL_{i}^{-} + \Delta POIL_{i} Z_{i} \right) - \sum_{i=1}^{m} \sum_{j=1}^{n} P_{j} COS_{i}^{+} STG_{ij}^{+} \geq F^{+} - (1 - \lambda) \left( F^{+} - F^{-} \right),$$
$$\sum_{i=1}^{m} \left( POIL_{i}^{-} + \Delta POIL_{i} Z_{i} - STG_{ij}^{+} \right) \leq Q_{j}^{-} + (1 - \lambda) \left( Q_{j}^{+} - Q_{j}^{-} \right), \forall j,$$
$$POIL_{i}^{-} + \Delta POIL_{i} Z_{i} \leq POIL_{i_{\max}}^{-} + (1 - \lambda) \left( POIL_{i_{\max}}^{+} - POIL_{i_{\max}}^{-} \right), \forall i,$$
$$STG_{ij}^{+} \leq POIL_{i}^{-} + \Delta POIL_{i} Z_{i}, \forall i, j,$$
$$STG_{ij}^{+} \geq 0, \forall i, j,$$
$$0 \leq Z_{i} \leq 1, 0 \leq \lambda \leq 1 \forall i,$$
Where $\lambda$ and $STG_{ij}^{+}$ are decision variables. $\lambda \in [0, 1]$ is the value which represents the degree of satisfaction of the fuzzy objective and constrains. If we get a solution with the value $\lambda$ approaches to 1, it means that the solution has a higher possibility of satisfying the constraints and objective under more advantageous system conditions; conversely, if we obtain a solution with the value $\lambda$ closes to 0, then that means the solution has a lower possibility of satisfying the constraints or objective.
Based on a manual algorithm, we can transform model (2) into the following two white models, denoting Model (3) and Model (4), which correspond to the lower and upper bounds of the desired objective (Huang and Loucks, 2000, Huang, 1996) [23, 24]. The sub-model with $\lambda$ corresponding to $F^{+}$ is as follows:
Max $\lambda$
$$\sum_{i=1}^{m} BEF_{i}^{+} \left( POIL_{i}^{-} + \Delta POIL_{i} Z_{i} \right) - \sum_{i=1}^{m} \sum_{j=1}^{n} P_{j} COS_{i}^{+} STG_{ij}^{+} - \lambda \left( F^{+} - F^{-} \right) \geq F^{-},$$
$$\sum_{i=1}^{m} \left( POIL_{i}^{-} + \Delta POIL_{i} Z_{i} - STG_{ij}^{+} \right) + \lambda \left( Q_{j}^{+} - Q_{j}^{-} \right) \leq Q_{j}^{+}, \forall j,$$
$$POIL_{i}^{-} + \Delta POIL_{i} Z_{i} + \lambda \left( POIL_{i_{\max}}^{+} - POIL_{i_{\max}}^{-} \right) \leq POIL_{i_{\max}}^{+}, \forall i,$$
$$-\Delta POIL_{i} Z_{i} + STG_{ij}^{-} \leq POIL_{i}^{-}, \forall i, j,$$
$$STG_{ij}^{+} \geq 0, \forall i, j,$$
$$0 \leq Z_{i} \leq 1, 0 \leq \lambda \leq 1 \forall i,$$
and the sub-model corresponding to $F^{-}$ can be formulated as follows:
Max $\lambda$
$$\sum_{i=1}^{m} BEF_{i}^{-} \left( POIL_{i}^{-} + \Delta POIL_{i} Z_{i} \right) - \sum_{i=1}^{m} \sum_{j=1}^{n} P_{j} COS_{i}^{+} STG_{ij}^{+} - \lambda \left( F^{+} - F^{-} \right) \geq F^{-},$$
$$\sum_{i=1}^{m} \left( POIL_{i}^{-} + \Delta POIL_{i} Z_{i} - STG_{ij}^{+} \right) + \lambda \left( Q_{j}^{+} - Q_{j}^{-} \right) \leq Q_{j}^{+}, \forall j,$$
$$-\Delta POIL_{i} Z_{i} + STG_{ij}^{+} \leq POIL_{i}^{-}, \forall i, j,$$
$$STG_{ij}^{+} \geq STG_{ij}^{-}, 0 \leq \lambda \leq 1, \forall i, j,$$ Journal of Ecology & Natural Resources
+ + − can be obtained Therefore, , , , and opt opt opt ijopt Z F STG λ − − + by solving the sub-Model (3), and , , and opt opt ijopt F STG λ can be solved by Model (4). Hence, we can get the solutions of optimized oil-allocation problem model (2) that λ λ λ ± − + = , , opt opt opt ± − + = , , F F F opt opt opt ± − + = , , , , STG STG STG i j ijopt ijopt ijopt ± ± ± = − , , , OA POIL STG i j ijopt iopt ijopt Where iopt i i iopt POIL POIL POIL Z ± − = +Δ , ± ± ± are optimal system reliability, , and opt ijopt opt OA F λ optimal allocation of oil to user i I ∈ under shortage case j J ∈ , and optimal objective function value, respectively.
It is worth noting that the aspiration levels and F F + −in Model (2)-(4) must be established by decision-makers [25].
Implementation
Data and Calibration
Most of the parameters used for deriving results with our methodology are presented and justified in this sub- section, as well as the range of values of these parameters used for analyzing the sensitivity of the results of our model. Based on China’s input-output table 2007, we reconstruct all the 42 sectors into six, i.e., agriculture, industry, construction, transportation, commerce and municipal unit. There are lots of uncertainties in our system, including the degree of dependence on foreign oil China’s GDP growth rate and disruption or shortage level, etc. So our parameters showing below depend on the following assumptions: (1) According to the forecast made by the ERI-NDRC, the degree of dependence on foreign oil in China will increase to 60%-70% in 2020, which means the oil demand will reach to 450-610 million tons on condition that the domestic production hold a relative stable level of 180 million tons. (2) There are two different viewpoints on the average GDP growth rate of China over the next decade. There are many famous economists who are pessimistic to Asia’s GDP growth, Zhonghe Li, Chief economist of Asian Development Bank (ADB), is one of them, who thinks that the average GDP growth rate of China during the next decade will be 5.5%. However, most of domestic economists hold a different but more optimistic point of view, they believe we Chinese can keep the economy with a rate of 8.0%. (3) Beccue and Huntington (2005) [3] assessed the risk of oil disruptions, including disruption size, likewise and its duration, to which we refer a lot in our study. In order to emphasize the effect of simulation, we set a higher level of disruption. We assume that there are four states of oil market, i.e., no shortage, slight shortage, moderate shortage and severe shortage, associating with a probability of 0.7, 0.15, 0.1 and 0.05, respectively. Suppose there is a shortage of 10%~20% in the slight case, and 25%~35% for the moderate case and 45%~55% for the severe case. Under the assumptions of the above three, we set the parameters by running Chinese computable general equilibrium model (CDECGE), the results are shown in Table 1 and Table 2.
| POILimax | POILi | BEFi | COSi | |
| Agricultural i=1 | 25 | [1.53,2.08] | [31.8,49.58] | [95.4,148.74] |
| Industrial i=2 | 25 | [18.4,24.94] | [10.18,15.87] | [40.72,63.48] |
| Constructional i=3 | 25 | [2.28,3.09] | [13.63,21.24] | [34.08,53.1] |
| Transportation i=4 | 25 | [15.89,21.53] | [1.49,2.32] | [3.73,5.8] |
| Commercial i=5 | 25 | [6.91,9.36] | [26.18,40.81] | [130.9,204.05] |
Table 1: Oil supply under uncertain shortage.
| No shortage | Slight case | Moderate case | Serious case | |
| j=1 | j=2 | j=3 | j=4 | |
| $P_{i}$ | 0.7 | 0.15 | 0.1 | 0.05 |
| $Q_{i}^{+}$ | [45,61] | [[36,40.5],[48.8,54.9]] | [[29.25,33.75],[39.65,45.75]] | [[20.25,24.75],[27.45,33.55]] |
Table 2: The main parameter values resulting from CDECGE model.
Journal of Ecology & Natural Resources
Results and discussions
It is obvious that municipal unit and agricultural sector are the most important part for the whole country, this because these two sectors brings the highest benefit per oil consumption and is subject to the highest cost if the promised oil is not satisfied, which can be observed from table 1. The corresponding results are presented in Table 3 and Table 4.
| POIL±top | Normal J=1 | Slight J=2 | Moderate J=3 | Serious J=4 | |
| Agricultural i=1 | 2.08 | 0 | 0 | 0 | 0 |
| Industrial i=2 | 24.94 | 0 | 0 | 0 | [5.36,11.08] |
| Constructional i=3 | 3.09 | 0 | 0 | 0 | 3.09 |
| Transportation i=4 | 15.89 | 9.35 | [8.24,9.62] | [15.14,15.89] | 15.89 |
| Commercial i=5 | 9.36 | 0 | 0 | 0 | 0 |
Table 3: Results of decision various about shortage.
±and 5 j STG ± ( 1...5) j = equal to zero, In Table 3, 1 j STG
which means that there is no shortage of oil for agricultural and municipal unit, no matter how serious the disruption is, and is fitted with the fact we observed from table 1 that the demand of these two sectors must be first guaranteed in case of disruption. The solutions $$ G _ {2 2} ^ {\pm} = S T G _ {2 3} ^ {\pm} = $$ $$ G _ {2 1} ^ {\pm} = S T G _ {2 2} ^ {\pm}: $$ $$ G _ {2 3} ^ {\pm} = 0 \mathrm {a n d} S T G _ {2 4} ^ {\pm} = [ 5. 3 6, 1 1. 0 8 ] \mathrm {s} $$ ±= show
21 STG us that the oil demand of industrial unit is able to be satisfied in case of slight case and moderate case, there
7 [5.36,11.08] 10 × tons with a will be a shortage of probability of 5% when a serious disruption occurs. Only
7 3.09 10 × tons be brought to constructional sector, and the demand will be completed satisfied in the other cases. When a disruption occurs, oil can’t be sufficiently delivered to transport sector no matter what shortage level the disruption brings, and the shortage will be a serious disruption happens, can a shortfall of
7 [8.24,9.62] 10 × ,
7 [15.14,15.89] 10 × and
7 15.89 10 × tons, respectively.
| Normal J=1 | Slight J=2 | Moderate J=3 | Serious J=4 | |
| Agricultural i=1 | 2.08 | 2.08 | 2.08 | 2.08 |
| Industrial i=2 | 24.94 | 24.94 | 24.94 | [13.86,19.58] |
| Construction i=3 | 3.09 | 3.09 | 3.09 | 0 |
| Transportation i=4 | 6.54 | [6.27,7.65] | [0,0.75] | 0 |
| Commercial i=5 | 9.36 | 9.36 | 9.36 | 9.36 |
| Benefit $F_{opt}^{\pm}$ | [514.11,951.95] | |||
| Reliability $\lambda_{opt}^{\pm}$ | [0.16,0.94] |
Table 4: Optimal allocation under various degree of shortage.
Table 4: Optimal allocation under various degree of shortage. We can also get optimized oil-allocation by , , , ijopt iopt ijopt OA POIL STG i j ± ± ± = − the optimal objective value and corresponding system reliability are [514.11,951.95] trillions yuan and [0.16,0.94] , respectively, which means the optimal upper bound of net benefit is 951.95 trillions yuan with a reliability level of 0.94, and the lower bound is 514.11 trillions yuan with a reliability level of 0.16. We can conclude that the solution of net benefit fulfills the fuzzy objective or constraints well, and is of great practical use.
Journal of Ecology & Natural Resources
![Figure 2: Net benefits under different subjective oil-allocation target. We combine the oil allocation into our model above, and get the optimal oil delivered to all sectors under different cases. In order to make a comparison, we show ± are some subjective values, the the solutions when _i_ _POIL_ results will be included in the following Table 5. If the manager is optimistic about the available oil, he would like to let the targeted allocation be the upper bound, i.e., _i_ _i_ _POIL_ _POIL_ ± + = , in this case, if the demand is completely satisfied, then he could expect a higher benefit, at the same time, he has to take a higher risk of heavy losses in case of insufficient supply. Then we get the net benefit [495.72,922.34] trillion yuan with the system reliability to be[0.13,0.92]. The lower bound of the allocation target will be chosen, if the user is a risk averter, i.e., _i_ _i_ _POIL_ _POIL_ ± − = , the he will get a lower risk of having heavy penalty if the promised oil is not delivered completely, and of course he can only obtain a moderate benefit even his target is reached. Then there will be a reduced the net benefit of [459.8,730.57] trillion yuan in this case, and corresponding to a reliability of [0.0007,0.9961]. To a person of risk neutral, he would like to set the oil-allocation target at its median value, i.e., _i_ _i_ _POIL_ _POIL_ ±= and _i_ _i_ _POIL_ _POIL_ ±= , then he will get a _mid_ _mid_ moderate result both on loss and benefit, and the system net benefit is[485.56,829.65], with a reliability level between 0.098 and 0.947. According to the analysis above, the net benefit and corresponding reliability level closely relate to the allocation target and decision- maker’s risk preference, which has great effect on the results of allocation when a disruption occurs. The result comparisons are shown in Figure 2.](/fulltextimages/738/fig_2.png)
Figure 2: Net benefits under different subjective oil-allocation target. We combine the oil allocation into our model above, and get the optimal oil delivered to all sectors under different cases. In order to make a comparison, we show ± are some subjective values, the the solutions when i POIL results will be included in the following Table 5. If the manager is optimistic about the available oil, he would like to let the targeted allocation be the upper bound, i.e., i i POIL POIL ± + = , in this case, if the demand is completely satisfied, then he could expect a higher benefit, at the same time, he has to take a higher risk of heavy losses in case of insufficient supply. Then we get the net benefit [495.72,922.34] trillion yuan with the system reliability to be[0.13,0.92]. The lower bound of the allocation target will be chosen, if the user is a risk averter, i.e., i i POIL POIL ± − = , the he will get a lower risk of having heavy penalty if the promised oil is not delivered completely, and of course he can only obtain a moderate benefit even his target is reached. Then there will be a reduced the net benefit of [459.8,730.57] trillion yuan in this case, and corresponding to a reliability of [0.0007,0.9961]. To a person of risk neutral, he would like to set the oil-allocation target at its median value, i.e., i i POIL POIL ±= and i i POIL POIL ±= , then he will get a mid mid moderate result both on loss and benefit, and the system net benefit is[485.56,829.65], with a reliability level between 0.098 and 0.947. According to the analysis above, the net benefit and corresponding reliability level closely relate to the allocation target and decision- maker’s risk preference, which has great effect on the results of allocation when a disruption occurs. The result comparisons are shown in Figure 2.
| POIL POIL i i | POIL POIL i i | POIL POILmid i i | |||||||||
|---|---|---|---|---|---|---|---|---|---|---|---|
| STG 11 | 0 | 0 | 0 | ||||||||
| STG 12 | 0 | 0 | 0 | ||||||||
| STG 13 | 0 | 0 | 0 | ||||||||
| STG 14 | 0 | 0 | 0 | ||||||||
| STG 21 | 0 | 0 | 0 | ||||||||
| STG 22 | 0 | 0 | 0 | ||||||||
| STG± 23 | 0 | 0 | 0 | ||||||||
| STG 24 | [5.32,10.62] | [0,0.74] | [0.61,5.46] |
Journal of Ecology & Natural Resources
| STG± 31 | 0 | 0 | 0 |
|---|---|---|---|
| STG 32 | 0 | 0 | 0 |
| STG 33 | 0 | 0 | 0 |
| STG 34 | 3.09 | [0,1.48] | 2.69 |
| STG 41 | 14.78 | 0 | 7.16 |
| STG 42 | [13.77,14.61] | 0 | [5.97,6.06] |
| STG 43 | [20.7,21.53] | [5.14,5.29] | [12.84,14.98] |
| STG 44 | 21.53 | [14.15,15.91] | 18.71 |
| STG 51 | 0 | 0 | 0 |
| STG 52 | 0 | 0 | 0 |
| STG 53 | 0 | 0 | 0 |
| STG 54 | 0 | 0 | 0 |
| F | [495.72,922.34] | [459.80,730.57] | [485.56,829.65] |
| | [0.1273,0.9236] | [0.0007,0.9961] | [0.0981,0.9474] |
Table 6: Solutions under different oil-allocation cases.
Conclusions and Policy Implications
Oil issues has been the hottest problems since the two global oil crises in 1970s, lots of attention had been paid on the oil supply disruptions, but few people focused on the oil-allocation issue in case of disruption occurs, especially for China. Most developed countries have established sufficient strategic petroleum reserves of at least 90 days of net import oil, but too many countries like China whose SPR system is far from sufficiency with its scale less than 30 days of its net import oil, the problem of allocating limited oil to all the users effectively is of great importance. By considering uncertainties about GDP growth rate and system disruption risks, we employ interval-parameter two-stage fuzzy stochastic programming model to maximize the overall system net benefits. The agricultural unit holds the largest economic and social influence in the whole country, so incomplete allocation is unallowable in any levels of shortage; for industrial and constructional sectors, the shortages appear only when serious disruption occurs, then there
7 [5.36,11.08] 10 × tons with optimal allocation target to be 24.94 ten million tons for the industrial unit and no oil will be delivered to constructional sector in this case; once a supply- disruption occurs, there will be a shortfall to the will be a shortage of
7 [8.24,9.62] 10 × , transportation unit, with a level of
7 [15.14,15.89] 10 × and
7 15.89 10 × tons under different disruption scenarios. The first-stage oil demand policy is closely related to our results, just like the comparison computation showing, the decision-maker who has different risk preference will get different oil-allocated and net system benefit. It’s not difficult to observe from the conclusions above that the agricultural sector is the most important unit within the entire country, the oil therefore must be first delivered to this sector in case of disruption, which fits with our common sense. Hence, the decision-makers in these two sectors can make their production plan normally to maximize their net benefit and ensure healthy and safe development of economy and society. It’s no necessary for managers in the industrial and constructional sectors to curtail their expansion plans Journal of Ecology & Natural Resources
unless a serious oil supply disruption appears, oil demands are able to be satisfied in most scenario set in this paper. Agents in transportation sector should get a clear picture of its situation that there would be a shortage whenever a disruption occurs no matter how severe it is. And the limited oil should be firstly delivered to the public transport part in order that oil demand of day-to-day transport and travel could be satisfied; meanwhile, private transport should be control up to a point, especially the vehicle with large engine displacement. The government could make great effort to improve public transport infrastructure and encourage use of public transport, they can also engage in sponsoring research and development work to increase the efficiency of transportation vehicle and facilities and promoting alternative fuels such as alcohol fuel, reducing vulnerability to oil supply shortfall and alleviating the impact of oil disruption. For a country like China whose strategic petroleum reserves system is far from sufficiency, it’s meaningful to study the problem of oil allocation among its core sectors in case of supply disruptions, which will be benefit to ensure the energy demand stability and economy security. Interval-parameter fuzzy two-stage stochastic programming model is a powerful tool to solve the oil allocation problem under uncertainty, by which we study the issue of how to allocate the limited oil to all the key sectors optimally under several possible scenarios and obtain some useful results. There are some aspects that have not been captured in this paper, some for the limitation of our model, and others may be left for further research in the future. First, more sectors than five should have been considered in this study, but including more sectors means to deal with relationships among them, which is one of the limitations of our model. Second, we may replace the cost and benefit coefficients in the objective function by some curves that may allow the consideration of economies of scale and improve our results.
Acknowledgements
Great honor and thanks should be delivered to Dr. Qinghua Bi for his contribution on CGE simulation. Financial support for this work was provided by the National Natural Science Foundation of China under grant number 71503242.
References
-
International Energy Agency (IEA) (2004) World energy outlook. Pairs, France.
-
Tian CR (2011) China’s oil imports and exports in 2010, International Petroleum Economics 3.
-
Beccue PC, Huntington HG (2005) An assessment of oil market disruption risk. Final Report EMF SR 8.
-
Nesbitt DM, Choi III TY (1988) The numbers says no. The Energy Journal 9(3): 29-31.
-
Broadman HG, Horgan WW (1988) II the number says yes. The Energy Journal 9(3): 7-29.
-
Bohi DH, Toman MA (1993) Energy security: externalities and policies. Energy Policy 21(11): 1093-1109.
-
Greene DL, Leiby PN (2006) The oil security metrics model. Oak Ridge National Labouatory ORNL/TM- 2006/505.
-
Leiby PN, Jones DW, Curlee TR, Lee R (1997) Oil imports: an assessment of benefits and costs. Oak Ridge National Laboratory.
-
Parry WH, Damstadter J (2003) The costs of US Oil Dependency. Resources for the future 3-59.
-
Leiby PN (2007) Estimating the Energy Security Benefits of Reduced US Oil Imports. Oak Ridge National Laboratory.
-
International Energy Agency (2007) Energy Security and Climate Policy Assessing Interaction. OECD, IEA.
-
Hedenus F, Azar, C, Johansson D (2010) Energy security policies in EU-25—The expected cost of oil supply disruptions. Energy Policy 38(3): 1241-1250.
-
Teisberg TJ (1981) A dynamic programming model of the US strategic petroleum reserve. The Bell Journal of Economics 12(2): 526-546.
-
Samouilidis JE (1985) On the optimal level of a small country’s strategic petroleum. European Journal of Operational Research 20(2): 190-197.
-
Oren SS, Wan SH (1986) Optimal strategic petroleum reserve policies: a steady state analysis. Management Science 32(1): 14-29.
-
Murphy FH, Toman MA, Weiss HJ (1987) A stochastic dynamic Nash game analysis of policies for managing the strategic petroleum reserves of consuming nations. Management Science 33(4): 484-499.
-
Wei YM, Fan Y, Han ZY, Wu G (2006) China Energy Report (2006): Strategy and Policy Research. Science Press, Beijing (in Chinese). Journal of Ecology & Natural Resources
-
Wei YM, Wu G, Fan Y, Liu LC (2008) Empirical analysis of optimal strategic petroleum reserve in China. Energy Economics 30(2): 290-302.
-
Wu G, Fan Y, Liu LC, Wei YM (2008) An empirical analysis of the dynamic programming model of stockpile acquisition strategies for China’s strategic petroleum reserve. Energy Policy 36(4): 1470-1478.
-
Zhang XB, Fan Y, Wei YM (2009) A model based on stochastic dynamic programming for determining China’s optimal strategic petroleum reserve policy. Energy Policy 37(11): 4397-4406.
-
Fan Y, Zhang XB (2010) Modeling the strategic petroleum reserves of China and India by a stochastic dynamic game. Journal of Policy Modeling 32(4): 505- 519.
-
Maqsood I, Huang GH, Yeomans JS (2005) An interval- parameter fuzzy two-stage stochastic program for water resources management under uncertainty. European Journal of Operational Research 167(1): 208-225.
-
Huang GH, Loucks DP (2000) An inexact two-stage stochastic programming model for water resources management under uncertainty. Civil Engineering and Environmental Systems 17(2): 95-118.
-
Huang GH (1996) IPWM: An interval-parameter water quality management model. Engineering Optimization 26(2): 79-103.
-
Zimmermann H (1985) Fuzzy Set Theory and its Applications. Kluwer-Nijhoff Publishing.
- Lessons to Learn: Trees are More than the Lungs of the World
- Community Forestry Enterprises as a Model for Sustainable Forest Development: The Case Of The "Baja Tarahumara" in Chihuahua, Mexico
- Ecological and Socio-Economic Impacts of Chromolaena odorata and Mesosphaerum suaveolens, Two Invasive Alien Species in Central and Southern Benin, West Africa
- Epigenetic Sustainability: Modeling the Human Factor as a Natural Resource through Science 4.0 and the NR3C1 Biological Pilot
- Growth-at-Risk: A Framework for Assessing Economic Vulnerability
- The Rural Territory as a Socioecological System for the Management of Public Policy for Sustainable Rural Development