Trees Species Structure and Diversity in the Lowland – Rain Forest Zone of Bayelsa State
<p>Bayelsa State was divided into three zones (Bayelsa East, Bayelsa West and Bayelsa West) based on Nigeria political delineation, and a sample plot measuring 30m by 30m was selected from a forest in each zone. Tree species structure and diversity of selected sample plots were assessed. Sampling technique was employed to collect data of trees; and trees that were 2meter high at diameter at breast height (dbh) ≥4m in the sampling plots were identified and classified accordingly. Scale of abundant in relation to relative density was used to determine the abundant status of tree species encountered. A total of 164 living trees of different dimension belonging to 22 families were encountered, all trees encountered were indigenous trees. The highest and least basal areas (0.64m2 and 0.04m2) in the sample plot at Imringi community in Bayelsa East Senatorial district were contributed by Pycnanthus angolensis and Uapaca guineensis respectively. While Laccosperma secundiflorum and Garcina manii had the least and highest basal area of 0.002m2 and 0.87m2 respectively in Tombia community, Bayelsa Central Senatorial district. Eleais guineensis and Laccosperma secundiflorum with 0.74m2 and 0.01m2 respectively contributed the highest and least basal areas in the sample plot at Amatolo community, Bayelsa West Senatorial district. The sample communities had high tree species diversity, yet the tree species distribution skewed with respect to the intermediate class. This study is a pointer to the fact that forest communities in the area are rich in tree species yet, pressure from illegal logging, oil exploration and constant inundation by flood threaten tree species survival. Thus management plans to sustain and preserve forest tree species diversity in the State were proposed.</p>
Introduction
Forests throughout the earth are vital for local communities around, and to the entire world on a global scale. Aside from being a source of carbon sequestration and climate control, they serve in various categories of ecosystem services- provisioning (of food and water), supporting (such as nutrient recycling and primary production) as well as cultural (such as spiritual, and recreational benefits) [1]. However, forests in the tropical rainforest belt are distinct from others in terms of species richness and high level of diversity. Physiognomically, Journal of Ecology & Natural Resources
they feature a closely pack evergreen canopy trees with mesophyllic leave [2] and are the most complex ecosystems and major vegetation type of the globe [3] and Gebreselasse, [4]. According to Wilson [5], rainforest cover only 7% of the earth’s land surface; and contain more than half the species in the entire world, an indication of the presence of a correspondingly great diversity of food webs and trophic relationship connection. Despite their extraordinary richness, tropical forests are the most fragile of all habitats [5], and trees species plays significant role in their multiplicity. According to Cannon, et al. [6] the diversity of trees is fundamental to total rainforest biodiversity, and trees are often the most conspicuous plant life form in a tropical forest [7]. Yet, tropical forest habitat are vulnerable to deforestation and degradation [8], and might plummet into sparsely distributed standing stock and resultant loss of species diversity in due course, as continue timber cutting without replacement had been observed to be one of the factors responsible for biodiversity loss [9]. Habitat lost to deforestation reduces not only the number of species in the ecosystem, but also the member and extent of place where of species coexist [10]. In Nigeria, specifically in the tropical rainforest zone, tree species diversity and resilience are mainly affected by human-caused disturbance: logging, slash and burn agricultural practice, shifting cultivation cycle, exploration and exploitation of crude oil, urbanization and anthropogenic activities as well as oil spill. Wanton removal of trees species through these activities is very inimical to biological conservation and are fast acting especially on species with narrow range. While tightly packed trees with high levels of endemicity dominates the vegetation types ̶ lowland rainforest, fresh water swamp forest and mangroves of Bayelsa State, deforestation takes its toll on the forest communities. In fact, vast portion of the forests has either been degraded by exploration activities, logging or converted to farmland. According to Marcia, et al_._ [11]. disturbance caused by logging strongly change environmental conditions for plant growth and survival in tropical forests. At presently, a gross dearth of literature on tree species composition, diversity and conservation plans abound in Bayelsa State. Consequently, sampling aim to assess the status of tree species in the lowland forest zone of the State is carried out and management plan that could ensure sustainable use and effective conservation is suggested. The data presented in this study form an important basis for comparison of tree species composition and diversity in the lowland forest of Bayelsa State senatorial districts.
Study Area
The study was conducted in forest communities at Bayelsa State. Three (3) sites were chosen for the study, a site in Imiringi, Tombia and Amatolo community at Bayelsa East (BE), Bayelsa Central (BC) and Bayelsa West (BW) senatorial distinct respectively. The sites lie within Lat. 4° 39' N and 5o 25'S; Long. 6o19' E and 5o 22 'W. The area is a lowland belt about 30 metres below sea level [12], in the core section of the Niger Delta region of Nigeria. The prevalent climate is humid sub-tropical with annual rainfalls approximately 4900mm and a relative humidity of about 85%; temperature varies from 25oc to 31oc annually. The vegetation type is the lowland rainforest type mainly in the north and mangrove swamp forest type in the southern end. Bayelsa State is rich in fertile soil and plant species diversity, a factor that endears the rural dwellers mostly to agriculture related occupations.
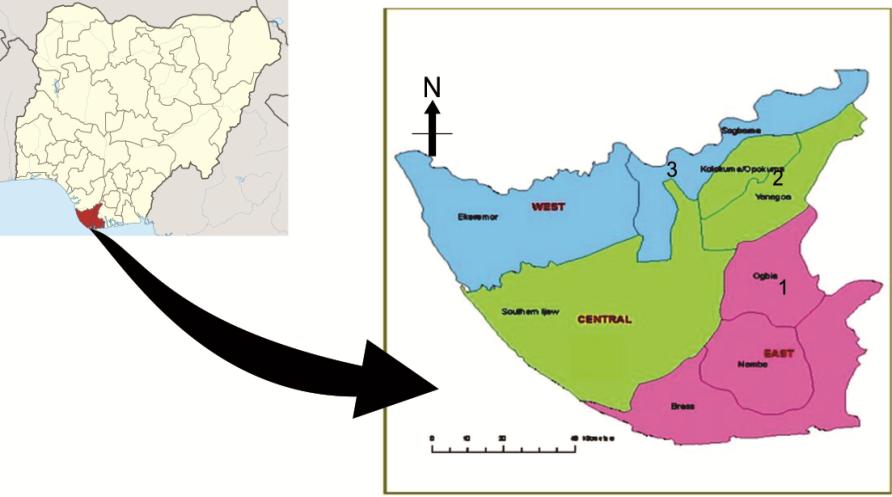
Figure1: Map of Nigeria and Bayelsa State showing the locations of the Study area.
Journal of Ecology & Natural Resources
Data collection
Systematic sampling design was used for the selection of the sampling plots. Sampling was done in forested area of three (3) communities namely: Imringi, Amatolo and Tombia located in BE, BW, and BE senatorial district respectively. The sample plots measured 30m by 30m in size (i.e. 900sqm). All living trees above 2metres high with diameter at breast height greater than or equal 4m (dbh≥ 4m) within the sample plots were identified and classified accordingly. The dbh were measured with metal rule calibrated in centimeter (cm). Fruits, twigs and flowers were collected to confirm the identity of the species assessed in the sample plots. Botanical names of the trees that were measured in each sample plot were recorded for each of the study plot. Specimen voucher of trees that could not be identified immediately were collected and preserved for identification at the herbarium of Plant Science and Biotechnology Department, University of Port Harcourt Rivers State. The diversity indices of the tree species identified in the three sampling plots were extrapolated according. Also, the relative abundance status of the tree species from each plot was determined.
Analysis of Tree Species Diversity
The following indices of diversity were used: (i) Shannon-wiener index of diversity (H') = -pi∑ (logpi) Where pi= number of individual Log pi= Natural log of pi (ii) Simpson index (S): S =∑ pi2 Pi is the same as in Shannon-wiener index (iii) Equitability index (E) as: E=H'/logS Where “H'” is Shannon wiener index and “S” is the total number of species. The Basal area (Ba) (i.e. the cross-sectional area at breast height) of all trees in the sample plots were calculated using the formula Ba= πd2/4, where d= diameter at breast length in cm and π=3.142. The Total Basal area (TBa) for each sample plot was obtained by summing the Ba of all trees in the plot. The relative density (Rd) of each tree species in the sample plots was calculated as follows: Rd (%) = number of individual tree species/total of number of trees sampled X 100%. Abundance of the tree species assessed was determined using the scale of abundant in relation to their relative densities (Rd) as adopted by Edet, et al. [13]: Very abundant (Rd ≥ 5.00); Abundant (Rd, 4.99 – 4); Frequent (Rd, 3.99 – 3); Occasional (Rd, 2.99 – 2) and Rare (Rd, 1.99 – 0).
Results
Within the sample plots in the 3 geopolitical zones of the state a total of 164 living trees (in different dimension) belonging to 22 families were encountered and their girths measure at 1.37m dbh. Tables 1-3 show the tree species structure and their abundant status in the sample plot at Imringi community, Tombia (community) and Amatolo community. 56 trees belonged to 19 families were encountered in the (30m X 30m) sample plot at Imringi in Bayelsa East Senatorial district (Table 1).
| Species name | NS* | †Mdbh | RD** | ††BA | -(PiLNPi) | ||
|---|---|---|---|---|---|---|---|
| Anacardiaceae | Spondias mombin (L) | 2 | 38.8 | 3.57 | 0.24 | 0.12 | |
| Annonaceae | Monodora myristica (Gaertn.) | 1 | 50.2 | 1.79 | 0.02 | 0.07 | |
| Annonaceae | Cleistopholis patens (Benth.) | 2 | 21.75 | 3.57 | 0.08 | 0.12 | |
| Apocynaceae | Alstonia boonei (De. Wild) | 2 | 29.8 | 3.57 | 0.19 | 0.12 | |
| Apocynaceae | Funtumia elastica (Preuss) | 2 | 31.8 | 3.57 | 0.18 | 0.12 | |
| Arecaceae | Eleais geineensis (Jacq.) | 2 | 41.65 | 3.57 | 0.27 | 0.13 | |
| Clusiaceae | Garcina manii (L.) | 1 | 33.8 | 1.79 | 0.09 | 0.07 | |
| Clusiaceae | Mammea africana (L) | 1 | 57 | 1.79 | 0.26 | 0.07 | |
| Euphorbiaceae | Anthostema aubryanum (Baill.) | 1 | 49 | 1.79 | 0.19 | 0.07 | |
| Euphorbiaceae | Mucaranga barteris (Mull. Arg.) | 1 | 40.2 | 1.79 | 0.13 | 0.07 | |
| Gentianaceae | Anthocleista vogelii (Planch.) | 2 | 26.5 | 3.57 | 0.11 | 0.12 | |
| Gentianaceae | Anthocleista djalonensis (A. Chev.) | 1 | 44.9 | 1.79 | 0.16 | 0.07 | |
| Humiriaceae | Sacoglottis gabonensis (Baill.) | 1 | 54.6 | 1.79 | 0.23 | 0.07 | |
| Irvingiaceae | Irvingia gabonensis (Baill.) | 4 | 40.15 | 7.14 | 0.56 | 0.19 | |
| Lamiaceae | Vitex grandifolia (Gurke) | 1 | 39.7 | 1.79 | 0.12 | 0.07 | |
| Meliaceae | Carapa procera (DC.) | 2 | 32.3 | 3.57 | 0.16 | 0.12 | |
| Moraceae | Ficus exasperata (Vahl) | 3 | 34.27 | 5.36 | 0.29 | 0.16 | |
| Moraceae | Ficus capensis (Thunb.) | 3 | 35.7 | 5.36 | 0.33 | 0.16 | |
| Moraceae | Treculia africana (Decne.) | 2 | 43 | 3.57 | 0.34 | 0.12 | |
| Moraceae | Ficus mucuso (Welw.) | 3 | 35.7 | 5.36 | 0.33 | 0.16 | |
| Moraceae | Myristicaceae | Pycnanthus angolensis (Welw.) | 5 | 39.1 | 8.93 | 0.68 | 0.22 |
| Pandaceae | Panda oleosa (Pierre) | 3 | 32.43 | 5.36 | 0.31 | 0.57 | |
| Passifloraceae | Barteria nigritaria | 1 | 51.6 | 1.79 | 0.21 | 0.07 | |
| Phyllanthaceae | Uapaca heudelotii (Baill.) | 3 | 37.2 | 5.36 | 0.4 | 0.16 | |
| Phyllanthaceae | Uapaca guineensis (Mull. Arg) | 1 | 22.6 | 1.79 | 0.04 | 0.07 | |
| Rutaceae | Zanthoxylum gilletii (De Wild.) | 2 | 18.8 | 3.57 | 0.11 | 0.12 | |
| Sapotaceae | Pachystela brevipes (Baker) Engl. | 2 | 41.65 | 3.56 | 0.28 | 0.12 | |
| Urticaceae | Musanga cecropoides (R.Br.) | 2 | 37.35 | 3.56 | 0.22 | 0.12 |
Journal of Ecology & Natural Resources
Table 1: Tree Species Structure & Abundant Status in the study area at Imiringi community of Bayelsa East Senatorial Table 1: Tree Species Structure & Abundant Status in the study area at Imiringi community of Bayelsa East Senatorial District. *Number of Species, Relative Density, *Species Abundant Status, BA (Basal Area), Mdbh (Mean diameter breast height) Members of the moraceae family were the prevalent species in the plot; however, P. angolensis was the dominant tree encountered and with the highest relative density (RD) in the sample plot. Also, the scale of abundant (Table 1) reveals that 10 of the tree species encountered are rare, 11 are Frequent and 7 others are very abundant: representing 35.7%, 39.3% and 25% in the plot respectively. The highest and least basal areas (0.64m2 and 0.04m2) were contributed by Pycnanthus angolensis and Uapaca guineensis respectively. Mammea africana had the highest Mdbh (57cm) in the sample plot at Imringi. Table 2 reveals that 47 trees belonged to 18 different families were encountered in the (30m X 30m) sample plot at Tombia community in Bayelsa Central Senatoria district. Spondias monbins; Alchornia cordifolia, Carapa procera and Uapaca heudelotii were the dominant tree species encountered, each have 3 individual trees; while Clusiaceae family had the highest members of tree species (4 species) with six individual trees. On the scale of abundant: 4, 11 and 11 species out of the trees encountered in the plot were very abundant, abundant and rare respectively: corresponding to 15.4%, 42.3% and 42.3%. Nauclea diderrichii (53.80cm) had the highest mean diameter at breast height (Mdbh). L. secundiflorum and G. manii had the least and highest basal area 0.002m2 and 0.87m2 respectively.
| FAMILIES | Species name | NS* | Mdbh† | RD** | BA†† | -(PiLNPI) | |
|---|---|---|---|---|---|---|---|
| Anacardiaceae | Spondias mombin (L) | 3 | 20.97 | 6.38 | 0.1 | 0.18 | |
| Annonceae | Cleistopholis patens (Benth.) | 1 | 28.4 | 2.13 | 0.06 | 0.08 | |
| Apocynaceae | Alstonia boonei (De. Wild) | 2 | 31.45 | 4.26 | 0.17 | 0.13 | |
| Arecaceae | Eleais geineensis (Jacq.) | 2 | 43.4 | 4.26 | 0.3 | 0.13 | |
| Arecaceae | Laccosperma secundiflorum(Kuntze) | 2 | 3.6 | 4.26 | 0.002 | 0.13 | |
| Clusiaceae | Garcina manii (L.) | 1 | 22 | 4.26 | 0.87 | 0.13 | |
| Clusiaceae | Symphonia globulifera (L.) | 1 | 32.1 | 2.13 | 0.08 | 0.08 | |
| Clusiaceae | Harungana madagascariensis (Lam.) | 2 | 20.4 | 2.13 | 0.03 | 0.08 | |
| Clusiaceae | Mammea Africana (L) | 1 | 40.35 | 4.26 | 0.29 | 0.13 | |
| Euphorbiaceae | Mucaranga barteris (Mull. Arg.) | 3 | 12.9 | 2.13 | 0.01 | 0.88 | |
| Euphorbiaceae | Alchornea cordifolia (Mull. Arg.) | 1 | 13 | 6.38 | 0.04 | 0.04 | |
| Fabaceae | Afzelia bipindensis (Harms.) | 2 | 28.8 | 2.13 | 0.07 | 0.08 | |
| Gentianaceae | Anthocleista vogelii (Planch.) | 1 | 23.1 | 4.26 | 0.09 | 0.13 | |
| Gentianaceae | Anthocleista djalonensis (A. Chev.) | 2 | 43.1 | 21.6 | 0.15 | 0.08 | |
| Humiriaceae | Sacoglottis gabonensis (Baill.) | 1 | 47.05 | 4.26 | 0.35 | 0.13 | |
| Irvingiaceae | Irvingia gabonensis (Baill.) | 2 | 39.7 | 2.13 | 0.12 | 0.08 | |
| Meliaceae | Carapa procera (DC.) | 1 | 31.47 | 6.38 | 0.24 | 0.18 | |
| Meliaceae | Khaya ivorensis (Chev.) | 3 | 49.3 | 2.13 | 0.19 | 0.08 | |
| Moraceae | Ficus mucuso (Welw.) | 1 | 37.6 | 4.26 | 0.23 | 0.13 |
Journal of Ecology & Natural Resources
| Treculia africana(Decne.) | 2 | 50.25 | 4.26 | 0.41 | 0.13 | |
| Myristicaceae | Pycnanthus angolensis(Welw.) | 2 | 47.47 | 4.26 | 0.36 | 0.13 |
| Pandaceae | Panda oleosa(Pierre) | 1 | 43.6 | 2.13 | 0.15 | 0.08 |
| Phyllanthaceae | Uapaca heudelotii(Baill.) | 3 | 22.2 | 6.38 | 0.13 | 0.18 |
| Rubiaceae | Nauclea diderrichii(De Wild.) | 1 | 53.8 | 2.13 | 0.23 | 0.08 |
| Rubiaceae | Mitragyna stipulosa(DC.)Kuntze | 1 | 49.9 | 2.13 | 0.2 | 0.08 |
| Sapotaceae | Pachystela brevipes(Baker) Engl.2 | 2 | 35.25 | 4.26 | 0.2 | 0.13 |
| Urticaceae | Musanga cecropoides(R.Br.) | 2 | 33.35 | 4.26 | 0.18 | 0.13 |
Table 3: Tree Species Structure & Abundant Status in the study area at Tombia Community of Bayelsa Central Senatorial Table 2: Tr
Table 2: Tree Species Structure & Abundant Status in the study area at Tombia Community of Bayelsa Central Senatorial Table 2: Tree Species Structure & Abundant Status in the study area at Tombia Community of Bayelsa Central Senatorial District. *Number of Species, Relative Density, SAS=Species Abundant Status, ††Basal Area, Mean †diameter breast height In the sample plots at Amatolo community of Bayelsa West senatorial district (Table 3); 24 tree species were encountered, members of Arecaceae, Clusiaceae, Euphorbiaceae and Meliaceae families were the major tree species in the plot. Yet, Eleais geineensis, Carapa procera, Panda oleosa and Nauclea diderrichii (each with 4 individuals) were the dominant tree species encountered in the sample plot. The scale of abundant reveals that 4 (16.7%) of the tree species were very abundant, 8 (33.3%) were abundant, 9 (37.5%) were frequent and 3 (12.5%) were rare**. RD in the sample plots increased with increase in the number of each tree species encountered, but varies with the Mdbh. E. guineensis and L. secundiflorum with the values 0.74m2 and 0.01m2 respectively contributed the highest and least basal area in the sample plot.
| FAMILIES | Species name | NS* | Mdbh† | RD** | BA†† | -(PiLNPi) | SAS*** | |
|---|---|---|---|---|---|---|---|---|
| Anacardiaceae | Spondias mombin (L) | 2 | 33.8 | 3.28 | 0.18 | 0.11 | F | |
| Annonceae | Cleistopholis patens (Benth.) | 2 | 36.55 | 3.28 | 0.22 | 0.11 | F | |
| Apocynaceae | Funtumia elastic (Preuss) | 3 | 27.1 | 4.92 | 0.19 | 0.15 | A | |
| Arecaceae | Eleais geineensis (Jacq.) | 4 | 48.23 | 6.56 | 0.74 | 0.18 | VA | |
| Laccosperma secundiflorum(Kuntze) | 1 | 8.2 | 1.64 | 0.01 | 0.07 | R | ||
| Clusiaceae | Garcina manii (L.) | 2 | 17.5 | 3.28 | 0.05 | 0.11 | F | |
| Symphonia globulifera (L.) | 3 | 42.6 | 4.92 | 0.51 | 0.15 | A | ||
| Ctenolophonaceae Ctenolophon englerianus(Mildbr.) | Ctenolophon englerianus(Mildbr.) | 2 | 44.55 | 3.28 | 0.32 | 0.11 | F | |
| Euphorbiaceae | Anthostema aubryanum (Baill.) | 2 | 48.8 | 3.28 | 0.19 | 0.11 | F | |
| Mucaranga barteris (Mull. Arg.) | 1 | 20.6 | 1.64 | 0.03 | 0.07 | R | ||
| Fabaceae | Piptadeniastrum africanum (Hook. F.) | 3 | 32.35 | 4.92 | 0.45 | 0.15 | A | |
| Gentianaceae | Anthocleista vogelii (Planch.) | 2 | 31.55 | 3.28 | 1.43 | 0.11 | F | |
| Irvingiaceae | Irvingia gabonensis (Baill.) | 3 | 35.05 | 4.92 | 0.37 | 0.15 | A | |
| Lamiaceae | Vitex grandifolia (Gurke) | 3 | 31.57 | 4.92 | 0.26 | 0.15 | A | |
| Meliaceae | Carapa procera | 4 | 32.33 | 6.56 | 0.28 | 0.18 | VA | |
| Ficus exasperata (Vahl) | 3 | 32.63 | 4.92 | 0.18 | 0.15 | A | ||
| Myristicaceae | Pycnanthus angolensis (Welw.) | 2 | 33.55 | 3.28 | 0.19 | 0.11 | F | |
| Ochnaceae | Ouratea schoenleiniana (Oliv.) | 1 | 14.2 | 1.64 | 0.02 | 0.07 | R | |
| Pandaceae | Panda oleosa (Pierre) | 4 | 33.15 | 6.56 | 0.37 | 0.18 | VA | |
| Phyllanthaceae | Uapaca heudelotii (Baill.) | 2 | 36.2 | 3.28 | 0.21 | 0.11 | F | |
| Rubiaceae | Nauclea diderrichii (De Wild.) | 4 | 29.75 | 6.56 | 0.38 | 0.18 | VA | |
| Rutaceae | Zanthoxylum gilletii (De Wild.) | 2 | 38.4 | 3.28 | 0.23 | 0.11 | F | |
| Sapotaceae | Pachystela brevipes (Baker) Engl. | 3 | 43.23 | 4.92 | 0.45 | 0.15 | A | |
| Urticaceae | Musanga cecropoides (R.Br.) | 3 | 35.03 | 4.92 | 0.3 | 0.15 | A |
Table 4: Tree Species Structure & Abundant Status in the study area at Amatolo Community of Bayelsa West Senatorial Table 3: Tree
Table 3: Tree Species Structure & Abundant Status in the study area at Amatolo Community of Bayelsa West Senatorial Table 3: Tree Species Structure & Abundant Status in the study area at Amatolo Community of Bayelsa West Senatorial District. *Number of Species, Relative Density, *Species Abundant Status, †Mean diameter at breast height, ††Basal Area
Journal of Ecology & Natural Resources
Table 4 shows that slight variation occurred in species richness of the sample plots. Shannon-wiener index (H') obtained from the sample plots at Imringi, Tombia and Amatolo are 3.216, 3.218 and 3.111 respectively.
| Senatorial | |||||
|---|---|---|---|---|---|
| Districts | |||||
| Indices | Bayelsa East | Bayelsa Central | Bayelsa West | ||
| Imringi | Tombia | Amatolo | |||
| Shanon-Weiner (H) | 3.216 | 3.218 | 3.111 | ||
| Simpson (S) | 0.045 | 0.835 | 0.047 | ||
| Equitability (E) | 0.057 | 0.068 | 0.051 | ||
| *TBA (BA/900Sqm) | 6.816 | 4.454 | 7.549 |
Table 5: Summary of floristic indices of tree species in the selected communities’ forest in Bayelsa State Senatorial Districts.
Table 4: Summary of floristic indices of tree species in the selected communities’ forest in Bayelsa State Senatorial Districts. *Tree Basal Area The highest Simpson(S), 0.835 and Equitability index (E), 0.835 occurred in the sample plot at Tombia, no significant different (p>0.05) occur in the Equitability (index) values of the 3 plots when compared. While the highest Tree Basal Area (7.549m2) occurred in the sample plot at Amatolo community followed by 6.814m2 at Imringi community.
Discussion
The results reveal the distribution pattern of the tree species encountered in the three (3) sample plots. All tree species encounter are indigenous trees. The total number of trees species obtained within the sample plot suggests that the sampled communities have high tree species diversity, and dense vegetation cover. However, the distribution of the trees in the 3 sample plots skewed with respect to the intermediate (mdbh) classes. This can be attributed to forest degradation activities which may have removal wider diameter at breast height (dbh) individuals as well as the fact that some large sized trees would have been removed though logging operation [14]. The dominant families (Arecaceae, Clusiaceae, Euphorbiaceae, Meliaceae, Moraceae, Gentianaceae, Rubiaceaceae, Phyllanthaceae, Apocynaceae and Annonaceae) in the sampled plots confirmed the claims of Akinyemi, et al. [15]; Adekunle and Olagoke [16]; Humphrey and Godwin [7]; Edet, et al_. [13] and Ojo [17] among others who reported the prevalence of the members of Euphorbiaceae, Moraceae, Meliaceae, Clusiaceae, Rubiaceae and Gentimaceac families in the rainforest ecological zone of Nigeria. Perhaps the prevalence of _I. gabonensis in the sample plot at Imringi is simply borne out by the facts that the species is preserved because of its economic values, and the strict penalty attached to illegal logging of the species [18]. High Shannon-wiener values in the sample plots (3.216, 3.218 and 3.111 at Imringi, Tombia and Amatolo respectively) reveal that no significant different (p>0.05) occurred in the tree structure of the 3 plots: this suggests a correspondingly high level of species richness and evenness in the communities. Essentially, the H' values (obtained in the 3 sample plots) favourably compare with the values (3.69, 3.32 and 3.516) obtained in the three sites around Sengaltheri west Ghats as reported by Parthasarathy [19]. And 3.827 obtained by Aigbe, et al. [13] in Afi river forest; and to 3.656, 3.621 and 3.342 obtained by Adekunle [20] for Shasha, Ala and Omo forest reserved respectively. Sampson (S) index with high species dominance indicates lower diversity [21]; unequivocally, a highly dissimilar tree species population would indicate higher diversity level more so, the species indices obtained here clearly implies that the sample plots are in fine fettle. Also, the Equitability (E) index obtained suggests that most of the tree species encountered in the sample plots are similar in their abundant. While the highest level (7.549 Ba/900sqm) of crowdedness (i.e. Basal area) in the standing stocks recorded at Amatolo suggests lowest level of disturbance and high rate of resilience. The sustainability of tree species diversity is critical for ecosystem functioning. This study is a pointer to the fact that forest communities in the area is rich in tree species (at intermediate sizes by dbh); unfortunately, no precise management plan to sustain and preserve tree species diversity in the State; as pressure from illegal logging, oil exploration and constant inundation by flood threaten tree species survival. It is recommended that the existing reserves in the State be reconstituted; besides, people living in rural villages around forest communities in the State should be enlightened on the danger of tree species diversity loss.
References
-
Millennium Ecosystem Assessment (2005) Ecosystems and Human Well-being: Synthesis. Island Press, Washington, DC.
-
Turner IM (2001) The Ecology of Trees in the Tropical Rain Forest. 2nd (Edn.), Cambridge University Press, pp: 1-9.
-
Whitmore TC (1998) An introduction to tropical rain forests. 2nd (Edn.), Oxford University. Journal of Ecology & Natural Resources
-
Gebreselasse GV (2011) Plant communities’ species diversity seedling bank and resprouting in Nandi Forest, Kenya. PhD Thesis, Universitat Koblenz- Landau.
-
Wilson EO (1988) Natural Academics of Science Press. Washington DC, pp: 8-9, 40.
-
Cannon CH, Peart DR, Leighton M (1998) Tree species diversity in commercially logged Bornean rain forest. Science 281(5381): 1366-1368.
-
Humphrey IA, Godwin EO (2015) Tree Species Composition and Diversity in Oban Forest Reserve, Nigeria. Journal of Agricultural Studies 3(1): 10-24.
-
LaFrankie JV, Ashton PS, Chuyong GB, Leonardo CO, Condit R, et al. (2006 ) Contrasting structure and composition of the under story in species-rich tropical rain forests_._ Ecology 87(9): 2298-2305.
-
Kayode J (2007) Conservation Implications of Timber Supply Pattern in Ekiti State, Nigeria. Research J Forestry 1(2): 86-90.
-
Mwakalukwa EE, Meilby H, Treue T (2014) Floristic composition, structure, and species associations of dry Miombo woodland in Tanzania. J ISRN Biodiversity 15.
-
Marcia CM, Dieter L, Ranato G (2008) How long does the Atlantic rain forest take to recover after a disturbance? Change in species composition and ecological features during secondary succession. Biological conservation 141(6): 1717-1725.
-
Ubom UR (2010) Ethnobotany and Biodiversity conservation in the Niger delta of Nigeria. Int J Bot 6(3): 310-322.
-
Edet DI, Ijeomah HM, Ogogo AU (2012) Preliminary assessment of tree species diversity in Afi Mountain Wildlife Sanctuary, Southern Nigeria. Agric Biol J N Am 3(12): 486-492.
-
Aigbe HI, Akindele SO, Onyekwelu JC (2015) Tree Species Diversity and Density Pattern in Afi River Forest Reserve, Nigeria. Int J of scientific & tech research 3(10): 178-185.
-
Adeyemi AA, Ibe AE, Okedimma FC (2015) Tree structural and species diversities in Okwangwo forest, Cross River State, Nigeria. J Research Forestry, wildlife and Environ 7(2): 36-53.
-
Adekunle VAJ, Olagoke AO (2008) Diversity and biovolume of tree species in natural forest ecosystem in the bitumen-producing area of ondo state, Nigeria: A baseline study. Biodivers Conserv 17(11): 2735- 2755.
-
Ojo LO (2004) The fate of a tropical rainforest in Nigeria: Abeku sector of Omo forest reserve. Global Nest J 6(2): 116-130.
-
Kayode JSO, Ihinmikaiye AA, Oyedeji, Arowosegbe S (2016) The potentials of myths and taboos in forest conservation: could they serve as being strategies in Bayelsa state of Nigeria? JOGAE 5(1): 1-6.
-
Parthasarathy N (2001) Changes in forest composition and structure in three sites of tropical evergreen forest around Sengaltheri, Western Ghats. Current Science 80(3): 389-393.
-
Adekunle VAJ (2006) Conservation of tree species diversity in tropical rainforest ecosystem of South- West Nigeria. J Tropical Forest Science 18(2): 91-101.
-
www.researchgate.net/post/Does_anyone_have_expe rience_using_the_Shannon_Wiener_Divers ity_Index_S core.
- Lessons to Learn: Trees are More than the Lungs of the World
- Community Forestry Enterprises as a Model for Sustainable Forest Development: The Case Of The "Baja Tarahumara" in Chihuahua, Mexico
- Ecological and Socio-Economic Impacts of Chromolaena odorata and Mesosphaerum suaveolens, Two Invasive Alien Species in Central and Southern Benin, West Africa
- Epigenetic Sustainability: Modeling the Human Factor as a Natural Resource through Science 4.0 and the NR3C1 Biological Pilot
- Growth-at-Risk: A Framework for Assessing Economic Vulnerability
- The Rural Territory as a Socioecological System for the Management of Public Policy for Sustainable Rural Development