Spatio-Temporal Variation of Fish Assemblages in Ratuwa River, Ilam, Nepal
The spatial and temporal variations of the fish assemblages in rivers and streams of Nepal are poorly understood. The fish community and environmental variables were studied four times a year covering all seasons (Winter/January, Spring/April, Summer/June and Autumn/October) of Ratuwa River over two years (Y1=2017 and Y2=2018). The fish agglomeration was done by using cast net, bamboo fish trap, and mosquito nets with the help of local fisherman. The present findings showed that Ratuwa River is the habitat of 18 fish species belonging to three orders, six families and 12 genera. Fish species like Barilius barila, B. bendelisis, Esomus danricus, Schistura multifaciatus, S. Scaturigina, and Brachydanio rerio are the major contributory species. The order Cypriniformes was found to be most dominant order with 14 fish species. The highest Shannon Weiner diversity index, Simpson index, and Evenness index were recorded from sampling site C and during Winter season and lowest at sampling site A and during Summer season. The redundancy analysis (RDA) portrays significant correlation between fish assemblage and environmental variables. The cluster analysis depicts that similarity between fish species subside as the distance of sites turgid.
Introduction
Spatial and temporal variation in stream fish assemblages occur at scales from microhabitat to basin and die1 to decadal or longer [1]. Understanding and quantifying temporal variation is valuable for clarifying sources of assemblage regulation across stream types and regions [2] identifying species or assemblages with high rates of immigration and emigration, indicating dependence on habitat connectivity [3]. Environmental variables are reported to shape the spatial distribution of fish species (Perry, et al.), affect the temporal dynamics of communities (Rouyer, et al.). The physio-chemical environment influences the fish assemblages, which are spatially heterogenous and temporally variable, and biotic interactions such as competition and predation (Gorman). Some aspects of the fisheries and fish ecological studies such as their diversity, spatial and temporal distribution and abundance in rivers of Nepal are needed [4]. To better monitor, manage and conserve the fisheries, there is an urgent need to update the information on the spatial and temporal fish diversity, community structure and distribution patterns (Ngro, et al.). But, the spatial and temporal variations of the fish assemblages in rivers and streams of Nepal are poorly understood. Therefore, for the better monitor, manage, conserve and also to know their status, study of spatial and temporal variation of fish assemblages in rivers and streams of Nepal are necessary. Therefore, our aim was to determine spatio-temporal variation of fish assemblages in Ratuwa River.
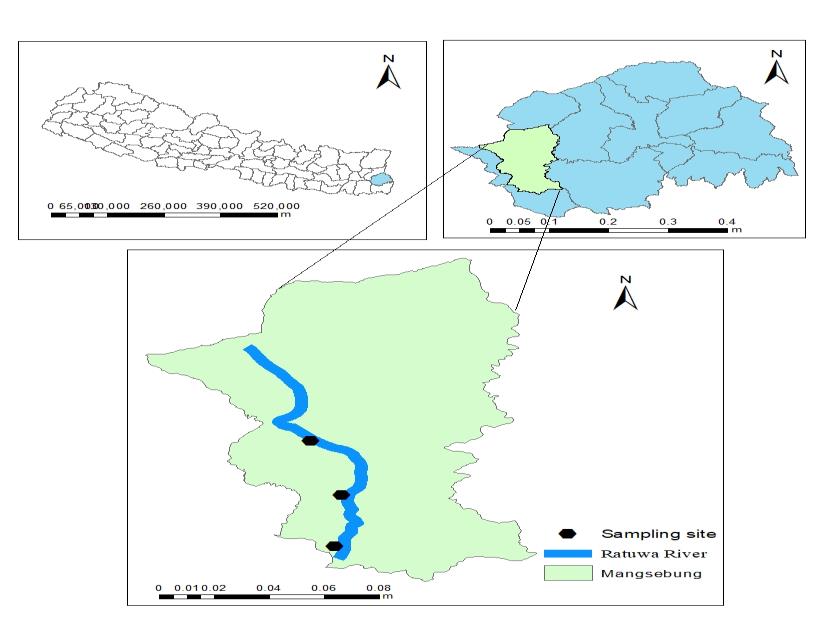
Altogether three sampling sites A, B and C (Figure 1) were designed along the sampling stretch of the Ratuwa river/Khola. The sampling site A was selected at the confluence spot of two rivulets; here another rivulet joins the RatuwaKhola and is near from the Larumba which is famous religious spot in that area. The rivulet bed consists of big boulders, cobbles, pebbles and a very little sand. The sampling site B (26◦44.695ꞌN and 087◦43.129ꞌE) was chosen near an open grass land and vicinity of Marchibung area where local people graze their cattle. The rivulet bed consists of cobble, pebble, gravel, mud and sand. The first sampling site C (26◦46.043ꞌN and 087◦43.198ꞌE) was selected at the Ratuwabridge which is the boarder of Ilam and Jhapa district. The rivulet bed consists of cobble, pebble and sand.
Methods
Study area
The present study area, Ratuwa River/Khola is a small rivulet, situated in Ilam district of Mansebung Rural Municipality. It lies in mid-hill region of Ilam district, far west from Ilam bazar. It is perennial and torrential River/rivulet which originates from the ChisopaniPanchami Bazar and surges through the boarder of Rakshe and Banjho, which finally flows onwards as Merchibung, Chakpeti, Beldagi and finally that enters the Jhapa district and finally discharges into the West Bengal of India. The water of Ratuwa river/rivulet is crystal clear except the rainy season.
Sampling
Sampling was conducted four times a year covering all seasons (Winter/January, Spring/April, Summer/June and Autumn/October) over two years (Y1=2017 and Y2=2018).
For the present study, the fishes were collected by using cast net, Bamboo fish trap, and mosquito nets. Cast net of 6 mm × 6 mm mesh size was used for the collection of fishes. Fish sampling was done at 7 am to 11am in every station. Before preservation, collected fishes were photographed with Nikon Digital Camera. After photography, the collected fishes were preserved in 37% formalin solution for 6 to 8 hours and later, the fishes were preserved in 10% formalin solution making their head upside for the protection of their caudal fin for further study and the specimens were taken to the laboratory of the Central Department of Zoology (CDZ) for identification. The identification was carried out with the help of standard taxonomic references[5, 6, 7, 8]and Shrestha.
The following environmental variables were analyzed during each field visit: water temperature, dissolved Oxygen (DO), pH, hardness, and water velocity. Water temperature (ºC) was measured with a digital thermometer by placing it in the water at a depth of 1feet. DO (mg/l) was measured by the Winkler titra-metric method. pH was measured by using a pH meter (HI 98107, HANNA Instrument). Total hardness (mg/l) was determined by using EDTA titrametric method. Water velocity was measured by the float method with the help of a stop watch and measuring tape.
Data analysis
Mean values of environmental variables, and standard deviation were calculated. Seasonal and site-wise Shannon-Weiner index, Simpson index (D), and Evenness index (J) were performed in R [9].Fish species were analyzed into different assemblage clusters based upon abundances of each fish species by utilizing _pvclust_package in R [10]. Samples by species, sites, months and environmental variables were analyzed through multivariate analysis tool. We then performed a detrended correspondence analysis (DCA; Hill &Gauch) to determine whether redundancy analysis (RDA) or canonical correspondence analysis (CCA) would be the most appropriate model to describe the association between species abundance, sites, months, years and environmental variables. The values of axis length and eigenvalues obtained from DCA suggest that the linear model associated with RDA was more applicable. Therefore, a direct multivariate ordination method [11](Ter Break and Prentice) based on a linear response of species to environmental gradients (Gauch, Ter Break and Palmer) was applied by using vegan library in “R” [9].
Results
Environmental variables of the study area
Environmental variables observed and recorded during the present study were summarized in table 1, 2 and 3. Mean value of environmental variables were summarized an accord of sampling sites. In site A, dissolved oxygen (DO) varied from 6.25 ± 0.35 mg/l (summer) to 10.25 ± 0.35 mg/l (winter), water temperature 9.5 ± 2.12ᵒC (winter) to 20.5 ± 2.12ᵒC (summer), free carbon-dioxide (CO2) 5.35 ± 0.49 mg/l (winter) to 7.4 ± 0.84 mg/l (summer), velocity 0.5 ± 0.141m/s (summer) to 0.74 ± 0.014 m/s (Autumn), total hardness 73.5 ± 4.94 mg/l (Autumn) to 97.5 ± 0.70 mg/l (summer) and pH 7.7 ± 0 (winter and autumn) to 8.4 ± 0.77 (summer). In site B, dissolved oxygen (DO) varied from 6 ± 0 mg/l (summer) to 10 ± 1.41 mg/l (winter), water temperature 7.5 ± 2.12ᵒC (winter) to 21.75ᵒC (summer), free carbon-dioxide 6.25 ± 1.06 mg/l (winter) to 8.4 ± 0.84 mg/l (Autumn), velocity 0.53 ± 0.06 m/s (summer) to 1.01 = 0.07 m/s (Autumn), Hardness 72.5 ± 6.36 (Autumn) to 113.5 ± 9.19 and pH 7.8 ± 0.14 (Autumn) to 8 ± 0 (summer). In site C, dissolved oxygen varied from 9 ± 1.41 mg/l (winter) to 6.4 ± 0.84 mg/l (summer), Water temperature 9 ± 2.12 ᵒC (winter) to 22.5 ± 2.12 ᵒC (summer), free carbon-dioxide 7.15 ± 0.21 mg/l (winter) to 8.5 ± 1.41 mg/l (summer), water velocity 0.6 ± 0.14 m/s (summer) to 0.81 ±0.09 m/s (autumn), total hardness of water ranged from 88.5 ± 9.19 mg/l (winter) to 116.5 ± 0.70 mg/l (summer) and pH 6.9 ± 0 (summer) to 8.05 ± 0.35 was found.
| Season | DO (mg/l) | Temp (℃) | CO2 | Velocity | Hardness | pH |
| Winter | 10.25±0.35 | 9.5±2.12 | 5.35±0.49 | 0.54±0.007 | 81±8.14 | 7.7±0.14 |
| Spring | 8.5±0.35 | 15.5±3.18 | 6.5±0.70 | 0.53±0.042 | 85±7.07 | 8±0 |
| Summer | 6.25±0.35 | 20.5±3.18 | 7.4±0.84 | 0.5±0.141 | 97.5±0.70 | 8.4±0.77 |
| Autumn | 8.45±0.63 | 15.9±0.14 | 6.65±1.62 | 0.74±0.014 | 73.5±4.94 | 7.7±0.14 |
Table 1: Mean value of environmental variables in site A of Ratuwa River.
| Season | DO (mg/l) | Temp (℃) | CO2 | Velocity | Hardness | pH |
| Winter | 10±1.41 | 7.5±2.12 | 6.25±1.06 | 0.87±0.31 | 79±1.49 | 7.9±0.14 |
| Spring | 7.65±0.21 | 16.15±3.18 | 7.45±0.77 | 0.85±0.35 | 91±12.72 | 7.9±0 |
| Summer | 6±0 | 21.75±3.18 | 7.85±0.21 | 0.53±0.06 | 113.5±9.19 | 8±0 |
| Autumn | 8.3±0.42 | 17.3±0.42 | 8.4±0.84 | 1.01±0.07 | 72.5±6.36 | 7.8±0.14 |
Table 2: Mean value of environmental variables in site B of Ratuwa River.
Species abundance and distribution
A total of 6,353 individuals were enumerated which comprises of 18 species of finfish’s belonging to three orders, six families and 12 genera (Table 4). Plenitude number was counted for Barilius barila (1877 individuals) and minimum for Mastacembelusarmatus (1 individual) which are 29.27% and 0.01% of total individuals respectively. Copious number 3,141 individuals were Species Code Total % siteA siteB siteC Win/Jan Spr/Apr Sum/jun Aut/Oct Puntiusterio punt_ter 135 2.12 0 58 77 46 33 25 31 p. sophore punt_sop 56 0.88 0 0 56 33 3 0 20 Puntiusconconius punt_con 77 1.21 0 77 0 14 0 0 63 Aspidopariamorar aspi_mor 62 0.97 0 0 62 50 12 0 0 Barilius barila bari_bar 1877 29.59 285 961 631 659 507 391 320 B. bendelisis beri_ben 1759 27.73 272 975 512 603 458 428 270 Brachydanio rerio brac_rer 633 9.97 0 296 337 237 152 170 74 Esomus danricus esom_dan 580 9.14 0 99 481 262 178 0 130 Garraannandalei garr_ana 230 3.62 0 230 0 110 67 3 50 Psylorhynchusbalitora psil_bal 18 3.43 0 218 0 68 8 0 72 Acanthocobotisbotia acan_bot 90 1.41 0 90 0 10 30 50 0 Schistura multifaciatus schi_mul 95 1.34 85 0 0 30 14 31 20 S. Scaturigina schi_sca 89 1.4 89 0 0 35 16 17 21 Lepidocephalusguntae lepi_gun 92 1.45 0 0 92 28 41 9 14 Mastacembelusarmatus mast_arm 1 0.01 0 0 1 1 0 0 0 Colisafaciatus coli_fac 50 0.78 0 0 50 14 20 16 0 Channapunctatus chan_pun 229 3.61 0 103 126 120 78 30 1 Channastriata chan_str 80 1.26 0 34 46 37 18 15 10 Total 6353 100 731 3141 2471 2357 1633 1185 1096 counted in site B throughout the study period where lowest number 731 individuals were found in site A. Seasonal abundance (individuals) variation was notable in all sampling sites. Maximum number individuals were recorded in January. The seasonal abundance for each sampling sites gradually increased autumn (October) to Winter (January) and sharply alleviate from Spring (April) to Summer (June).
- (Table 4: Win = Winter, Jan = January, Spri = Spring, Apr = April, Sum = Summer, Jun = Sune, Aut = Autumn, Oct =
- Octoberz).
Table 3: Temporal and spatial species abundance and distribution (2017/18).
Diversity status
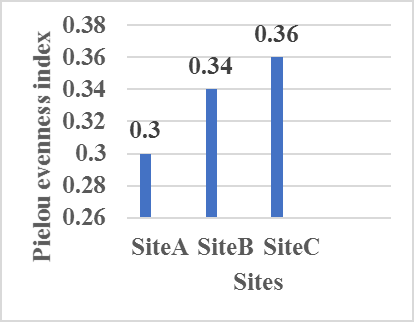
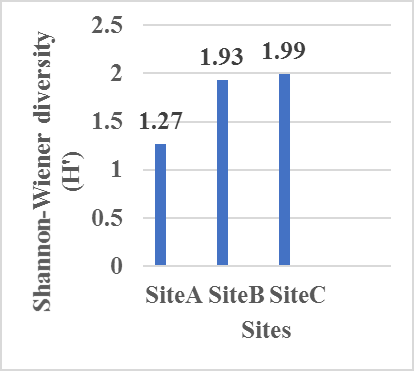
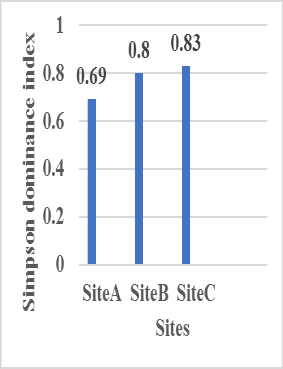
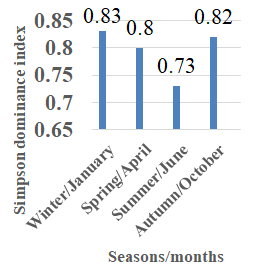
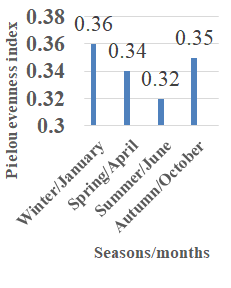
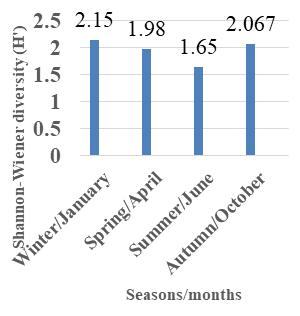
The value of Shannon Weiner diversity index (H'), Simpson index (D), and Pielou’s evenness index (J) were calculated according to seasons/months and sites. The highest Shannon diversity index (1.99) was found at site C and lowest (1.26) was found at site A. Highest Shannon diversity index values were found in January (Winter = 2.15) where low during June (Summer = 1.65). No
Fish Species, Sites, Years, Months and Environmental Variables Relationship
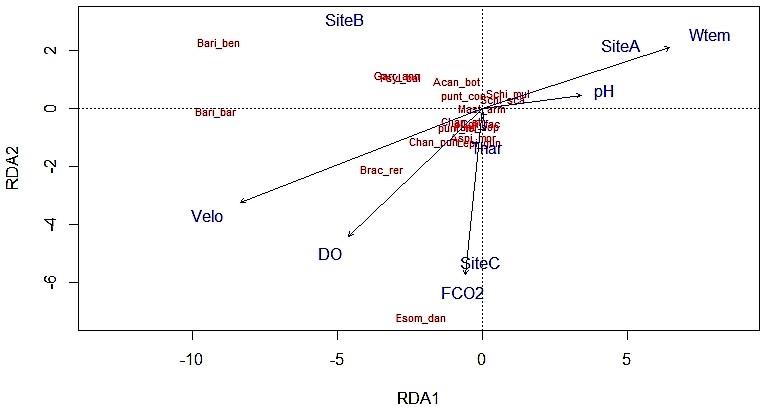
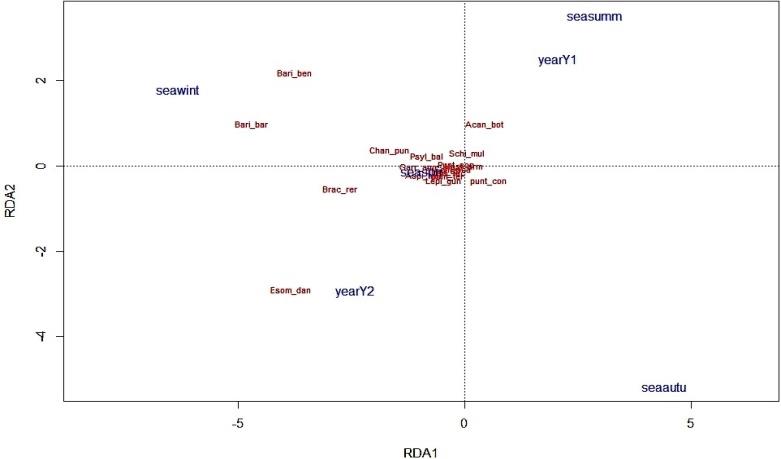
The result obtained from redundancy analysis (RDA) was plotted in Figure 4 and 5. Water velocity (velo), dissolved oxygen (DO) and free-carbon dioxide (FCO2) were found significantly correlated and strongly negative relation with water temperature (Wtem) and pH (Figure. 4). Occurrence of Esomus danricus_is higher at site C and shows positive correlation with free-carbondioxide, water velocity and dissolved oxygen. The higher occurrence of _Bariliusbendelisis_is higher in site B followed by _Garraannandeli, Acanthocobotisbotia and Puntiusconconius. The fish species of Schistura multifaciatus and S. Scaturigina shows the positive correlation with site A and environmental variables like pH and water temperature. The redundancy analysis (Figure 5) delineates that the season of Winter and Spring are two best seasons for the hill stream fishes.
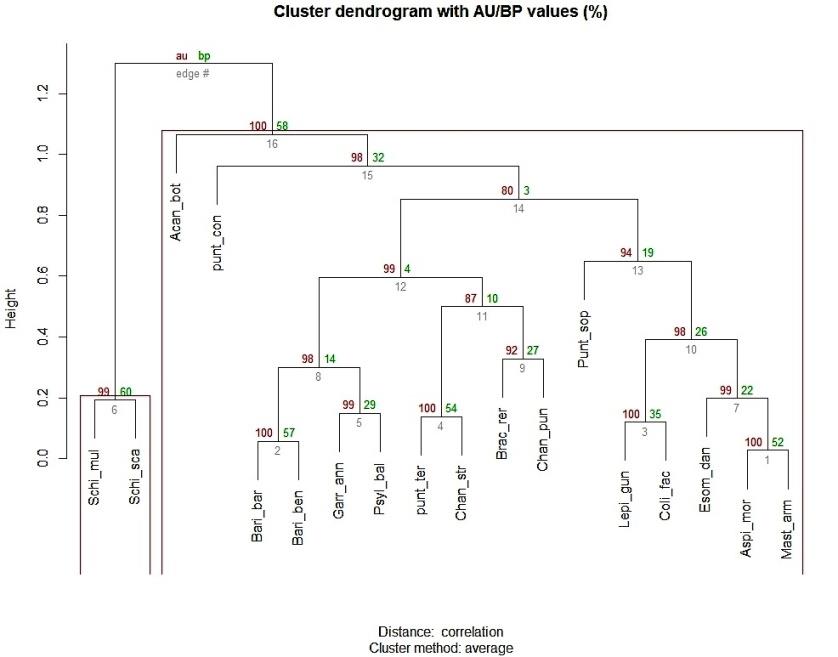
There are altogether sixteen cluster groups were formed. In the left side, the cluster number 1, 3, 7, 10 and 13 formed the significant cluster group. In first cluster number, Aspido pariamorar and Mastacem belusarmatus formed the significant cluster group with cluster number 7 with Esomus danricus. In the middle part, the cluster number 2 and 5 formed significant cluster group but number 9 and 11 do not formed significant cluster group. In contrary, cluster number 6 delineates that species of Schistura multifaciatus and S. Scaturigina formed a significant cluster. The species of Acantho cobotisbotia
Discussion
Dissolved oxygen concentration was found in this study ranges between 6.25 ± 0.35 mg/l (summer) to 10.25 ±0.35 mg/L (winter) and nearly same value is also reported by Shrestha J, et al. [12] from Tamor river. Though HossainMS, et al. reported the range of dissolved xygen 4.6 to 5.8 mg/L from Meghna River, which is inconsistent with the present study. High dissolved oxygen value at site A is due to elevation, low temperature and higher water current. Among four seasons, highest level of dissolved oxygen (10.25mg/l) was found in winter (January) and low in summer (June) which is consistent with the findings of Rashed, et al.[4]. pH value of the present study shows the similarity with Shrestha J, et al. [12] , Limbu, et al. [13] and Rashed, et al. Value of pH observed in the range 7.7 ± 0 (winter) to 8.4 ±0.77 (summer) indicate that water was slightly alkaline in nature. Maximum water temperature (20.5 ± 2.12 ᵒC, summer) was reported at site C and minimum (9.5 ± 2.12 ᵒC, winter) at site A due to seasonal variation and almost same value is also reported by Limbu JH, et al. [13] and Shrestha J, et al. [12], due to variation in altitude Sharma, et al.In contrast, the present value of water temperature is not consistent with the findings of Rashed, et al. Kamal MM [14] also reported seasonal variation of water temperature ranged between 7.54 and 10 ᵒC. Hardness of the present study was ranged in 73.5 ± 4.94 mg/L (Autumn) to 97.5 ± 0.70 mg/L (summer), which is contradict with the findings of Shrestha J, et al. [12], Thirumala and Limbu JH, et al. [13]. At higher elevation of site A, the value of hardness is low but at lower elevation site C, hardness of water is high. Water velocity of the present study is ranged between (0.5 ± 0.14 m/s (summer) to 0.74 ± 0.014 m/s (Autumn) and is consistent with results of Avendano CMM, et al. [15], Guo, et al. and Huang, et al. As compared to the seasonal variation of water velocity, Autumn (October) has higher velocity than other seasons. It is due to rainfall. Water velocity of the present study was found to be gradually decreases from the month of January to June. Here, the site A was selected higher elevation as compared to site B and Site C but water current was found to be higher in site B. This study shows that water velocity cannot fully depends upon the altitude. Water velocity mainly depends upon the structure, characteristic features and water volume of rivers, streams etc.
A total of 18 fin fish species were reported during the study period. Among them, Barilius barila and B. bendelisis were the most abundant species which comprise of 29.59 % and 27.73 % respectively. Limbu JH, et al. [16] reported about 151 species from Eastern Nepal. Limbu and Gupta [17] recorded 27 species from lower region of the same study area. The domineering species of the present study area and the results of Limbu and Gupta [17] from lower region of Ratuwa river were the same. Limbu JH, et al. [18], Limbu and Prasad [19], Limbu JH, et al. [13] and Limbu JH, et al. [16] identified 16, nine and eight species from Deumai Khola, Phewa Khola and Bakraha river. Shrestha J, et al. [12] have also recorded 30 fish species from Tamor river. Subba BR, et al. [20], Shrestha JN [21], Shah reported 118, 48 and 59 species from Morang district, Singhiya river, Triyuga river and Saptakoshi river of Eastern Nepal.In Nepal, 252 fish species have been reported including 15 orders, 35 families and 104 genera Shrestha TK [8]. Among 15 orders, Cypriniformes is the most dominating order with 135 species. On this account, mostly we can say that Nepal is a habitat for Order Cypriniformes. The present study also followed the same result of Shrestha TK [8]. Out of 18 species. Order Cypriniformes include 14 species with most pre-eminence order. The result of this study is also consistent with the findings of Shrestha J [12], Pokheral, Edds DR[22] and and Limbu JH, et al. [17]. Majority of the fish species collected from the River fall under the order Cypriniformes, this is the order of fresh water fiishes, which includes 2,422 species(Nelson).
Spatial distribution of fishes of Ratuwa river was found to be significantly difference. Puntius conconius, P. terio and P. sophore were not found from Site A throughout the study period. It might be due to unfavorable environmental condition. Puntius conconius was recorded from Site B and Site C where the highest number was found from Site C, P. sophore was reported from only site C. The speculative reasons might be favorable environmental condition. Aspidoporai morar was found only from Site C and comprised 0.97 % of total catch composition. Barilius barila and B. bendelisis were recorded from all three sampling sites. Highest number of individuals were found from Site B than site A and C and were the most common species of the present study. Brachydanio rerio was recorded from Site B and Site C only and is considered as a good mosquito larvae control fish. Puntius terio was recorded from site B only. Esomus danricus was found from Site B and Site C. These fishes were generally found from Canal of paddy fields, side of the rivers, puddles etc. Garra annandeli was found from Site B only. This fish was caught from slightly murky running water and riffles along with cobbles pebbles and gravels. Psyloeynchus balitora was also found from site B only and almost similar in habitat with Garra annadeli.Acanthocobotis botia was recorded from Site B. This fish was caught from small area of still water and runs. Schistura multifaciatus and S. Scaturigina were reported from site A only. These fishes are the hill stream fish with special modification of their ventral fins along with their mouth disk and barbel. These fishes generally prefer pools, puddles and runs. Lepidocephalus guntae was recorded from low elevation of site C only. The present author recorded this fish pH value of 5-11 from lower Terai region of Damak and Ratuwa river Limbu JH, et al. [16]. This loach is unique than others in adhesive modification structure. Other loaches have adhesive apparatus in their ventral parts but this loach has lateral side of their head for adhesion. This fish generally prefer sandy bottom but also recorded from Canals, small area of still water, ditches, drainages, and side of the rivers of low land. This fish was recorded from very polluted water like, where people discharges their sewages, throwing house wastes like bottles, plastic, glasses, vegetable peels etc. and with the sewage discharges of pigs in Canals, ditches and drainage. Mastacembelus armatus was reported from site C only. This fish was caught from puddle and pools. Colisa faciatus was found in site C only and has almost similar habitat with L. guntae. The present author had noticed this fish feeds larvae of mosquito during the field visit over two years. Channa punctatus and C. striatus were recorded from site B and site C. These fishes were caught from edge of the Ratuwa river, puddle, and paddy fields etc.
In term of temporal variation, most of the fishes were recorded from all four seasons. Puntius conconius was found all four seasons during the sample collection over two years of time period. Highest number of individuals were recorded in Winter (January) and least number of individuals were recorded in summer (June). Puntius sophore was not found in summer (June) but sample was found from three seasons. Highest number of individuals were recorded in winter and least from Spring season.
Aspidoporai morar was recorded in Winter and Spring only. No any individuals were found from Summer and October. Barilius barila and B. bendelisis were reported from all four seasons over two years of data collection and were the most common and dominating species of Ratuwa river. But from the same river of Lower part of this river Limbu and Gupta [16] recorded Guducia chapra was also a most common species. As compared to these two species, Barilius barila was found to be more domineering species than B. bendelisis. Brachydanio rerio was also recorded from all four seasons with the common status. Puntiu conconius was found in Winter and October but not reported from Spring and Summer. Esomus danricus was reported in Octber, Winter and Spring but not reported from Summer. Garra annandalei, Schistura multifaciatus, S. Scaturigina, Lepidocephalus guntae, Channa punctatus and C. striatus were also found in all four seasons with the common status. In contrast, Mastacembelus armatus was reported in Winter (January, 2018) only with the rare status. Psylorynchus balitora was reported from three seasons except Summer with the fairly common status. Acanthocobotis botia_has highest number of individuals in Summer (June) while least individuals were found in Winter and no any individuals were found in Autumn (October). _Colisa faciatus was recorded from Winter, Spring and Summer but not from Autumn.
In terms of spatial and temporal variation of fish assemblage structure of Ratuwa river, highest number of individuals were observed at site B and in term of temporal variation, highest number of individuals were observed in Winter (January). Site B was selected the vicinity of Merchibung village to know the impact on fish species through human interference. Increased fishing pressure is the main triggering factors for diversity loss Hossain, et al. but in the present study area there was not found any fishing pressure activities. On the other hand, lowest number of individuals were observed at site A and this is due to unfavorable environmental condition of the present fish species. In terms of spatial and temporal variation of this study differs with the findings of Hossain, et al. and Limbu JH, et al. [18]. According to Hossain, et al. abundance of fishes is high in February to April but present study has reported highest number of fishes can be found in Winter (January) and gradually sapped up to Summer (June) and again it starts to turgid the number of individuals from Autumn (October).
A biodiversity index seeks to characterize the diversity of sample or community by a single number Magurran. The concept of the species diversity involves two components: the number of species or richness and the distribution of individuals among species. However, the formal treatment of the concept and its measurement is complex Williamson. The biodiversity index values (H') obtained from present study is not so very high according to Shannon-Weiner biodiversity index values and they do not exactly show the differences occurring among the Sites either. According to Keskin and Unsal[23] the reason for showing lower species biodiversity is that fishing gears used have high selectivity effect. Highest Shannon- Weiner diversity index was found in site C and winter (January) where lowest was observed at site A and during summer (June). In each case high Shannon diversity index is involved with low individuals and low diversity involved with high number of individuals. The main causes of the differences occurring in the biodiversity indexes are seasonal variations of nutrients at the sea grass beds affecting the coexistence of many fish species [24], atmospheric air currents and environmental conditions Keskin and Unsal[23], and seasonal fish migrations Ryer and Orth[25]. Simpson dominance diversity index value was highest in site C and lowest value observed in site 1. Highest seasonally/Monthly dominance diversity index value was in Winter (January) and lowest value in during Summer (June). The maximum evenness value was observed at site C and minimum was recorded at site A. In case of seasons/months, highest evenness value was found in site C and minimum was at site A. In Shannon (H'), Evenness (e), and Dominance (D) diversity there was no significant difference observed. Therefore, it may be concluded that the seasonal difference in species diversity is a common phenomenon in the studied area [26, 27, 28, 29, 30, 31, 32, 33, 34, 35, 36, 37, 38, 39, 40].
Acknowledgement
We are very thankful to Mr. Samir Rai for fish collection during the whole study period. Our special thanks go to Dr. David R. Edds for checking the initial manuscript, and providing input to improve the paper, Department of Biological Science, Emporia State University, USA. We are also thankful to SumanRai, ChhaviLimbu, RazinaShermaLimbu, Kumar Biswakarma, Nar BahadhurYonghang, Birat Raj Rajak, HimalYonjon, AindraIdingo, Hasta BahadhurLimbu and KangarotiLimbu for their valuable suggestions. We would like to thank Central Department of Zoology for laboratory facility.
References
-
Adams SB, Warren ML, Haag WR (2004) Spatial and temporal patterns in fish assemblages of upper coastal plain streams, Mississipi, USA. Hyhdrobiologia 528: 45-61.
-
Grossman GD, Ratajczak RE, Crawford M, Freeman MC (1998) Assemblage organization in stream fishes: effects of environmental variation and interspecific interactions. EcolMonog 68(3): 395-420.
-
Gowan CM, Young K, Faush KD, Riley SC (1994) Restricted movement in resident stream salmonids: a paradigm lost‘?. Canadian J Fisher Aqua Sci 51(11): 2626-2637.
-
Mishra AR, Baniya CB (2016) Ichthyofaunal Diversity and Physico-chemical Factors of Melamchi River, Sind-upalchok, Nepal. J InstituSciTechnol 21(1): 10- 18.
-
Talwar PK, Jhingram AG (1991) Inland fishes of India andAdjacent countries. Oxford an IBH Publishing Co. India, (1,2): 1158.
-
Jayaram KC (2010)The freshwater fishes of Indian region. Narendra Publishing House, Delhi, India, pp: 624.
-
Shrestha TK (2008) Ichthyology of Nepal. A study of fishes of the Himalayan waters. Himalayan Ecosphere. Kathmandu, Nepal, pp: 1-188.
-
Shrestha TK (2019) Ichthyology of Nepal. A study of fishes of the Himalayan waters. Himalayan Ecosphere. Kathmndu, Nepal, pp: 1-200.
-
Oksanen J, Blanchet FG, Kindt R, Legendre P, Minchin PR, et al. (2019) Vegan: Community ecology package. R package version 2: 3-1.
-
Suzuki R, Shimodaira H (2019) Pvclust: Hierarchical Clustering with P-Values via Multiscale Bootstrap Resampling. R package version 2.0-0.
-
Ter Break CJF (1988a) CANOCO: A FORTRAN Program for canonical community ordination by (partial) (detr-nded) (Canonical) correspondence analysis, principle component analysis and redundancy analysis
-
(Version 2.1), Washington: Agricultural Mathematics Group.
-
Shrestha J, Singh DM, Saund TB (2009) Fish diversity of Tamor River and its major Tributaries of eastern Himalayan region of Nepal. Nepal J SciTechnol 10: 219-223.
-
Limbu JH, Prasad A, Shrestha Om H (2018) Ichthyofaunal diversity of Bakraha River of Morang District, Nepal. Int J Fish Aqua Stud 6(5): 267-271.
-
Kamal MM (1992) Studies on the intertidal Green mussel pernaviridis L. inhibiting Moheshkhali Channel, Bay og Bengal. University of Chittagong, Bangaladesh.
-
Marin Arvendano CM, Aguirre Ramirez NJ (2017) Spatial and temporal variation of fish assemblage associated with aquatic macrophyte patches in the littoral zone of the Ayapel Swamp Complex, Colombia. Acta Lim nologicaBrasiliensia 29: e3.
-
Limbu JH, Chapagain N, Gupta KS, Sunuwar S (2019)Review on fish diversity of eastern Nepal. Int J Fish Aqua Stud 7(3): 177-181.
-
Limbu JH, Gupta S (2019) Fish diversity of Damak and lower Terai region of Ratuwa River of Jhapa district, Nepal. Int J Fauna Bio Stud 6(1): 1-4.
-
Limbu JH, Acharya GS, Shrestha Om H (2016)Ichthyofaunal diversity DewmaiKhola of Ilam district. Thesis (Bachelor’s degree), TU, Kathmandu, Nepal.
-
Prasad A, Limbu JH (2017)Ichthyofaunal diversity of PhewaKhola of Ilam district, Nepal. Recent Life Sc. Mirror. Int Biannual J Life Sci 6(1-2): 1-8.
-
Subba BR, Pokharel N, Pandey MR (2017) Ichthyofaunal diversity of Morang district, Nepal. Our Nature 15(1,2): 55-67.
-
Shrestha JN (2016) Fish diversity of Triyuga River, Udayapur District. Our Nature 14(1): 124-134.
-
Edds DR (1986) Fishes of KlaiGnagaki/Narayani Rivers, Nepal. J Natural History Museum, Tribhuvan University, Kathmandu 10(14): 14-22.
-
Keskin C, Unsal N (1998) The Fish Fauna of Gokceada Island, NE Aegean Sea. Turkey. Italian Journal of Zoology 65: 299-302.
-
Huh SH, Kitting CL (1985)Trophic relationships among concentrated populations of small fishes in seagrass meadows. J Experiment Marine BiolEcol 92(1): 29-43.
-
Ryer CH, Orth RJ (1987) Feeding ecology of the Northern pipefish, Syngnathusfuscus, in a Seagrass community of the lower Chesapeake bay. Estuaries 10(4): 330-336.
-
Abramovitz J (1996) Imperiled Waters, Impoverished Future: The Decline of Freshwater Ecosystems. Worldwatch Paper No. 128. World watch Institute, Washington, DC.
-
Sala OE, Chapin FS, Armesto JJ, Berlow E, Bloomfield J, et al. (2000) Global biodiversity scenarios for the Year 2100. Sci 287(5459): 1770-1774.
-
Johnson N, Revenga C, Echeverria J (2001) Managing water for people and nature. Sci 292(5519): 1071- 1072.
-
Kottelat M, Whitten T (1996) Freshwater biodiversity in Asia: with special reference to fish. World Bank Technical Paper 343: 1-59.
-
Shannon CE, Wiener W (1949) The mathematical theory of communication. Urbana, Uiversity of Illinois Press, pp: 177.
-
Pielou EC (1966)The measurement of diversity in different types of biological collections. J TheoretBiol 13: 131-144.
-
Margalef R (1958)Temporal succession and spatial heterogeneity in phytoplankton. In: Buzzati-Traverso (Eds.), Perspectives in Marine biology, UnivCalif Press, Berkly, pp: 323-347.
-
Pokharel KK (1999) Fish Biodiversity of Lakes in Pokhara Valley and need of their Conservation. In Proceeding of IIIrd National Conference on Science and Technology.
-
Yadav SN (2017) Studies on fish diversity and need for their conservation of Singhiya River, Morang district, Eastern Nepal. Agricul Forest Fish 6(3): 78- 81.
-
Pinky S (2016) Study of the fresh water fish diversity of Koshi River of Nepal. Int J Fauna Biol Stud 3(4): 78- 81.
-
Hossain MS, Das NG, Sarker S, Rahaman MZ (2012) Fish diversity and habitat relationship with Environmental vriables at Meghna river estuary, Bangladesh. Egyptian J Aquat Res 38(3): 213-226.
-
Magurran AE (2004) Measuring Biological Diversity. Blackwell Publishing, Oxford, pp: 256.
-
Johnson N, Revenga C, Echeverria J (2001) Managing water for people and nature. Science 292(5519): 1071-1072.
-
Sharma CM (2008) Freshwater fishes, fisheries, and habitat prospects of Nepal. Aquatic Ecosystem Health Manag 11(3): 289-297.
-
R Core Team (2018) R: A language and environment for statistical computing. R Foundation for Statistical Computing, Vienna, Austria.
- Lessons to Learn: Trees are More than the Lungs of the World
- Community Forestry Enterprises as a Model for Sustainable Forest Development: The Case Of The "Baja Tarahumara" in Chihuahua, Mexico
- Ecological and Socio-Economic Impacts of Chromolaena odorata and Mesosphaerum suaveolens, Two Invasive Alien Species in Central and Southern Benin, West Africa
- Epigenetic Sustainability: Modeling the Human Factor as a Natural Resource through Science 4.0 and the NR3C1 Biological Pilot
- Growth-at-Risk: A Framework for Assessing Economic Vulnerability
- The Rural Territory as a Socioecological System for the Management of Public Policy for Sustainable Rural Development