Monitoring of Nutritional Status in Sediments, Water and Plant Leaves from Ratargul Swamp Forest at Sylhet in Bangladesh
Nutrient concentration is an important parameter to recognize critical processes of an ecosystem and it also controls the rates of ecosystem processes and primary productivity in both aquatic and terrestrial ecosystems. The study investigated the nutritional status in sediments, water and plant leaves from Ratargul swamp forest during the period from September 2016 to August 2017. The samples were collected from twelve sampling stations in four different canals of the swamp forest during dry (September 2016 to April 2017) and wet (May to August, 2017) seasons, respectively. The nutrient contents such as total nitrogen (TN), total phosphorus (TP) and total organic carbon (TOC) in sediments, water and leaves (green and brown) of both Koroch (Pongamia pinnata) and Hijal (Barrigtonia acutangula) plants were analysed in the laboratory of the Bangladesh Institute of Nuclear Agriculture (BINA), Mymensingh, Bangladesh. The TN, TP and TOC in sediments were ranged from 2.22 to 5.23, 0.032 to 0.035 and 2.6 to 4.52%, respectively, whereas TN and TP in water were found 5.34 to 22.54% and 0.002 to 0.366%, respectively. Result showed that the TOC in plant leaves was higher in wet season than in dry season, where the TN and TP were higher in dry season than in wet season due to high temperature which increases the rate of photosynthetic activities in the dry season. In both Koroch and Hijal plants, the TOC and TP were higher in green leaves than brown while TN was higher in brown leaves than green ones. It may be due to the presence of chlorophyll in the green leaves and carotenoids in the brown leaves. Moreover, a statistically significant positive correlation was found among the samples. The study concluded that the nutritional status in sediments, water and leaves were perfectly natural during both the dry and wet season which is suitable for aquatic environment.
Introduction
Fresh water swamps are the unique ecosystems having very specific vegetation. Water is the prime requisite of the vegetation of the swamp forests [1]. These forests are sites of natural succession and therefore contain all the groups of plant kingdom in a single place [2]. Ratargul swamp forest is the only one fresh water swamp ecosystem in Bangladesh. Swamps play a vital role in landscaping with a wide variety of flora and fauna [3]. Due to variation in topography, a distinct floristic diversity is seen which is quite varied from the surrounding area [4]. They support characteristic vegetation on account of specialized edaphic conditions, as influenced by free water accumulation [5]. They form integral part of the wetland ecosystems, serving as habitats, nursery grounds and sources of food for many organisms [6]. Forest swamp has important hydrological supportive functions including providing water storage space, adjusting and saving the flood peak, keeping the underground water level, recharging runoff, taking the degradation of pollution and purifying water quality etc [7]. An ecosystem consists of plants, animals and microorganisms, which live in a definite zone along with the physical factors such as sediments; water and air, within an ecosystem, there are dynamic interrelationships between the living form and their physical environment [8]. This relationship is manifested as the natural nutrient cycles which provide a continuous circulation of the essential constituents necessary for sustains the life processes on an ecosystem [9].
The swamp water has low pH, nutrient levels and very low levels of anions and cations in the surface water, even lower than in the ground water, whereas nutrient limited sediments retards plant growth. Therefore, plants growing on peat sediments must develop some specific mechanisms, such as organic acid exudation from roots, to accumulate nutrients [10]. In general, plant species that grow and dominate in an ecosystem are affected by various environmental parameters, so differences in plant physiology, e.g. seed germination, relative growth rate, and competition with other plant species, can also express the changes in the environmental development of an ecosystem [11]. Nutrient concentration is used as an important parameter to recognize critical processes of an ecosystem. Nitrogen (N) and phosphorus (P) both are shown to control the rates of ecosystem processes and primary productivity in both aquatic and terrestrial ecosystems [12]. Global pattern analysis of C, N and P stoichiometry in foliage and litter supports the hypothesis that N is the major limiting nutrient in temperate regions, while P tends to limit ecosystem productivity and processes in the tropical regions [13]. The objectives of the study was to investigate the concentration of total nitrogen (TN), total phosphorus (TP) and total organic carbon (TOC) in sediments, water and plant leaves of the forest and their inter relationship.
Materials and Methods
Study Area
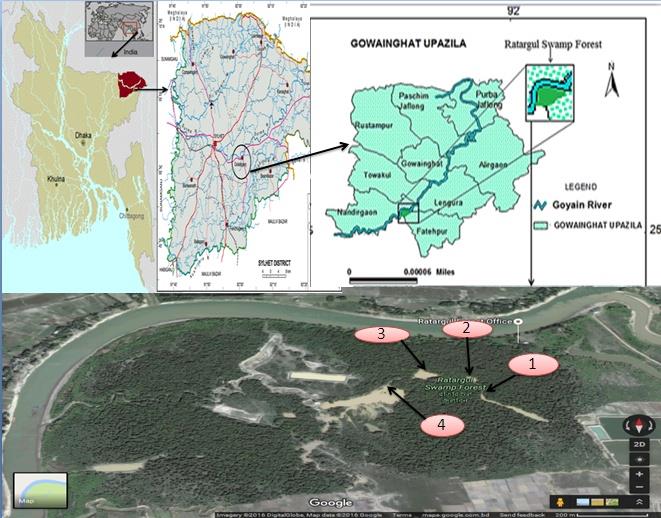
Ratargul swamp forest is located under the Gowainghat upazila of Sylhet district, which is far about 45Km on the northwest of Sylhet town (Figure 1). The forest is situated on the bank of the river Gowain which has originated from the hilly areas of Meghalaya in India and falls into the Surma river [14]. The total area of the swamp forest is 3325.61 acre [15].
Sampling Stations
The study was conducted for a period of 12 months from September 2016 to August 2017 at the Ratargul swamp forest. In this period, sediments, water and plant leaves were collected from four sampling stations (St). The St-1 (Athalur Khal) was situated behind the forest office where the forest composes of some bushes of Mukta (Clinogyne dichotoma, height 1.5 to 2m) as under story vegetation, Koroch (Pongamia pinnata, height 12 to 13m) and Hijal (Barringtonia acutangula, height 8 to 9m) as over story vegetation. The St-2 (Chirikurir Khal) was situated in the northwest of the St-1, where Koroch was the predominant tree species. The St-3 (Horokuri Khal) was situated on northward in relation to the St-2 and also crosses a dense stand of Mukta. The St-4 (Mendikuri Khal) was situated on southward in relation to the St-3, where Koroch (12 to 14 m in height) was the predominant tree species as like as St-2.
Sample Collection
A total of twelve sediment samples were collected from four sampling station in the forest. Samples were collected from surface (0 to 15cm depth) at a distance of 0, 10 and 20m near the water body in the dry season. The water samples were collected and measured seasonally over the year and on each sampling date; three water samples were collected from each station. The Koroch (Pongamia pinnata) and Hijal (Barringtonia acutangula) are the dominant species of the forest. The green and brown leaves of Koroch and Hijal were used as sample for the study, collected seasonally over the year from each station.
Sample analysis
Collected sediments, water and plant leaves samples were analysed in the laboratory of the Bangladesh Institute of Nuclear Agriculture (BINA), Mymensingh, Bangladesh. The total organic carbon (TOC) of the samples was determined by Walkley and Black’s wet oxidation method which outlined by Jackson [16]. In this method, wet oxidation of organic carbon was done with potassium dichromate and concentrated sulphuric acid, then titrated with ferrous sulphate using diphenylamine indicator. The organic matter content was calculated by multiplying the content of organic carbon by Van Bemmelen’s factor 1.73 [17].
The total nitrogen (TN) was determined by Semi- micro Kjeldahl method by digesting sediments sample with concentrated H2SO4 and catalyst mixture (K2SO4:
CuSO4.5H2O: Se=10:1:0.1). Nitrogen in the digest was estimated by distillation with 40% NaOH followed by titration of the distillate trapped in boric acid with 0.01 N H2SO4 [18]. The % of N in sediments was calculated by the following equation:
$$ \frac {(\mathrm {R} - \mathrm {B}) \times \mathrm {S} \times 1 . 4}{\mathrm {W}} $$ % N = Where, R=Reading of the sample in burette (H2SO4), S=Strength of H2SO4, B=Content of blank reading, W=Weight of the sediments, and 1.4=Correction factor.
Available phosphorus (TP) was determined by Olsen’s method using SnCl2 as reducing agent. Five grams of sediments were taken in a 250ml conical flask. Then a little of carbon black and 100ml 0.5M NaHCO3 were added to it. The contents were then shaken for 30 minutes on a horizontal mechanical shaker and were filtered through Whatman no. 40 filter paper. Later on 5ml of extract was taken into a 50ml volumetric flask followed by 4ml. A few drops of SnCl2 solution were also added and finally the volume was made up to the mark with distilled water and allowed to stand for 10 minutes to complete color development. The TP in the extract was then determined by developing a blue color by SnCl2 reducing of phosphomolybdate complex and measuring the color calorimetrically at 660nm wavelength comparing the color developed with a standard phosphate solution [19].
Results and Discussion
Sediments Nutrient
Total organic carbon (TOC): The total organic carbon was ranged from 2.6 to 4.52% in the surface sediments of Ratargul swamp forest, whereas, the mean TOC content was 3.593%. The highest TOC (4.52%) content was found at St-1 while the lowest TOC content (2.6%) was observed in the surface sediments at St-2 (Figure 2).
The average TOC content in the surface sediments were 4.297, 2.867, 3.404 and 3.803% at St-1, St-2, St-3 and St-4, respectively. There was found high amount of TOC content which might be due to the forested depressions. A similar study was conducted for TOC contents (5.2%) in sediments of wetland at Georgia, USA and the forested depressions was significantly higher organic carbon (C) contents than the other wetland [20].
0.0 1.0 2.0 3.0 4.0 5.0
TOC (%)
St-1 St-2 St-3 St-4
Sampling station
High amount of nitrogen (N) in the sediments of Sundarbans mangrove forest was also found by previous study [21]. The deposition and decomposition of huge quantities of solid wastes from the forest and surrounding area, and the use of N as a fertilizer in the agricultural land are responsible for the enrichment of TN content in the sediments. Study concluded that nitrogen content in the sediments of the forest was suitable for growth of pant and microorganism in the forest.
0.000 0.100 0.200 0.300 0.400 0.500 0.600
TN (%)
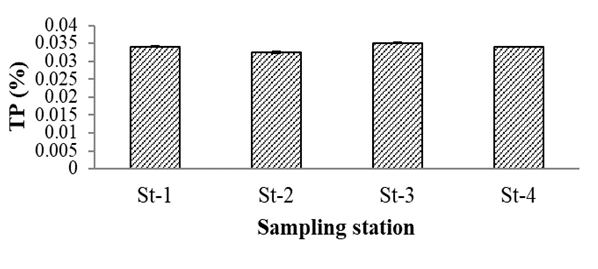
Figure 3: Status of TN in sediments at different sampling stations at Ratargul swamp forest. Total phosphorus (TP): Total phosphorus content was ranged from 0.032 to 0.035%, where mean contents were 0.034%. The highest and lowest TP contents were found 0.035 and 0.032% at St-3 and St-2, respectively (Figure 4). The average TP contents were 0.034, 0.032, 0.351 and 0.034% at St-1, St-2, St-3 and St-4, respectively. Study stated that phosphorus (P) contents were suitable for growth of pant and microorganism in the forest. The TP content in the surface sediments of wetland was 0.034% which was significantly higher than other wetland [20]. Another study in Sundarbans mangrove forest revealed that high amount of phosphorous (P) in sediments [21], due to deposition and decomposition of huge quantities of solid wastes in the forest and surrounding area, and the use of P as fertilizer in the agricultural land may be responsible for the enrichment of TP in sediments.
St-1 St-2 St-3 St-4
Sampling station
Water nutrient
Total nitrogen (TN): There was a significant variation in total nitrogen content in dry and wet season (P>0.004, df=3). Total nitrogen (TN) contents were ranged from 5.34 to 22.54 % with a mean of 12.385%. The highest TN content was found 22.54% at St-3 during the wet season, where the lowest content 5.34% was found at St-2 during the dry season (Figure 5). The average TN content along the Ratargul swamp forest were 7.123, 6.057, 7.267 and $$ \mathrm {d} = \mathrm {d} _ {1} + \mathrm {d} _ {2} + \mathrm {d} _ {3} + \dots + \mathrm {d} _ {n} $$ $$ = 1 0 0 0 0 0 0 0 0 0 0 0 0 0 0 0 0 0 0 0 0 0 0 0 0 0 0 0 0 0 0 0 0 0 0 0 0 0 0 0 0 0 0 0 0 0 0 0 0 0 0 0 $$ Dry season
25
20
TN (%)
Sampling station
Figure 5: The TN of water in Ratargul swamp forest at different sampling season. Total phosphorus (TP): The total phosphorus (TP) contents were ranged from 0.002 to 0.366% with a mean of 0.166%, where significant variation of total phosphorus in dry and wet season (P>0.018, df=3) was found. The highest TP content 0.366% was found at St-3 during the wet season and the lowest was 0.002% at St-2 during dry season (Figure 6). The average TP content along the Ratargul swamp forest was 0.027, 0.028, 0.068 and
6.42% at St-1, St-2, St-3 and St-4, respectively in dry season, whereas, during the wet season the TN contents were 15.52, 15.37, 21.523 and 19.133% at St-1, St-2, St-3 and St-4, respectively. A study found that higher amount of N content in the wet season than the dry season due to use of excessive nitrogen in the surrounding agricultural land and mixed with the water through the run off during the wet season [21].
$$ = 1 0 0 0 0 0 0 0 0 0 0 0 0 0 0 0 0 0 0 0 0 0 0 0 0 0 0 0 0 0 0 0 0 0 0 0 0 0 0 0 0 0 0 0 0 0 0 0 0 0 0 0 $$ Wet season
0.047% at St-1, St-2, St-3 and St-4, respectively in dry season. However, during the wet season, the TP contents were 15.52, 21.523, 15.37 and 19.133% at St-1, St-2, St-3 and St-4, respectively. The study found that the amount of TN and TP were higher in the wet season than the dry season due to use of excessive nitrogen fertilizer in the surrounding agricultural land which in turn mixed with the water through the run off during the wet season.
Plant leaf nutrient
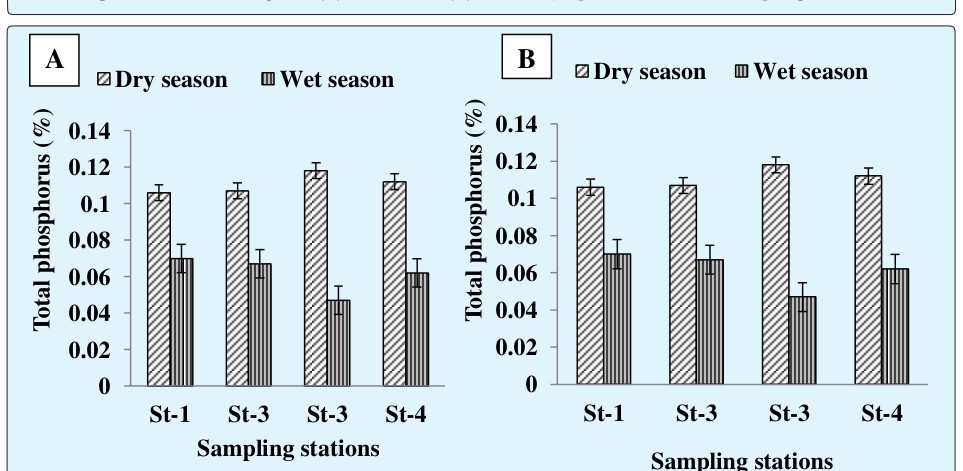
Total organic carbon (TOC): The significant (p>0.003) variation of TOC in dry and wet season and in green and brown leaves (p>0.03) of Hijal were found. Higher amount of TOC content (48.887%) was found in green leaves at St-3 during wet season, while the lowest (36.57%) was found in brown leaves at St-4 during dry season (Figure 7). The contents of TOC in green leaves of Hijal were 43.057 (St-1), 39.413 (St-2), 40.52 (St-3) and 43.11% (St-4) during dry season and 45.587 (St-1), 43.760 (St-2), 48.887 (St-3) and 42.727% (St-4) during wet season. In the brown leaves of Hijal, the contents of TOC were 41.13 (St-1), 38.523 (St-2), 36.903 (St-3) and 36.7% (St-4) during dry season while 44.7 (St-1), 39.9 (St-2), 39.623 (St-3) and 39.897% (St-4) during wet season. In Koroch leaves, there was no significant (p>0.171) variation of TOC in dry and wet season but significant variation with p>0.04 was found in green and brown leaves. The highest contents of TOC was 53.977% at St-4 in green leaves during wet season and the lowest amount was 42.233% at St-3 in brown leaves during the season (Figure 8).
The TOC contents 46.223 (St-1), 44.493 (St-2), 43.247 (St-3) and 45.167% (St-4) were found in green leaves during dry season while the 52.1, 53.643, 52.07 and 53.977% were found in wet season at St-1, St-2, St-3 and St-4, respectively. In the brown leaves of Koroch 44.24, 43.993, 42.233 and 43.057% of TOC were found during dry season and the 50.1, 52.65, 50.05 and 53.133% were found during wet season at St-1, St-2, St-3 and St-4, respectively. The study found that average TOC in leaves was higher in the wet season than dry season which might be due to the higher temperature in wet season that increase the rate of photosynthetic activity. In both Koroch and Hijal, the TOC contents were higher in the green leaves than the brown; this might be due to the presence of Chlorophyll in the green leaves. Similar study found that TOC contents depend on temperature and it increased when the temperature is increased [13].
![Figure 3: Status of TN in sediments at different sampling stations at Ratargul swamp forest. Total phosphorus (TP): Total phosphorus content was ranged from 0.032 to 0.035%, where mean contents were 0.034%. The highest and lowest TP contents were found 0.035 and 0.032% at St-3 and St-2, respectively (Figure 4). The average TP contents were 0.034, 0.032, 0.351 and 0.034% at St-1, St-2, St-3 and St-4, respectively. Study stated that phosphorus (P) contents were suitable for growth of pant and microorganism in the forest. The TP content in the surface sediments of wetland was 0.034% which was significantly higher than other wetland [20]. Another study in Sundarbans mangrove forest revealed that high amount of phosphorous (P) in sediments [21], due to deposition and decomposition of huge quantities of solid wastes in the forest and surrounding area, and the use of P as fertilizer in the agricultural land may be responsible for the enrichment of TP in sediments.](/fulltextimages/4670/fig_3.jpeg)
in brown leaves during dry season and lowest was 1.6% at St-1 in green leaves during wet season (Figure 10). TN contents were 2.73 (St-1), 2.77 (St-2), 4.45 (St-3) and 2.69% (St-4) in green leaves during dry season and 1.6 (St-1), 1.79 (St-2), 1.86 (St-3) and 1.79% (St-4) were found in wet season. In brown leaves of Koroch TN were 5.04, 3.93, 4.88 and 3.88% during dry season and 2.01, 2.07, 2.03 and 2.08% were found during wet season at St- 1, St-2, St-3 and St-4, respectively. The TN contents in the plant leaves were higher in dry season than wet season which might be due to the high temperature in wet season and temperature directly influences the physiological processes. In both Koroch and Hijal leaves, TN were higher in brown leaves than green; it may be due to the presence of carotenoids in the brown leaves. The TN depends on the temperature and increased with the rising of temperature [13].
$$ \mathrm {d} = \mathrm {d} _ {1} + \mathrm {d} _ {2} + \mathrm {d} _ {3} + \dots + \mathrm {d} _ {n} $$
Dry season
A B
$$ \mathrm {d} = \mathrm {d} _ {1} + \mathrm {d} _ {2} + \mathrm {d} _ {3} + \dots + \mathrm {d} _ {n} $$ $$ = 1 0 0 0 0 0 0 0 0 0 0 0 0 0 0 0 0 0 0 0 0 0 0 0 0 0 0 0 0 0 0 0 0 0 0 0 0 0 0 0 0 0 0 0 0 0 0 0 0 0 0 0 $$
4 4.5
Total nitrogen (%)
St-1 St-2 St-3 St-4
Sampling stations
$$ \mathrm {d} = \mathrm {d} _ {1} + \mathrm {d} _ {2} + \mathrm {d} _ {3} + \dots + \mathrm {d} _ {n} $$ $$ \mathrm {d} = \mathrm {d} _ {1} + \mathrm {d} _ {2} + \mathrm {d} _ {3} + \dots + \mathrm {d} _ {n} $$ $$ = 1 0 0 0 0 0 0 0 0 0 0 0 0 0 0 0 0 0 0 0 0 0 0 0 0 0 0 0 0 0 0 0 0 0 0 0 0 0 0 0 0 0 0 0 0 0 0 0 0 0 0 0 $$ $$ = 1 0 0 0 0 0 0 0 0 0 0 0 0 0 0 0 0 0 0 0 0 0 0 0 0 0 0 0 0 0 0 0 0 0 0 0 0 0 0 0 0 0 0 0 0 0 0 0 0 0 0 0 $$
Dry season
St-1 St-2 St-3 St-4
Sampling stations
5
4 4.5
Total nitrogen (%)
St-1 St-2 St-3 St-4
St-1 St-2 St-3 St-4
Sampling statoins
0.102, 0.11, 0.126 and 0.122% during dry season and 0.031, 0.036, 0.03 and 0.053% during wet season at St-1, St-2, St-3 and St-4, respectively (Figure 11). TP contents were 0.093, 0.086, 0.98 and 0.098% in brown leaves of Hijal during dry season at St-1, St-2, St-3 and St-4, respectively. During wet season TP contents in brown leaves were 0.029 at St-1, 0.039 at St-2, 0.025 at St-3 and
0.041% at St-4. In the Koroch plant leaves, there was statistically significant (p> 0.001) variation of TP in dry and wet season, however a significant variation (p>0.002) was found in green and brown leaves. The highest content of TP was 0.118% (brown leaves) in St-3 during the dry season and lowest was 0.04% (green leaves) in St-3 during the wet season. The TP contents were 0.112 (St-1), 0.107 (St-2), 0.012 (St-3) and 0.106% (St-4) in green leaves during dry season while TP were 0.62 (St-1), 0.067 $$ \mathrm {d} = \mathrm {d} _ {1} + \mathrm {d} _ {2} + \mathrm {d} _ {3} + \dots + \mathrm {d} _ {n} $$ $$ = 1 0 0 0 0 0 0 0 0 0 0 0 0 0 0 0 0 0 0 0 0 0 0 0 0 0 0 0 0 0 0 0 0 0 0 0 0 0 0 0 0 0 0 0 0 0 0 0 0 0 0 0 $$ (St-2), 0.047 (St-3) and 0.78% (St-4) in wet season (Figure 12). In brown leaves of Koroch plant TP contents were 0.104, 0.092, 0.109 and 0.096% during dry season, and 0.041, 0.043, 0.04 and 0.054% during wet season at St-1, St-2, St-3, and St-4, respectively. The TP contents in plant leaves were higher in dry season than wet season might be due to the high temperature in wet season, though the TP was higher in brown leaves than green.
$$ \mathrm {d} = \mathrm {d} _ {1} + \mathrm {d} _ {2} + \mathrm {d} _ {3} + \dots + \mathrm {d} _ {n} $$ $$ \mathrm {d} = \mathrm {d} _ {1} + \mathrm {d} _ {2} + \mathrm {d} _ {3} + \dots + \mathrm {d} _ {n} $$ $$ = 1 0 0 0 0 0 0 0 0 0 0 0 0 0 0 0 0 0 0 0 0 0 0 0 0 0 0 0 0 0 0 0 0 0 0 0 0 0 0 0 0 0 0 0 0 0 0 0 0 0 0 0 $$ $$ \mathrm {d} = \mathrm {d} _ {1} + \mathrm {d} _ {2} + \mathrm {d} _ {3} + \dots + \mathrm {d} _ {n} $$ $$ \mathrm {d} = \mathrm {d} _ {1} + \mathrm {d} _ {2} + \mathrm {d} _ {3} + \dots + \mathrm {d} _ {n} $$ $$ = 1 0 0 0 0 0 0 0 0 0 0 0 0 0 0 0 0 0 0 0 0 0 0 0 0 0 0 0 0 0 0 0 0 0 0 0 0 0 0 0 0 0 0 0 0 0 0 0 0 0 0 0 $$ Figure 11: The TP in green (A) and brown (B) leaf of Hijal plant in different sampling season.
| SP | SN | WP | WN | HLP | HLN | KLP | KLN | |||||||||||||||||||
|---|---|---|---|---|---|---|---|---|---|---|---|---|---|---|---|---|---|---|---|---|---|---|---|---|---|---|
| SP | 1 | |||||||||||||||||||||||||
| SN | -0.314 | 1 | ||||||||||||||||||||||||
| WP | -0.267 | 0.661** | 1 | |||||||||||||||||||||||
| WN | 0.285 | 0.497 | 0.241 | 1 | ||||||||||||||||||||||
| HLP | 0.784* | 0.295 | 0.647* | 0.647* | 1 | |||||||||||||||||||||
| HLN | -0.319 | 0.883** | 0.842** | 0.361 | 0.500 | 1 | ||||||||||||||||||||
| KLP | 0.840* | 0.663** | 0.318 | 0.510 | 0.278 | 0.502 | 1 | |||||||||||||||||||
| KLN | -0.148 | 0.887** | 0.796** | 0.321 | 0.538 | 0.847** | 0.574 | 1 |
Table 1: ** Correlations among nutrients in sediments, water and plant leaves.
* Correlation is significant at the 0.05 level and Correlation is significant at the 0.01 level (2-tailed). SP=TP in Sediments, SN=TN in Sediments, WP=TP in Water, WN=TN in water, HLP= TP in the leaf of Hijal, HLN= TN in the leaf of Hijal, KLP=TP in the leaf of Koroch, KLN = TN in the leaf of Koroch. Table 1:** Correlations among nutrients in sediments, water and plant leaves.
The study found that there was a significant positive correlation between TP of plants leaves and TP of water. In both Koroch and Hijal leaves, the amount of TP was increased when the amount of TP was increased in sediments. There was a positive statistical correlation between TN of leaves of Hijal and TN of water. Study found that the content of TN in the leaves of Koroch increased with the increasing of TN in the sediments and there was a strong positive statistical correlation between them. Study showed that there was a significant positive correlation between TP of plants leaves and TP of sediments. The TP in leaves of Hijal increased with the increase of TP in water and there was also a strong positive correlation between them. The content of TP in the leaves of Koroch increased with the increasing of TP in sediments and there was a strong positive statistical relationship between them. The vegetation responds positively to surface water inorganic N (NH4-N, NO3-N) and P (PO4-P) [22]. The content of TP of plants leaves increased with the increase of the TP of sediments and also showed a significant positive correlation. The content of TN in the leaves of Hijal increased with the increase of TP in water. There was a strong positive statistical relationship between them. The content of TN in the leaf of Koroch also increased with the increase of TN in the sediments. The vegetation responds positively to available N and P in surface sediments [22].
Conclusion
Results of the study concluded that the sediments of the Ratargul Swamp forest were nutrients-enriched which indicated that more input of external anthropogenic nutrient in turn may disturb the present ecological balance of this complex ecosystem. The amount of TN and TP in the water was higher in the wet season than dry season which might be due to the excessive use of nitrogen and phosphorous in the surrounding agricultural land. The average TOC in the plant leaves were higher in wet season than dry season, while the TN and TP in the plant leaves were higher during dry season than in the wet season. Thus the study concluded that the amount of TN and TP in the plants leaves depend on the amounts of TN and TP in the sediments and water. Finally, the study stated that aquatic environment of Ratargul swamp forest in terms of nutrients load are suitable with the changes of seasons. Thus the study suggested maintaining the sound and healthy ecosystem of the forest and surrounding areas are needed regular monitoring and proper management of the forest.
Acknowledgment
Special appreciation to Mr. Rony Basak (Assistant Professor, Department of Geography and Environment, Shahajalal University of Science and Technology, Sylhet), Mr. Nuraalam Siddique (Assistant Professor, Department of Biotechnology, Bangabandu Sheikh Mujibur Rahman Agricultural University, Gazipur) and Mr. Md. Nahian (Dept. of ESRM, MBSTU) for their constructive advices and suggestions during the research work.
References
-
Manhas RK, Gautam MK, Kumari D (2009) Plant diversity of a fresh water swamp of Doon valley, India. J Ame Sci 5(1): 1-7.
-
Minar MH, Hossain MB, Shamsuddin M (2013) Climate change and coastal zone of Bangladesh: vulnerability, resilience and adaptability. Middle-East J Sci Res 13(1): 114-120.
-
Nahian M, Islam MS, Kabir MH, Tusher TR, Sultana N (2018) Seasonal variation of water quality in Gowain river near Ratargul swamp forest, Sylhet, Bangladesh. Grassroots J Natural Resources 1(1): 26-36.
-
Sharma N, Joshi SP (2008) Comparative study of fresh water swamp of Doon valley. J Ame Sci 4(1): 7-10.
-
Gupta N, Anthwal A, Bahuguna A (2006) Biodiversity of Mothronwala swamp, Doon valley, Uttaranchal. J Ame Sci 2(3): 33-40.
-
Brown SL, Brinson MM, Lugo AE (1979) Structure and function of riparian wetlands. In: Johnson RR, & Cormick JE (Eds.), Strategies for protection and management of flood plain wet lands and other riparian ecosystems. US Forest Survey General Technical Report W.O. 12. Washington DC, U.S.A, pp: 17-31.
-
Xu Y, Chunjing Z (2015) Hydrological research progress in forest marsh ecosystem. In: International conference on agricultural, ecological and medical sciences (AEMS-2015), Thailand.
-
Islam MS, Islam MA, Sweety NA, Hossain MAR, Kabir MH (2016) Assessment of aquatic faunal diversity in the Ratargul swamp forest at Sylhet in Bangladesh. J Environ Sci Nat Res 9(2): 51-64.
-
De AK (2010) Environmental Chemistry. 7th edition. New Age Int. (P) Ltd. New Delhi, pp: 169-170.
-
Osaki M, Ping HE, Takebe M, Shinan T (2003) Comparison of whole system of carbon and nitrogen accumulation between two maize hybrids differing in leaf senescence. Photosynthetica 41(3): 399-405.
-
Omokhua GE, Koyejo AO (2008) Impact of deforestation on ecosystem: A case the freshwater swamp forest in Onne study of Niger delta region, Nigeria. J Agricul Social Res 8(2): 1-5.
-
Elser JJ, Bracken MES, Cleland EE, Gruner DS, Harpole WS (2007) Global analysis of nitrogen and phosphorus limitation of primary producers in freshwater, marine and terrestrial ecosystems. Ecol Letter 10(12): 1135-1142.
-
Reich PB, Oleksyn J (2004) Global patterns of plant leaf N and P in relation to temperature and latitude. Proceeding of National Academy Sci 101(30): 11001- 11006.
-
Choudhury JK, Biswas SR, Islam MS, Rahman O, Uddin SN (2004) Biodiversity of Ratargul swamp forest, Sylhet. IUCN Bangladesh Country Office, Dhaka, Bangladesh, pp: 4-24.
-
BFD (Bangladesh Forest Department) (2013) Ministry of environment and forest, Government of the People’s Republic of Bangladesh.
-
Jackson ML (1985) Soil Chemical Analysis. Oaretic Hall of India Private Ltd., New Delhi, India.
-
Piper CS (1950) Soil and plant analysis. Adelaide University, Hassel press, Australia, pp: 78.
-
Page AL, Miller RH, Kenny DR (1989) Methods of soil analysis: Part II. 2nd (Edn.), American Society of Agronomy Inc., Wisconsin, USA, pp: 1203.
-
Black CA (1965) Methods of soil analysis: Part 2, American Society of Agronomy Inc. Madison, Wisconsin, USA, pp: 67.
-
Craft C, Casey WP (2000) Sediments and nutrients accumulation in floodplain and depressional fresh water wetlands of Georgia, USA. Wetlands 20(2): 323- 332.
-
Hossain MG, Bhuiyan HAM (2016) Spatial and temporal variations of organic matter contents and potential sediment nutrient index in the Sundarbans mangrove forest, Bangladesh. J Civil Eng 20(1): 163- 174.
-
Craft C, Krull K, Graham S (2007) Ecological indicator of nutrient enrichment, freshwater wetland, Midwestern, United States. Ecological Indicator 7(1): 733-750.
- Lessons to Learn: Trees are More than the Lungs of the World
- Community Forestry Enterprises as a Model for Sustainable Forest Development: The Case Of The "Baja Tarahumara" in Chihuahua, Mexico
- Ecological and Socio-Economic Impacts of Chromolaena odorata and Mesosphaerum suaveolens, Two Invasive Alien Species in Central and Southern Benin, West Africa
- Epigenetic Sustainability: Modeling the Human Factor as a Natural Resource through Science 4.0 and the NR3C1 Biological Pilot
- Growth-at-Risk: A Framework for Assessing Economic Vulnerability
- The Rural Territory as a Socioecological System for the Management of Public Policy for Sustainable Rural Development