Characterization of Soil Physicochemical Properties and its Implications to the Water Quality of Elbahi Dam, Somali Region, Ethiopia
In most cases, dam construction may have several overrunning social and economic purposes. Likewise, the Elbahi dam was constructed with multiple aims mainly to function for irrigation, water supply for other needs while targeting the protection of lower catchments from flood problems. The study area was stratified into two based on the slope gradient to take the soil samples. Water samples were also collected from the dam for analysis. As a result of erosive runoff that leads to a high amount of eroded and deposited particles, clay loam soil texture (fine) is dominant in the lower catchment, while loam soil texture (coarser) is inhabited in the upper catchment. Higher values of soil bulk density and available soil P were recorded at upper catchment whereas the highest value of soil porosity, organic matter, soil K and soil TN were recorded in the lower part of the catchment. The quality of water in the Elbahi dam shows the permissible limit of the WHO and FAO set for drinking and irrigation purposes. Water pH, EC, and temperature of the Elbahi dam was likely suitable for aquatic lives. However, due to sheet and rill erosion from mismanaged agricultural and grazing systems in the watershed, the water level has shown lower, and sediment deposited. Furthermore, the discharge of domestic waste and washing of different vehicles at and around the reservoir may be the treat to the soil physicochemical and water quality deterioration.
Introduction
Most African soils exhibit low nutrient levels as a result of high nutrient losses due to land degradation [1]. According to Bationo, et al. [2] and Babu, et al. [3] soil degradation due to lack of appropriate land management such as organic manure and crop residues management and weak trend of the amendment through adequate inorganic fertilizer becoming main problems in farmlands. This makes maintaining and improving soil quality mandatory for sustainable agricultural production and a healthy environment mainly the water bodies [4, 5, 6].
Somali Regional State is characterized by arid and semi-arid agro-ecology with variable rainfall conditions. Generally, unlike the Faten zone, in the region there is a limited land cultivation practice while there is high livelihood dependency on livestock production and use of rangeland resources; however, the Fafen zone, where agro-pastoralists produce crops by cultivating virgin lands either after clear- cutting or slash and burning practices for forested land encroachment. Hence, severe deforestation and land cover change mainly for crop cultivation were observed along the Elbahi dam catchment [7]. Taking the undulating rugged topography into considerations, the cultivated bare lands, the subsequent free grazing at dry season, and overgrazing in the communal grazing lands in the catchment resulted in an erosive runoff. Runoff may not necessarily be erosive; except when it causes soil erosion while transporting the topsails to the downwards.
The soil depth and soil quality are further affected by wind erosion, which is the typical feature of the area for long days in a year. Wind erosion has become a serious problem, particularly during June to August as the westerly monsoon wind blows eastward with an average speed of 6m/s to the level of 2m above the ground. This erodes loosen alluvial soil particles with a low proportion of vegetation cover in the catchment. Recently, significant numbers of households rely on selling firewood, charcoal, and traditional house construction materials for their livelihood at the expense of the remnant shrubs, bushes, and healthy soil and water resources in the catchment [8].
Many dryland areas experience unexpected excessive rainfall that can cause flash floods and consequently, loss of life and property while creating on-site soil property change and off-site water and other environmental resources degradation. Therefore, the construction of Elbahi dam in Somali Regional State, between 1986 to 1993 Yohannes, et al. [7] was to harvest runoff water which could be lost with a high risk of destruction to the lower catchment is the one- stick-two-bird approach to conserve and gradually use the water for required socio-economic use.
The water for domestic and livestock consumption in this environment is limited. However, visible changes in the dam water level change in water quality and fish’s loss in the dam initiated us to conduct this research. We have investigated whether the upper catchment land management practice influenced soil physicochemical properties and it had water quality implication in the dam.
Methods and Materials
Description of the Study Area
Elbahi dam is located near Jigjiga town, in the Somali regional state of Ethiopia. It is located at 9°21′N and 42°48′E, with an elevation of 1600-1800 meters above sea level (Figure 1). It covers 1083.78 ha of which the cultivated land covers 831.27 ha and grassland cover 212.39 ha (Table 1).
| Land-use type | The area in hectare (ha) |
|---|---|
| Shrubland; Dense | 20.23 |
| Grassland | 212.39 |
| Bare land | 14.45 |
| Cultivated Land | 831.27 |
| Other (Urban) | 5.44 |
| Total | 1083.78 |
Table 1: Land use/cover of the study area (source, Yohannes, et al. [7]).
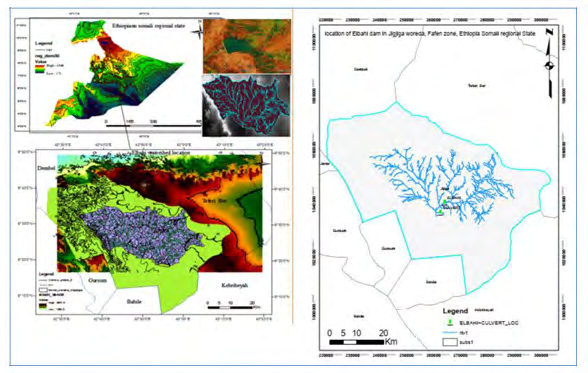
The catchment is a low lying vast area and most of its landmass is located in Fafen zone; previously Jigjiga Zone, excluding Teferiber, Kebribeyah, Babile, Gursum, and Dembele districts. However, at the micro-level, the physiographic feature is a rolling type of landmass, which forms drainage channels that facilitate runoff towards the Jerer and Wabishebele river basins. The major soil classes in Elbahi dam catchment are Dystric nitisols (48%), Vertic cambisols (50%) and chromic luvisols (2%), which affect soil degradation differently [9, 7].
The climate is arid and semi-arid, influenced by the Gulf of Aden and the Indian Ocean to the north and east and by the highlands of Ethiopia, lying northwest of the region. The catchment is characterized by a bimodal rainfall with average annual precipitation of less than 200 mm in the southeast, to 600-700 mm in the north and western parts of the Plain. However, the onset of the two rainfall peaks varies between areas within the Jigjiga Plain.
The northern and northwestern parts of the Plain are characterized by two cropping seasons. The first rainy season commences during mid-March and extends to the end of May, while the second rainy season starts in mid-July and ends in late September. In this part of the plain, the second rainy season is normally heavier than the first rainy season.
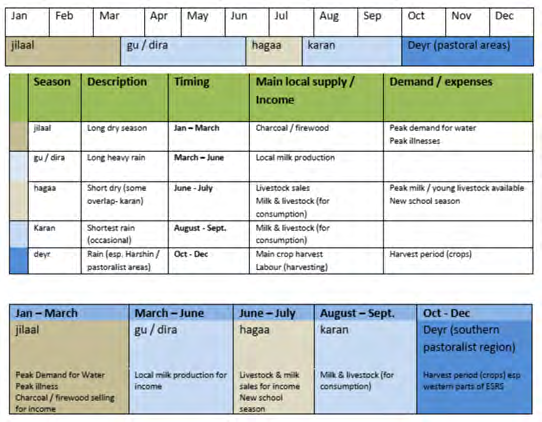
The climate is mostly arid/semi-arid in lowland areas and cooler/wetter in the higher areas, with annual average rainfall ranging from 150 to 600 mm per year. There are two main rainfall seasons in the region the Diraa’ rains and the heavier Karan rains, with variations to exact timing and amount of the rain between years. In the southern lying area, the rains are dominant in October to December during the Deyr rains [10, 11]. The combination of short Deyr rains and extreme cold have presented challenges to agriculture. The effects of climate change are far-reaching not only are droughts more frequent, impacting agriculture, livestock, and availability of water for human consumption. In the longer-term water, stores become depleted due to reduced rainfall [12, 13].
Both sets of rain are equally important for the cultivation and maturation of crops. However, the southern part of the Plain; which includes some peripheral areas of Ogaden lowlands, also has two rainy seasons; which are ‘Dira’ (the rain starts during mid of March and stretches towards the end of May) and ‘Deyr’ (the rain starts in early October and ends at the end of November). The texture of soils in most areas is clayey; except some exposed soils with steep slope gradients, which are sandy or gravely [14].
Soil Sampling Design and Sample Size
Soil samples were collected from transects lines following contour lines in the catchment. The catchment was delineated using Google earth software and Global
Positioning System (GPS) receiver. Then it was stratified into upper and lower elevation gradients based on altitudinal range.
Having the same land-use history and trends bear in mind the slope difference was considered as a source of variation on the soil properties. Therefore, the catchment was divided into two slope gradients; lower and upper elevations. Each stratum was considered as a homogenous group to take soil samples randomly. Hence, the lower catchment was assigned with elevation one (E1) and elevation two (E2), while with upper catchment was assigned with elevation three (E3) and elevation four (E4). The length used to locate each quadrat was 500m and each transect line was situated at 500m distance. Each quadrat had 25m*25m dimensions, and samples were taken from corners of the polygon and center, from top 0-30cm soil depth. The disturbed soil samples were then bulked from all sample pits in the quadrate to give one composite sample amount approximately 1kg.
Moreover, one undisturbed sample was taken with a core sampler for bulk density determination from each quadrat. The sample collection at each depth (0-30cm) across the quadrants was done manually using an auger. Then six soil samples replicated three times per stratum were collected to have a total of 36 samples for laboratory analysis of the soil physical and chemical properties in the catchment.
Collected soil samples were air-dried at room temperature, crushed, homogenized and passed through a 2mm sieve for laboratory analysis in Ethiopia Somali regional soil lab. The soil physicochemical analyses were carried out to determine the soil texture, bulk density, soil porosity, total nitrogen (TN), available phosphorus (P), potassium (K) and organic matter (OC) from the 36 representative samples.
Soil physical property: soil texture was determined by the hydrometer method as described by Okalebo, et al. [15]. Once the sand, silt, and clay were separated, soil in each sub- sections of the field was categorized based on catchment and identified to textural class based on the soil textural triangle described by Rowell [16]. Bulk density was determined based on 100 cm3 core samples (core sampling technique) taken from the catchment. The same sample was used to determine percent porosity.
Chemical properties of the disturbed composite soil samples of each location were subjected to standard laboratory analysis methods. Accordingly, soil organic carbon content (OC-% convert to gk/g), total nitrogen content (TN- % convert to gk/g), soil available phosphorus content (mg P/kg soil) and potassium (K -mg/g of soil) were analyzed. To determine the organic carbon content of the soils, Walkley and Black [17] method were employed; total nitrogen content of the soils was determined as described by Sahlemedhin and Taye [18] using the Kjeldahl [19] procedure by oxidizing the organic matter with sulfuric acid and converting the nitrogen into NH4+ as ammonium sulfate. Available phosphorus was determined by the Olsen method using sodium bicarbonate (0.5M NaHCO3) as an extraction solution as described by Olsen [20].
Nine water samples were collected from the Elbahi dam reservoir to identify the effect of sediment on the quality of water and have taken for analysis to Somali regional soil laboratory following standard procedure described by APHA (1998). Pre-washed 500 mL sizes of PVC plastic bottle was used to collect a water sample for water quality analysis. Sample containers were labeled on the field using appropriate codes and water samples were temporarily stored in the ice-packed cooler, transported to the laboratory and stored in a refrigerator at about 40C before analysis [21]. The temperature was determined on-site using HQ40d multimeter and the water pH was determined using a pH meter with a combined glass electrode in water as described by Carter [22]. Electrical conductivity (EC-dS/m) was measured using a conductivity meter as described by Okalebo [15].
Results and Discussions
Soil Physical Properties in Elbahi Dam Catchment
Soil Texture
The soil textural data shows that lower elevation of the catchment had exhibited clay loam soil, while the upper elevation has shown loam (Table 2). This might be due to the reason that the upper slope land was washed by the torrential and showery rainfall characteristics and subsequent runoff at the area since clay loam soil textural class aggravates soil erosion rather than water percolation. The result, therefore, depicts a high amount of silt particles from the upper elevation were eroded and deposited at a lower elevation. The result, in turn, showed that the higher elevations of the catchment were the basic contributing factors for sedimentation or the siltation of soil particles in the Elbahi dam. This ultimately would have accelerated phytoplankton growth and water toxicity while enhancing soil nutrient concentration in the dam.
The upper and lower elevation areas of the catchment were contributed to the siltation of the dam. Loamy soils are soils with an equal proportion of sand, silt, and clay; they can play a significant role in eutrophication of the Elbahi dam. Consistent with this suggestion, Mohamed and Mishra [23]
and Abdi, et al. [14] reported that the soil of Jigjig Plain was developed mainly from limestone parent materials in association with granite or sandstone as well as basalt and this may have contributed to the clayey texture of the soils. The very high clay proportion describes the stability in soil aggregates, which exhibits less liability of the surface soil layers to wind and water erosion. The very high clay content may indicate better water holding capacity and nutrient status of soils of the area. The type of clay will determine nutrient holding capacity. Therefore, this characteristic of soils of the study area indicates a high potential for crop production provided that other limitations are removed. Soils vary in their resistance to erosion partly based on texture and amount of organic matter. The resistance also depends on soil conditions and depth. Soils high in silt and low in clay and sand are highly erodible [24].
| Catchment | Sand-% | Clay-% | Silt-% | Textural Class |
|---|---|---|---|---|
| Upper catchment | 33.0 | 30.5 | 36.5 | loam |
| Lower catchment | 36.25 | 27.5 | 36.25 | clay Loam |
Table 2: Soil particle size distribution.
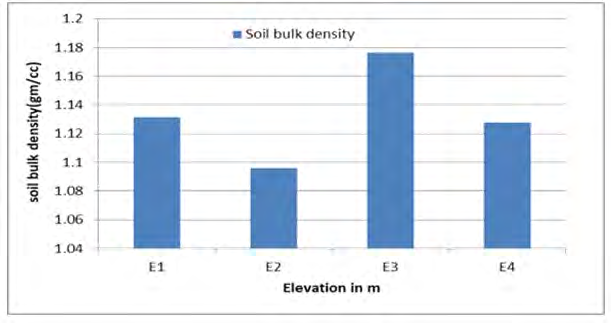
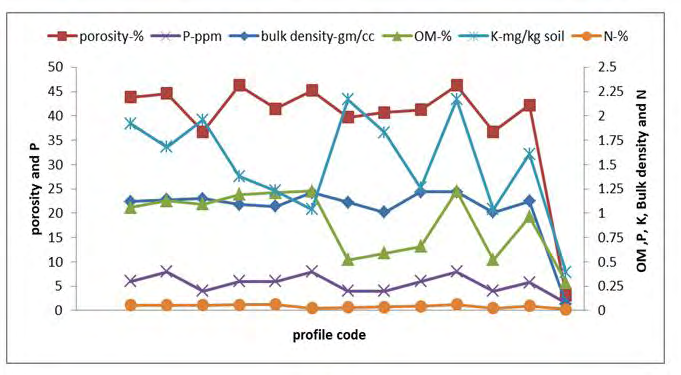
Soil Bulk Density: Soil health has been described as integral to the concept of sustainable agriculture. Climate change has a potential impact on soil health through the physical, chemical and biological properties of soil. The change in the statistical properties of the climate system when considered over long periods regardless of the cause is called climate change. It is attributed directly or indirectly to human activity that alters the composition of the global atmosphere and which is in addition to natural climate variability observed over comparable periods. Soil health is a composite set of physical, chemical and biological attributes related to functional soil processes, which can be used to evaluate soil health status as affected by management practices and climate change [25]. According to the result (Figure 3), the highest value of bulk density was recorded at the upper catchment and the lowest was from the lower part of the catchment. The upper elevations in the study area are under the open grazing system. The animals with high population grazing year to year and this might be trampling the surface soil, and facilitate run-offs. On the other hand, the dominant grazing system with very few vegetation covers to contribute the organic matter and moderate the soil structure, bulk density raise is expected. Whereas, the lower elevations are more or less used for cultivated land-use system climate change that occurred in 2017 in Ethiopia might be caused by variability in soil compaction and porosity. Therefore, the higher erosion of soil or soil loss due to runoff is into the lower elevation with low bulk density. This ultimately contributes to the siltation problem of the dam.
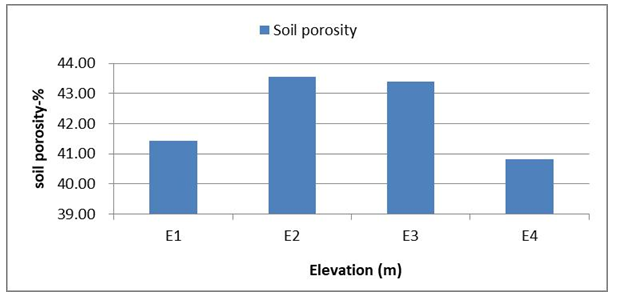
Porosity: The graph of porosity (figure 4), explains that the lower value of porosity was obtained in the upper catchment and the high value was obtained in the lower part of the catchment. Results show that during the study year (2016/17), soil erodibility and runoff loss in the rainy season were higher with the highest porosity record.
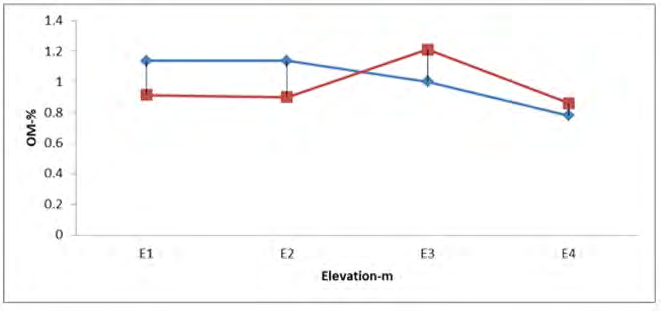
Organic Matter: The highest value of organic matter recorded in lower parts of the catchment and lowest values were recorded in the upper parts of the catchment (Figure 5). This might be due to the variable climatic condition of the seasons, the dominance of vegetation and grasses vary from elevation to elevation even within the same catchment. Based on the result, the catchment contributed to the accumulation of organic matter in the dam reservoir. This ultimately endangered the lifespan of the dam either through enhancing the phytoplankton population or making water in the reservoir to be toxic to both animals and aquatic life, unless intensive management measures on the catchment are taken.
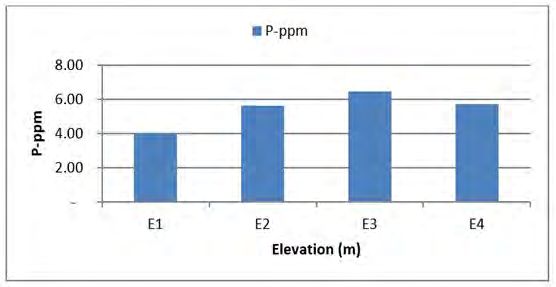
Soil Available Phosphorus (P): According to the laboratory result for soil available phosphorus (Figure 6), the highest value was recorded from the upper part of the catchment, while the lowest value was recorded from the lower part of the catchment. According to Olsen, et al. [20] who classified available phosphorous content of the range <5, 5-15, 15- 25 and >25 as very low, low, medium and high respectively, soils of the Elbahi dam catchment were in the low range (5- 15ppm) of available phosphorus. Therefore, the catchment contributed low available Phosphorus to the Elbahi dam. Hence, there would not be the fear of future enriching of the dam with Phosphorus concentration from the catchment, unless chemical fertilizers (P-sources) will be used on the catchment for agricultural crop production.
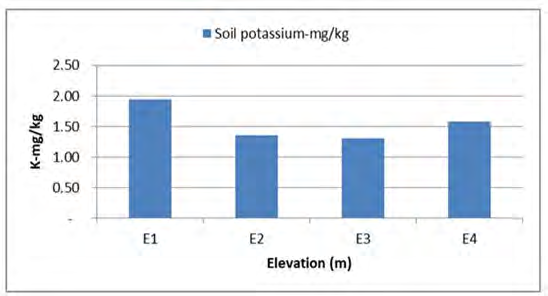
Potassium (K): The results of soil potassium data analysis in the dam catchment revealed that the highest concentration of potassium was from the lower part of the catchment, while the lowest value was obtained from the upper part of the catchment (Figures 7 and 9). Although different research findings justified that Ethiopian soil is not deficient in potassium [26], the current research was conducted to identify Potassium inflow concentration to the dam from different elevations of the catchments. Accordingly, catchment with higher elevation contributed more potassium concentration.
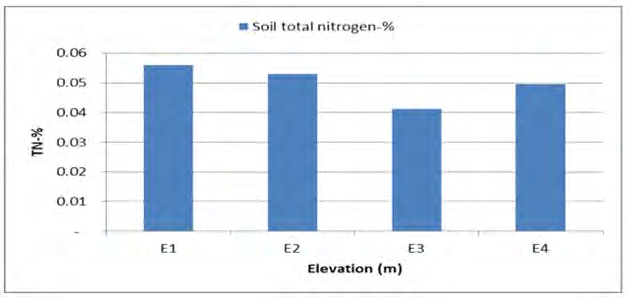
Soil Total Nitrogen (TN): The graph of soil total Nitrogen analysis results in Figures 8 and 9 below indicated that the highest TN value was recorded from a lower elevation, while the lowest value was from the higher elevation. This might be due to nitrogen being deposited in lower elevation; eroded from higher elevations. In addition to this, there may have occurred lateral and vertical nutrient translocation in the soil through leaching and mass flow. Nitrogen is an element with a high capacity of leaching and translocation [27]. This might be the reason for the high concentration of Nitrogen in the lower elevation of the catchment.
The overall effect of the catchment nitrogen to the micro-dam, TN rating is very low according to Havilin [27] who classified soil based on their N content as TN<0.1, 0.1- 0.15, 0.15-0.25, 0.25-0.5 and >0.5 as very low, low, medium, high and very high respectively. Therefore, problems are not expected from the catchment to the dam in line with the Nitrogen effect, unless, chemical nitrogen inhabited from used in the catchment for agricultural crop production. Moreover, soil erosion and sediment delivery processes are not only responsible for high sediment transport rates, but also for associated export of sediment-bound nutrients which finally are deposited in the reservoir and the river- bed sediments. These could lead to eutrophication of the reservoir water.
Water Quality of Elbahi Dam Reservoir
Temperature Corrected: Naturally, water bodies show changes in temperature daily and seasonally due to different activities that can contribute to changes in surface water. Dam water temperature varies from 24.0-23.50C on average 23.75 0C ±0.25 (Table 3) and this was within the WHO permissible limit (WHO, 2008). Thus, the water temperature of the Elbahi dam reservoir is considered suitable for aquatic lives. This result was similar to other studies reported to be within a range of 20.5 to 220C Chiroma [28] and 19.01 to 23.930C Okweye [29].
Electrical Conductivity (EC): The limit set by FAO [30] for irrigation indicating the presence of the high amount of dissolved inorganic substances in their ionized form. Sankpal and Naikwade [31] suggested that the higher the EC, the less amount of water available to plants, though the soil may appear wet. This is because plants can only transpire “pure” water as the usable plant water in the soil solution decreases dramatically with an increase in EC. Therefore, irrigation water with high EC reduces yield potential. Other studies also showed EC values to be in the ranges of 0.225 to 3.35 mS/cm Jayalakshmi [32], 2.13 mS/cm Inoti, et al. [33] which were similar with findings of water of Elbahi dam reservoir EC (mS/cm=ds/m) from 0.394 to 0.45 with an average value of 0.42 ±0.03 (Table 3).
pH: Soil pH values vary from 7.37 to 7.41 with an average value of 7.39±0.02 (Table 3). These values were within the permissible limit of WHO and FAO set for drinking and irrigation purposes [33, 34].
Total Dissolved Solids (TDS): The average values of TDS (mg/l) vary from 214.0 to 253.40, with the average value of 233.70±19.70 (Table 3) and this was moderately lower than the limit given by FAO for irrigation water [33, 34]. Higher TDS can be toxic to aquatic life through increases in salinity or changes in the composition of the water. Primary sources for higher TDS in the water might be due to runoff from agricultural fields, discharge of domestic waste from the town and other human activities like washing of different vehicles at and around the water site [35, 36]. Jayalakshmi, et al. [32] also reported similar TDS values (221 to 3534 mg/l) for water.
Total Alkalinity (TA): Measured TA (mg/l) values from the Elbahi dam reservoir vary from 41.4 to 48.20 with an average value of 44.80± 3.40 (Table 3) and match the prescribed limit set by WHO [35]. Thus, the water of the dam is suitable for irrigation purposes. In a similar study, higher TA values than the accepted values were reported by Alemayehu [37]; Sharma [38]; Soni, et al. [39] and lower values by Bhattarai, et al. [40]; Joshi, et al. [41]; Alani et al. [42].
Calcium and Magnesium:
Calcium and magnesium are among the most common constituents present in natural water and their salts are important contributors to the hardness of water [34]. In the Elbahi dam reservoir, calcium and magnesium contents ranged from 5.6 to 6.10 (mg/l) with an average value of 5.85 ±0.25 and 2.4 to 2.80 (mg/l) with average value 2.60±0.2 (mg/l) respectively (Table 3). The recorded content for calcium was lower than the permissible limit of WHO [35] while magnesium content was within the prescribed limit of WHO [35] and FAO Ayers and Westcot [43].
Chloride (Cl): Chloride values recorded for the Elbahi dam reservoir range from 7.9 to 8.10 (mg/l) with an average value of 8.0±0.1 (mg/l) (Table 3). According to the guidelines of WHO [35] and FAO Ayers and Westcot [43], values (7.9 to 8.10 mg/l) are within the lower acceptable limits (below 10 mg/l). The high chloride content in river waters may indicate pollution by sewage, industrial waste or intrusion of seawater into freshwater bodies [44, 45].
| Parameters | Mean | sd | max | min |
|---|---|---|---|---|
| Temperature (oC) | 23.75 | 0.25 | 24 | 23.5 |
| EC(mS/cm=dS/m) | 0.42 | 0.03 | 0.45 | 0.39 |
| TDS(mg/l) | 233.7 | 19.7 | 253.4 | 214 |
| Ca+(mg/l) | 5.85 | 0.25 | 6.1 | 5.6 |
| Mg+(mg/l) | 2.6 | 0.2 | 2.8 | 2.4 |
| CL(mg/l) | 8 | 0.1 | 8.1 | 7.9 |
| Alkalinity(mg/l) | 44.8 | 3.4 | 48.2 | 41.4 |
| pH | 7.39 | 0.02 | 7.41 | 7.37 |
Table 3: Physicochemical parameters of Elbahi dam reservoir samples (Mean ± SD).
Conclusion
The Ethiopian Somali Regional State comprises mainly arid and semi-arid rangelands, characterized by marked rainfall variability. Elbahi dam is under a serious problem of sedimentation and its consequences. Since the date of its complete construction, the dam does not provide its proper service as required. In Elbahi dam catchment soils in the lower catchment are relatively loam soil, while in the upper catchment are relatively clay. This might be due to run off, a high amount of silt particles from the higher elevation were eroded and deposited at a lower elevation. As it is well known, loam soils are soils with the equal property of sand, silt, and clay; they can play a significant role in eutrophication of the Elbahi dam. More soil bulk density, soil porosity, and available phosphorus were recorded at upper catchment while the highest value of the organic matter, soil potassium, and soil total Nitrogen recorded from the lower part of the catchment. Water quality in the Elbahi dam reservoir shows the permissible limit of the WHO and FAO set for drinking and irrigation purposes. Water pH, EC, and temperature of the Elbahi dam reservoir is likely suitable for aquatic lives. The average values TDS moderately lower than the limit given by FAO for irrigation water, due to agricultural runoff, discharge of domestic waste from the town and other human activities like washing of different vehicles at and around the water site. The measured total alkalinity Elbahi dam reservoir match with the prescribed limit set by the WHO, while the chloride value is within the lower acceptable limits of FAO guideline.
References
-
Omotayo OE, Chukwuka KS (2009) Soil fertility restoration techniques in sub-Saharan Africa using organic resources. Afr J Agric Res 4(3): 144-150.
-
Bationo A, Waswa B, Abdou A, Bado BV, Bonzi M, et al. (2012) Overview of long term experiments in Africa. In: Bationo A, Waswa B, Kihara J, Adolwa I, Vanlauwe B, Saidou K, (Eds.), Lessons learned from long term soil fertility management experiments in Africa, Springer 6: 1-26.
-
Babu S, Rana DS, Yadav GS, Singh R, Yadav SK (2014) A review on the recycling of sunflower residue for sustaining soil health. International Journal of Agronomy pp: 1-7.
-
Kumar K, Goh KM (2000) Crop residues and management practices: Effects on soil quality, soil nitrogen dynamics, crop yield, and nitrogen recovery. Advances Agronomy 68: 197-319.
-
Arrouays D, Antoni V, Bardy M, Bispo A, Brossard M, et al. (2012) Fertilité des sols: Conclusions du rapport sur l�état des sols de France. Innovations Agronomiques 21: 1-11.
-
Alam MK, Islam MM, Salahin N, Hasanuzzaman M (2014) Effect of tillage practices on soil properties and crop productivity in the wheat-mungbean-rice cropping system under subtropical climatic conditions. The Scientific World Journal pp: 1-15.
-
Yohannes GG, Tsegay W, Aklilu b (2018) Analysis of Factors Affecting the Sustainability of Elbahi Micro- Dam Catchment, Near Jigjiga Town, Ethiopia Somali Regional State, Ethiopia. Int J Environ Sci Nat Res 15(5): 555925.
-
Ethiopian Somali Regional State (ESRS) (2013) The Lower Shebelle Irrigation Scheme in Ethiopia: An Assessment of Productive Options.
-
OESPO (1999) Agricultural sector study: Soil resources in Oromiya. Oromiya Economic Study Project Office.
-
FEWSNET (2013) Seasonal Calendar Typical Year, Ethiopia.
-
FEWSNET (2017) Ethiopia Price Bulletin and Price Watch, Ethiopia.
-
DPPB (2017) Ethiopian Somali Regional State Disaster Prevention and Preparedness Bureau (DPPB) - Deyr 2017 Assessment Findings: Health and Nutrition Sectors.
-
DPPB (2018) Ethiopian Somali Regional State Monthly Early Warning and Response Report.
-
Abdi Ahmed ND, Setegn G, Yibekal A (2018) Characterization of Soil of Jijiga Plain in the Somali Regional State of Ethiopia. East African Journal of Sciences 12(1): 1-10.
-
Okalebo JR, Gathua KW, Womer PL (2002) Laboratory methods of soil and plant analyses: a working manual, 2nd (Edn.), TSBF –CIAT and SACRED Africa, Nairobi, Kenya, pp: 128.
-
Rowell DL (1994) Soil science: Method and applications. Longman Scientific and Technical, Longman Group UK Limited Addison, Wesley, England, pp: 350.
-
Walkley, Black A (1947) An examination of the Degtjareff method for determining soil organic matter and a proposed modification of the chromic acid titration method. Soil Sci 37(1): 29-37.
-
Sahlemedhin Sertsu, Taye Bekele (2000) Procedures for soil and plant analysis. National Soil Research Organization, Ethiopian Agricultural Research Organization, Addis Ababa, pp: 110.
-
Kjeldahl J (1883) Neue MethodezurBestimmung des Stickstoffs in organischenKörpern, New method for the determination of nitrogen in organic substances.
-
Olsen SR, Cole FS, Dean LA (1954) Estimation of Available Phosphorus in soils by extraction with Sodium bicarbonate. USDA Circ. No. 939, Washington DC.
-
Gangwar RK, Khare P, Singh J, Singh AP (2012) Assessment of physicochemical properties of water: River Ramganga at Bareilly, UP. J Chemical Pharmaceutical Res 4(9): 4231-4234.
-
Carter ES (1993) Evolutionary trends in the latest Triassic (upper Norian) and earliest Jurassic (Hettangian) radiolarian, geobios.
-
Mohamed B, Mishra BB (2007) Characterization of soils of Jijiga Plain, Ethiopia. JFAE 5(3-4): 416-424.
-
Nill D, Schwertmann U, SabelKoschella U, Bernard M, Breuer J (1996) Soil Erosion by Water in Africa Principles, Prediction and Protection. Rossdorf, Germany.
-
Atish P, Mutum L (2018) Impact of climate change on soil health: A review. IJCS 6(3): 2399-2404.
-
Hagos Brhane, Tekalign Mamo, Kassa Teka (2017) Optimum potassium fertilization level for growth, yield and nutrient uptake of wheat (Triticum aestivum) in Vertisols of Northern Ethiopia.
-
Havlin JL, Beaton JD, Tisdale SL, Nelson WL (1999) Function and forms of Nitrogen in plants. Soil Fertility and Fertilizers, 6th (Edn.), Prentice-Hall, New Jersey.
-
Chiroma TM, Ebewele RO, Hymore FK (2012) Levels of Heavy Metals (Cu, Zn, Pb, Fe, and Cr) in Bush green and Roselle Irrigated with Treated and Untreated Urban Sewage Water. International Research Journal Environmental Sciences 1(4): 50-55.
-
Okweye PS (2013) Seasonal Variation in physicochemical parameters and Heavy Metals Assessment in Surface Water of North Alabama. Research Journal of Chemistry and Environment 17(7): 68-115.
-
FAO (1986) Highlands Reclamation Study of Ethiopia Final Report, Food agricultural organization, Rome, Italy.
-
Sankpal ST, Naikwade PV (2012) Physicochemical analysis of effluent discharge of fish processing industries in Ratnagiri India. Bioscience Discovery 3(1): 107-111.
-
Jayalakshmi V, Lakshmi N, Singara Charya MA (2011) Assessment of physicochemical parameters of water and wastewaters in and around Vijayawada. International journal of research Pharmaceutical and Biomedical Sciences 2(3): 1040-1046.
-
Inoti KJ, Fanuel K, George O, Paul O (2012) Assessment of heavy metal concentrations in urban grown vegetables in Thika Town, Kenya. African Journal Food Science 6(3): 41- 46.
-
Ayers RS, Westcot DW (1994) Water Quality for Agriculture, FAO Irrigation and Drainage Paper Water, Rome, pp: 1-120.
-
WHO (2008) Guidelines for drinking-water quality - Volume 1: Recommendations Third edition, incorporating first and second addenda, World Health Organization, Geneva, pp: 668.
-
Annalakshmi G, Amsath A (2012) An assessment of water quality of river Cauvery and its tributaries Arasalar regarding physicochemical parameters at Tanjore DT, Tamilnadu, India. International Journal of Applied Biology and Pharmaceutical Technology 3(1): 269-279.
-
Alemayehu T (2001) The impact of uncontrolled waste disposal on surface water quality in Addis Ababa, Ethiopia. SINET Ethiopian Journal of Science 24(1): 93- 104.
-
Sharma P, Dubey A, Chatterjee SK (2013) Physico -Chemical Analysis of Surface and Ground Water of Abhanpur Block in Raipur District, Chhattisgarh, India. International J Innovative Technology Exploring Engineering 2(5): 2278-3075.
-
Soni HB, Dabhi M, Thomas S (2013) Surface water quality assessment and conservation measures of two pond ecosystems of Central Gujarat. International Research Journal Chemistry 3(3): 69-81.
-
Bhattarai KR, Shrestha BB, Lekhak HD (2008) Water Quality of Sundarijal Reservoir and its Feeding Streams in Kathmandu. Scientific World 6(6): 99-106.
-
Joshi DM, Kumar A, Agrawal N (2009) Studies on physicochemical parameters to assess the water quality of river Ganga for drinking purpose in Haridwar district. Research Journal of Chemistry 2(1): 195-203.
-
Alani R, Alo B, Ukoakonam F (2014) Preliminary Investigation of the State of Pollution of Ogun River at Kara Abattoir, Near Berger, Lagos. International Journal Environmental Science Toxicology 2(2): 11-23.
-
FAO (1994) Food and Agriculture Organization.
-
Getnet M, Amede T, Tilahun G, Legesse G, Gumma MK, et al. (2020) Water spreading weirs altering flood, nutrient distribution and crop productivity in upstream– downstream. Renewable Agriculture and Food Systems, pp: 1-11.
-
Martínez-Nicolás A, Galindo I, Griñán P, Rodríguez ZN, Cruz R, et al. (2019) Irrigation water saving during pomegranate flowering and fruit set period do not affect Wonderful and Mollar de Elche cultivars yield and fruit composition. Agricultural Water Management 226: 105781.
- Lessons to Learn: Trees are More than the Lungs of the World
- Community Forestry Enterprises as a Model for Sustainable Forest Development: The Case Of The "Baja Tarahumara" in Chihuahua, Mexico
- Ecological and Socio-Economic Impacts of Chromolaena odorata and Mesosphaerum suaveolens, Two Invasive Alien Species in Central and Southern Benin, West Africa
- Epigenetic Sustainability: Modeling the Human Factor as a Natural Resource through Science 4.0 and the NR3C1 Biological Pilot
- Growth-at-Risk: A Framework for Assessing Economic Vulnerability
- The Rural Territory as a Socioecological System for the Management of Public Policy for Sustainable Rural Development