A Preliminary Study on Land Use Effects on Birds Diversity in the Selected Agro-Ecosystems of Ekiti State, Nigeria
Birds as bio-indicator of an environment play an important role in the maintenance of balance in an ecosystem by providing various ecological services. The land-use effects on bird species diversity in Ekiti State were investigated to determine and compare the diversity, guild, structure and relative abundance in the four selected land use types of Ekiti State. Four study areas were selected among the land use types in the state. Transect count technique was employed to collect data on birds diversity and abundance. A total of 392 individual birds were observed that included 85 bird species belonging to 14 orders and 35 families. The order Passeriformes constituted the numerically dominant order represented with 37 species which represents 43.5% of the recorded bird species. Among the land use types, the highest species diversity was found in the natural forest (H`= 3.34) and the lowest was recorded in cashew plantation (2.88). There exist significant difference in the abundance of bird species and the total birds sighted in the four land use types at 5% level of significance (F=2.09, P= 6.33). The bird species composition of cashew plantation was more similar to that of cocoa plantation. The land-use features of the study areas and the resources abundance proved vital to the diversity of birds in the land uses as evidenced by the high species richness and abundance of insectivorous species in the study areas. Therefore, this study provide evidence that land-use types as a form of habitat modification may alter bird diversity structure and that the maintenance of the land use features will assist in the conservation of the birds in Ekiti State.
Introduction
The significance of land use type near wildlife habitats has been recognized globally as the major drive of biodiversity loss [1, 2, 3]. Roughly one- third of the global land area is devoted to cultivated land use system and as a consequence more area is expected to be converted to agricultural land use practices. Conservation in the tropics has its focus on pristine habitats such as rainforest [4], due to high level of biodiversity presence whereas human dominated landscape have been all but ignored in tropical ecological and conservation research as they support lower species diversity [5]. Over the last 30 years the natural habitats has been dwindling in area, which necessitates much of wildlife relocating and relies on land heavily used by humans and that the types and scale of land use types can have a marked influence on the wildlife populations’ structure [6, 7]. Consequent upon the spreading of agricultural landscapes decreasing at an alarming rate and pristine habitats shrinking, survival of many biodiversity invariably become the function of the types and patterns of land use which must be understood in order to incorporate these lands into conservation management plans. Land use can be a major source of feeding and breeding site for birds and a temporary or permanent habitat for some species [8]. Land use for agricultural purposes such as shade–grown cocoa was reported to harbour high biodiversity due to the presence of diverse high canopy forming species, complex forest structure, and absence of invasive exotic weeds [9].
Such land use type often provides suitable habitats for native fauna and were especially good for birds. In contrast, sun-grown monocultures plantation of Cocoa, coffee and oil palm were found to have adverse effects on biodiversity due to homogeneity and presence of invasive weed species [10]. Most deforestation has taken place in biodiversity rich tropical forests, these areas are expected to face even more pressures in the future, due to agricultural expansion. Conversion of natural habitats, especially intact old-growth forest to agricultural and pastoral lands is among the greatest threats to biodiversity in the recent times. Land use and its management have a major impact on natural resources including water, soil, nutrients, plants and animals and tend to vary from one country to another [11]. Land use could result into complete transformation, such as transforming a forest land to the settlement land or it could involve partial transformation through retaining the primary status of the land such as vegetation covers [12]. In most tropical forest areas, agricultural lands are predominant types of land use around native forest patches [13], but their influence alone on the persistence of fauna diversity in some tropical regions is poorly understood. Agricultural lands can be essential components in biodiversity conservation within tropical forest–agricultural landscapes if properly managed [14]. The isolation of protected areas as the sole means of protecting biodiversity is insufficient given the current trend in land use dynamics [9]. Many studies have demonstrated the potentials of diverse land uses in supporting biological diversity and stress their integration in conservation strategies [15]. Land uses when properly managed to an extent will not only support a large number of biodiversity but also serve as safe corridors that will permit dispersal of wildlife between patches [16]. Perfecto and Vandermeer [17] proposed that managed agricultural areas were equally important as the forest patches they surround. In their study, they found that species richness of ground-foraging ants in a well shaded organic Cocoa farm did not differ from that of a nearby Montane forest. Similarly, Harvey, et al. [18] confirmed the conservation value of agricultural lands, mainly areas that retained an abundant native tree cover. Such areas as suggested, often exhibited structural heterogeneity while providing habitat and resources for native fauna species [19]. It is known that tree and bird species are most sensitive to change and hence the most critical indicators of the biodiversity impact of land use conversion [20]. Ekiti state is among the areas that have severe land transformation due to various forms of human economic activities. These have resulted to intensive degradation that has transformed most of the natural environment, which in turn influence rate of biodiversity loss [21]. One of the pertinent challenges with which nature conservationist will be confronted within the nearest future will obviously be the discovering the relationship that exist between the changing environments and how land uses as the major driving force in the alteration of pristine ecosystems can be managed effectively to accommodate both human needs and biodiversity conservation. Hence there is a great need to establish the contribution of various forms of land uses on the sustainability of biodiversity.
Methodology
Study area
The study was carried out in Ekiti state which lies within the tropics and located between longitude 4° 55’ to 5° 45’ East of Greenwich meridian and latitude 7° 15’ to 8° 15’ north of the equator. The prevailing climate of the state is tropical, with average temperature of 25°C all year round and high relative humidity. The rainy season has an average of 270 days with mean annual rainfall of 1250 to 1400 mm. The pattern of rainfall distribution over the long rainy season between April and mid- November is bimodal with a peak in September while the dry season stretches from mid-November to the end of March. The vegetation of the state is diverse and has been described by several authors to fall in to forest eco-climate vegetation. The study area is characterized by secondary forest and three types of land use practices which are Cashew, Cocoa, Gliricidia plantations and Natural forest designated T1, T2, T3, and T4 respectively. The three study sites were selected from the prominent plantations in Ekiti State. (Site T1): Cashew plantation has from 5km (length) to 7.5km (width) and is characterized by shrub heights cashew trees and tall cashew trees (5- 7m) with dense canopy. (Site T2): Cocoa plantation ranges from 8km (length) to 6.5 km (width) and is characterized by high frequency of fairly tall trees (6-7m) with a moderately dense canopy. (Site T3): Gliricidia plantation ranges from 5km (length) to 6km (width) and has fewer tall trees (6.5- 7m) with a sparse canopy while (Site 4): Natural secondary forest ranges from 6km (Length) to 8km (width) and characterized high diversity of tree species with high frequency of both fairly tall and tall trees that ranges between 7-12.3m with dense canopy.
Data Collection
Survey of distribution and diversity of bird species was carried out in each of the four selected land use types (Natural forest, Cocoa, Gliricidia and Cashew plantations) for three consecutive months (April – June, 2019). Fixed length transect count method was employed for the assessment as described by Bibby, et al. [22]. The relative value of each land use types for accommodating bird species was determined by establishment of 3 transects of ½ kilometer length in each of the selected four land use types. The birds were observed by walking along the established transects with the assistance of observers for four consecutive days in a month for the duration of 3 months. Data collection commenced about 30minutes after dawn from 6.30 – 9.30am in the morning and 4.30 – 6.30pm in the evening to coincide with time the activities of birds was prominent [23]. To avoid the effects of pseudo-replication in the counting of birds, transect was reasonably space out by 300m distance apart [24].
In all transects, record was made of all the types and group number of bird species and food habits through direct observation. The birds were observed by naked eyes and with the aid of binoculars where visibility was low and their taxonomic groups were categorized base on field guide to birds of Western Africa [25].
Data Analysis
The data collected from the land use types were arranged, organized and entered into Microsoft excel spread sheet for analysis. Shannon-Weiner diversity index (H’) was used to analyze bird diversity of the land use. It was calculated as H’ = -∑ (ni/N) In (ni/N) Where: H′= index of species diversity, ni is the number of individual in species, S is the total number of species, N is the total number of individuals. Evenness index (J’) was calculated by following the equation.
J’= H’/ InS
Where: H= Shannon Weiner diversity index and S= Number of species Richness index (D) was calculated by the following equation D=S-1/InN Where D=Richness index, S= total number of species and N=total number of individuals Relative abundance of bird species was determined using encounter rates that give basic ordinal scales of abundance (abundant, common, frequent, uncommon and rare) [23]. Encounter rate of each species was calculated by dividing the number of birds observe by the number of hours spent searching, giving a figure of birds per hour or each species. The categories were: <0.1, 0.1-2.0, 2.1-10.0, 10.1-40.0 and >40. For each category, the following abundance score was given: 1(Rare), 2(Uncommon), 3(frequent), 4(common), 5(abundant) respectively. Moreover to understand bird community similarity among sites, Sorensen’s coefficient was applied. It was calculated as:
S= 3c/A+B+C+D
Where S=Sorenson’s Coefficient, c is the number of species the four land use types have in common, A is the total number of bird species found in land use type A, B is the total number of bird species found in land use type B and C is the total number of bird species found in the land use type C while D is the number of species in land use type D. Sorenson’s coefficient gives a value between 0 and 1, the closer the value is to 1, the more the land use types have in common. To check the presence of variation in bird’s parameters among the four study areas One Way ANOVA was used to determine whether there was a significant difference between land uses in term of birds’ abundance, richness and diversity.
Results
Bird Species Richness in the Selected Four Land Use Types of Ekiti State
A total of 85 bird species were identified belonging to 14 orders and 35 families. The order Passeriformes constituted the numerically dominant order represented with 37 species which represents 43.5% (n=37) of the recorded species while Psittaciformes, Musophagiformes, Ciconiiformes, Apodiformes and Pelecaniformes were the least dominant orders with 7.14%, 14.29%, 7.14%, 14.29%,14.29% respectively (Table 1). At the family level, family nectariniidae ranked numerically highest represented by 9 species which accounts 10.59% of the identified species (Table 1). At species level Laughing Dove (Streptopelia senegalensis), Variable Sunbird (Cinnyris venustus), Red Eye Dove (Streptopelia semitorquata), Red Chested Cuckoo (Cuculux solitaries), Olive-billed Sunbird (Nectarinia chloropygium), Green headed sunbird (Nectarinia vaticalis), L ittle Swift ( Apus affinis) and Copper Sunbird ( Cinnyris cupreus) were numerically the dominant species with 16, 15, 14, 13, 12, 12, 12 and12 number of individual respectively given rise to 27.11% of the total birds abundance observed in the study land use types from the result, it was gathered that the natural forest had the highest species richness compared to the other three (3) land use while the cashew plantation (T1) had the lowest bird species richness value. The natural forest had the lowest individual birds’ abundance but it had the highest bird species richness while gliricidia plantation (T3) recorded lower species richness but had the highest number of individual birds (Table 2).
| S/N | Common and Scientific Name | Family | Order | T1 | T2 | T3 | T4 | Total |
|---|---|---|---|---|---|---|---|---|
| 1. | White-Rumped Seed Eatercrithagra leucopygia | Fringillidae | Passeriformes | 4 | - | - | - | 4 |
| 2. | Diederik Cuckoo Chrysococcyx caprius | Cuculidae | Cuculiformes | 8 | - | - | - | 8 |
| 3. | Common Kestrel Falco tinnunculus | Falconidae | Falconiformes | 2 | - | - | - | 2 |
| 4. | Piping Hornbill Bycanistes fistulator | Bucerotidae | Bucerotiformes | 2 | - | - | 1 | 3 |
| 5. | Senegal Coucal Centropus senegalensis | Cuculidae | Cuculiformes | 3 | - | 1 | - | 4 |
| 6. | Little Bittern Arderailus sturmii | Ardeidae | Pelecaniformes | 5 | - | - | 2 | 7 |
| 7. | Yellow Billed Shrike Corvinella corvine | Laniidae | Piciformes | 2 | - | - | - | 2 |
| 8. | Olive-bellied Sunbird Nectarinia chloropygium | Nectarinidae | Passeriformes | 12 | - | - | - | 12 |
| 9. | Black Shouldered Kite Elanus caeruleus | Accipitridae | Falconiformes | 3 | - | - | - | 3 |
| 10. | Grey throated barbet Gymnobucco bonaparter | Capitonidae | Piciformes | 2 | 3 | - | - | 5 |
| 11. | Green headed sunbird Nectarinia vaticalis | Nectarinidae | Passeriformes | 1 | - | 11 | - | 12 |
| 12. | African pied wagtail Motacilla aguimp | Motacillidae | Passeriformes | - | - | 3 | - | 3 |
| 13. | Red-headed Weaver Ploceus cucullatus | Ploceidae | Passeriformes | 4 | - | - | - | 4 |
| 14. | Red Chested Cuckoo Cuculux solitaries | Cuculidae | Cuculiformes | 5 | 8 | - | - | 13 |
| 15. | Slender-billed Weaver Ploceus pelzelni | Ploceidae | Passeriformes | 4 | 2 | - | - | 6 |
| 16. | Straw Tailed whydah Vidua fischeri | Motacillidae | Passeriformes | 2 | - | - | - | 2 |
| 17. | Swallow Tailed Kite Chelictinia riocourii | Accipitridae | Falconiformes | 1 | 1 | - | - | 2 |
| 18. | Golden backed weaver Ploceus jacaksoni | Ploceidae | Passeriformes | 2 | - | - | - | 2 |
| 19. | Tawny pipit Anthus campestris | Motacillidae | Passeriformes | 2 | - | 2 | - | 4 |
| 20. | Emerald Cuckoo Chrysococcyx cupreus | Cuculidae | Cuculiformes | 1 | 3 | - | 4 | 8 |
| 21. | Fork-Tailed Drongo Dicrurus adsimilis | Dicruridae | Passeriformes | - | - | - | 1 | 1 |
| 22. | Green bee-eater Merops orientalis | Meropidae | Coraciiformes | 8 | - | - | - | 8 |
| 23. | Crowned eagle Stephanoaetus caronatus | Accipitridae | Accipitriformes | - | 2 | - | - | 2 |
| 24. | Wattled black hornbill Cerotogyina atrata | Bucerotidae | Coraciiformes | - | 2 | - | - | 2 |
| 25. | Black Kite Mulvus migrans | Accipitridae | Falconiformes | - | 4 | - | - | 4 |
| 26. | Crested Guineafowl Guttera edouardi | Numididae | Galliformes | - | 1 | - | - | 1 |
| 27. | African pipit Anthus cinnamomeus | Motacillidae | Passeriformes | - | 2 | - | - | 2 |
| 28. | Tawny Eagle Aquila rapax | Accipitridae | Falconiformes | - | 4 | - | - | 4 |
| 29. | Little bee-eater Merops pusillus | Meropidae | Coraciiformes | - | 2 | - | - | 2 |
| 30. | Wattle Ibis Bastrychia carunculata | Threskiomithidae | Ciconiiformes | - | 5 | - | - | 5 |
| 31. | Red- Necked spurfowl Francolinus afer | Numididae | Galliformes | - | 4 | 1 | - | 5 |
| 32. | Yellow-rumped Tinkerbird Pogoniulus bilineatus | Lybiidae | Piciformes | - | - | - | 3 | - |
| 33. | Little Swift Apus affinis | Apodidae | Apodiformes | - | 10 | 2 | - | 12 |
| 34. | White Browned Coucal Centropus superciliosus | Cuculidae | Cuculiformes | - | 3 | - | - | 3 |
| 35. | Yellow-fronted Tinkerbird Pogoniulus chrysoconus | Lybiidae | Piciformes | - | - | - | 6 | 6 |
| 36. | Yellow Throated Tinkerbird Pogoniulus subsulphure | Lybiidae | Piciformes | - | - | - | 3 | 3 |
| 37. | Grey Throated Barbet Gymnobucco bonaparter | Capitonidae | Piciformes | - | - | - | 1 | 1 |
| 38. | Red Chested Sunbird Nectarinia erythrocerca | Nectariniidae | Passeriformes | - | 2 | - | - | 2 |
| 39. | Pied Crow Corvus capensis | Corvidae | Passeriformes | - | 3 | 7 | - | 10 |
| 40. | White-tailed Ant Thrush Neocossyphus poensis | Turdidae | Passeriformes | - | - | - | 1 | 1 |
| 41. | Capped Wheater Oenanthe pileata | Pycronotidae | Passeriformes | - | 1 | - | - | 1 |
| 42. | Dwarf Raven Corvus splendens | Corvidae | Passeriformes | - | 1 | - | - | 1 |
| 43. | Pied cuckoo Clamator jacobinus | Cuculidae | Cuculiformes | - | - | - | 2 | 2 |
| 44. | Black And White Casqued Hornbill Byconistes bucinator | Bucerotidae | Coraciformes | - | 6 | - | - | 6 |
| 45. | African Darter Anhinga rufa | Phalacrocoracidae | Pelecaniformes | - | 4 | - | - | 4 |
| 46. | Red Bellied Paradise Flycatcher Terpsiphone rufiventer | Monarchidae | Passeriformes | - | - | - | 2 | 2 |
| 47. | Black And White Manikin Lonchura cucullata | Estrildidae | Passeriformes | - | - | 10 | - | 10 |
| 48. | Copper Sunbird Cinnyris cupreus | Nectarinidae | Passeriformes | - | - | 12 | - | 12 |
| 49. | Francolin Double Spur Pternistis bicalcaratus | Phasianidae | Galliformes | - | - | 3 | - | 3 |
| 50. | Common Bulbul Pycnonotus barbatus | Pycronotidae | Passeriformes | - | - | 4 | 2 | 6 |
| 51. | Tambourine Dove Turtur tympanistria | Columbidae | Columbiformes | - | - | 10 | - | 10 |
| 52. | Variable Sunbird Cinnyris venustus | Nectarinidae | Passeriformes | - | - | 15 | - | 15 |
| 53. | Malachite Sunbird Nectarinia johnstoni | Nectarinidae | Passeriformes | - | - | 2 | - | 2 |
| 54. | Red-rumped Tinkerbird Pogoniulus atroflavus | Lybiidae | Piciformes | - | - | - | 3 | 3 |
| 55. | African Swift Apus barbatus | Apodidae | Apodiformes | - | - | 8 | - | 8 |
| 56. | Lizard Buzzard Kaupifalco monogrammicus | Accipitridae | Accipitriformes | - | - | 1 | - | 1 |
| 57. | African Thrush Turdus pelios | Turdidae | Passeriformes | - | - | 6 | - | 6 |
| 58. | Black Cuckoo Shrike Campephaga flava | Campephagidae | Passeriformes | - | - | 4 | - | 4 |
| 59. | Red-cheeked Wattle-Eye Platysteira blissetti | Platysteiridae | Passeriformes | - | - | - | 4 | 4 |
| 60. | Laughing Dove Streptopelia senegalensis | Columbidae | Columbiformes | - | - | 16 | - | 16 |
| 61. | Mourning Dove Streptopelia decipiens | Columbidae | Columbiformes | - | - | 4 | - | 4 |
| 62. | Little Greenbul Eurillas virens | Pycnonitidae | Passeriformes | - | - | - | 1 | 1 |
| 63. | Levaillant’s Cuckoo Clamator levaillantii | Cuculidae | Cuculiformes | - | - | - | 1 | 1 |
| 64. | Palm-nut Vulture Gypohierax angolensis | Accipitridae | Accipitriformes | - | - | - | 1 | 1 |
| 65. | Red Eye Dove Streptopelia semitorquata | Columbidae | Columbiformes | - | - | 14 | - | 14 |
| 66. | Pin Tailed Whydah Vidua macroura | Motacillidae | Passeriformes | - | - | 8 | - | 8 |
| 67. | Little Bee-Eater Merops pusillus | Meropidae | Coraciiformes | - | - | - | 2 | 2 |
| 68. | Green Hylia Hylia prasima | Sylvioidae | Passeriformes | - | - | - | 1 | 1 |
| 69. | Splendid Sunbird Cinnyris coccinigastus | Nectarinidae | Passeriformes | 4 | - | 6 | - | 10 |
| 70. | Western Grey Plaintain Eater Crinifer piscator | Musophagidae | Musophagiformes | - | - | 2 | - | 2 |
| 71. | Green Headed Negrofinch Nigrita canicapillus | Estrildae | Passeriformes | - | - | - | 1 | 1 |
| 72. | African Green Pigeon Treron calvus | Columbidae | Columbiformes | - | - | - | 1 | 1 |
| 73. | African Grey Parrot Psittacus erithacus | Psittacidae | Psittaciformes | - | 4 | - | - | 3 |
| 74. | African Pied Hornbill Lophoceros fasciatus | Bucerotidae | Bucerotiformes | - | - | - | 3 | 3 |
| 75. | Black-casqued Hornbill Ceratogymna atrata | Bucerotidae | Bucerotiformes | - | - | - | 1 | 1 |
| 76. | Black Winged Oriole Oriolus nigripennis | Oriolidae | Passeriformes | - | - | - | 3 | 3 |
| 77. | Blue Headed Wood Dove Turtur brehmeri | Columbidae | Columbiformes | - | - | - | 2 | 2 |
| 78. | Blue Shouldered Robin Chat Cossypha cyanocamter | Muscicapidae | Passeriformes | - | - | - | 1 | 1 |
| 79. | Blue-Spotted Wood Dove Turtur afer | Columbidae | Columbiformes | - | - | - | 4 | 4 |
| 80. | Blue Throated Brown Sunbird Cyanomitra cyanolaema | Nectariniidae | Passeriformes | - | - | - | 1 | 1 |
| 81. | Green Crombec Sylvietta virens | Macrophendae | Passeriformes | - | - | - | 3 | 3 |
| 82. | Cassin’s Flycatcher Muscicapa cassini | Muscicapidae | Passeriformes | - | - | - | 2 | 2 |
| 83. | Collared Sunbird Hedydipna collaris | Nectariniidae | Passeriformes | - | - | - | 3 | 3 |
| 84. | White-crested Turaco Tauraco leucolophus | Musophagidae | Musophagiformes | - | - | - | 1 | 1 |
| 85. | Forest Robin Stiphrornis erythrothorax | Muscicapidae | Passeriformes | - | - | - | 2 | 2 |
Table 1: Birds Distribution Based on Family, Order and Species on the Land Use Types in Ekiti State.
| Plots | Order | Family | Individual | Species |
|---|---|---|---|---|
| T1 | 7 | 12 | 86 | 22 |
| T2 | 11 | 13 | 84 | 24 |
| T3 | 8 | 15 | 152 | 24 |
| T4 | 10 | 22 | 70 | 33 |
Table 2: Table of Order, Family and Species in the Land Use Study Sites in Ekiti State.
Bird Species Abundance in the Four Land Use Types
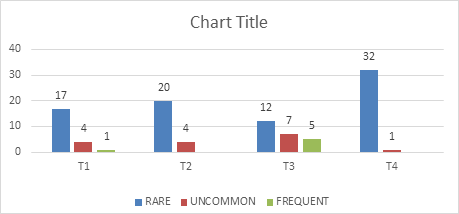
A total of 391 individual birds were observed in all the study land use types (Table 2). The abundance of birds varied between the four land use types being highest in gliricidia plantation (T3) with percentage value 38.87% of individual birds followed by cashew plantation (T1) which recorded 21.99%, cocoa plantation (T2) 21.48% while the natural forest (T4) recorded the least percentage value of 17.65% of individual bird species in the study land use (Table 2). One way ANOVA test for homogeneity was employed to test for significant difference in abundance of bird species between the land uses. The test vividly showed that there were significant differences in the abundance of bird species sighted in the four land use types at 5% level of significant (F=2.09 P=6.33). Further analysis of the relative abundance of the bird species recorded in the varying land use types indicated that of the bird species, 17, 20, 12 and 32 were rare, 4, 4, 7 and 1 were uncommon in the cashew, cocoa, gliricidia plantation and natural forest respectively while 1 and 5 bird species present in the cashew and gliricidia plantation respectively were in frequent category (Figure 1).
Birds Species Diversity and Community Similarity in Different Land Use Types
Diversity and evenness analysis was carried out based on the number of individual of bird species in the four (4) land use types and the result vividly showed that there were variations in species diversity between the land use types, natural forest land use type has the highest diversity index followed by cashew plantation then cocoa plantation and lastly gliricidia plantation (Table 3). Even though gliricidia plantation had the highest number of individual birds, it had a relatively low value of diversity. Also the relatively low numbers of individual birds’ observable in the natural forest have no retarding influence on the diversity of bird species in the land use type and with regard to species evenness equitability across the study land use types, natural forest registered more even distribution of bird species while cashew plantation had the least even distribution of birds. The variation found in the evenness of bird species in the study sites is an indication that the bird species were unequal in their abundance in the study site. The simpson’s index of diversity calculated for each land use types had the highest value in natural forest plantation, indicating that of 100 pairs of bird species observed at random 99 were compose of different species, while cashew plantation land use type recorded the lowest value. The community similarity of birds of the study land use types was low among the study site (Table 4).
| Land use types | T1 | T2 | T3 | T4 |
|---|---|---|---|---|
| No of Species | 22a | 24a | 24a | 33b |
| Individuals | 86a | 84a | 152b | 69c |
| Dominance_D | 0.07 | 0.06 | 0.06 | 0.04 |
| Simpson_1-D | 0.93 | 0.94 | 0.94 | 0.96 |
| Shannon_H | 2.88 | 2.97 | 2.91 | 3.34 |
| Evenness_e^H/S | 0.81 | 0.81 | 0.77 | 0.86 |
| Margalef | 4.71a | 5.19b | 4.58a | 7.56c |
| Land use type | T1 | T2 | T3 | T4 |
| T1 | -- | -- | - | - |
| T2 | 0.22 | -- | - | - |
| T3 | 0.17 | 0.13 | - | - |
| T4 | 0.11 | 0.04 | 0.04 | - |
Table 3: Diversity Indices of Bird Species Observed In the Four Land Use Types
Avifauna Foraging Structure
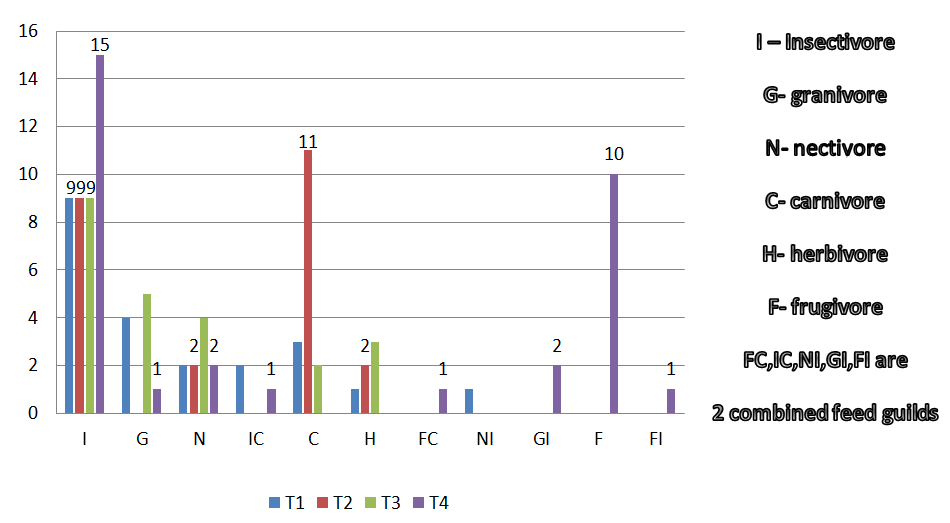
A feeding guild are groups of species that utilize on similar food resources in a habitat and its characterization is mostly based on the type of food being consumed and which invariably determines the feeding behavior of the different bird species and the availability of food resources. In this study eleven types of feeding guild were identified. The entire land use types were dominated by insectivores with 21% recorded each in cashew, cocoa, gliricidia plantation and 36% in the natural forest (Figure 2). Red chested cuckoo, Little swift, African pied wagtail, Black cuckoo shrike and Tambourine dove were the most frequent insectivores species inhabiting the study land use types.
Discussion
The species abundance in this study varies between the four land uses. The highest bird species abundance was recorded in the Gliricidia sepium plantation land use may be due to reasonable food resource availability in this land use type. The nature of arable farming activities existing within and around the Gliricidia sepium plantation may further influence and added to the diverse availability of food for different birds in the habitat. The study conducted by Soka, et al. [26] in Hombolo wetland shows that wetlands provide habitation and aided bird species abundance and richness because they serves as source of food to birds, supports the findings of this study. In regard to the structure of bird communities in the different land use types, birds’ diversity is higher in the land uses with high vegetation diversity as occurred in the natural forest. The natural forest examined in this study has mixture of vegetation features, tall large fruit bearing tree species with a wide canopy cover, trees with high diameter at breast height, dead wood stands and the greater diversity of birds in this land use type may be ascribed to these vegetation features and agedness of the habitat. The diverse vegetation flora and features play important roles in the provision of food to birds, support bird nesting, provide good cover for birds hiding place, make available variety of placements for nests, protection against predation and pleasant microclimate for bird species. Soka, et al. [26] asserted that the availability of diverse foods make birds of different feeding guild to dominate an area. Vegetation cover has been reported to have a strong influence on avifauna diversity [27]. The monoculture land use types including the gliricidia plantation present in the farming areas have reasonable bird diversity and richness but most bird species identified in the land uses were generalist with fewer forest dependent species. The overall result of this study shows consistency with the findings of Harvey and Villalobos [13] that agro-monoculture plantations harbor birds that are as abundant species rich and diverse as natural forest habitats. Fjeldsa [28] asserted that habitat disturbance creates increased habitat edge resulting in loss of specialist bird species and immigration of generalist species. The high levels of vegetation alteration as vividly observed in the mono agricultural plantation land uses may invariably be responsible for the heterogeneity in the avian order, families and species composition in the selected four land use types. Elmquist, et al. [29] asserted that nature fragmented system and habitat disturbances lead to loss of specialist species and encourage the generalist species. However, the structure of the monoculture land use types has been distinctly altered which led to the habitation of fewer forest dependent species, so bird diversity is more closely related to the structure and floristic characteristics of land use types. The land use specific relative abundance estimates vividly revealed that 17, 20, 12 and 32 bird species recorded in the Cashew, Cocoa, Gliricidia plantation and Natural forest respectively were in rare birds category and that higher percentages, 77%, 83% and 96% of birds recorded in Cashew, Cocoa and the Natural forest respectively, while extremely lower percentages fell into the uncommon and frequent relative abundance categories. The result of the relative abundance category of this study negates the findings of Cody [30] and Igl and Ballard [31] that reported that habitats dominated by woody vegetation or habitats that are structurally and floristically more diverse favours higher relative abundance categories, which was not the case in the present study because none of the bird species recorded were in common or abundance category even in the natural forest considered in this study. The foraging habits of the bird species identified in the selected land use types may explore the variation in flora composition and structural diversity of the land use types, which in accordance with the findings of Pearman [32] that variation in vegetation floristic and structure influences the distribution of bird foraging guilds. Eleven feeding guilds were identified in the study and insectivores were the most dominant group. The insectivorous feeding guild was mostly consisted of bird species from families Cuculidae and Bucerotidae such as Red chested cuckoo (13) and African pied hornbill (3) respectively. In the cashew and gliricidia plantation, the insectivore species were the most abundant species while insectivores’ species diversity was found to be highest in the natural forest land use type. This result outcome is fairly in agreement with the discovery of Blake and Loiselle [33] that insectivore’s species often rank higher in species richness and abundance in tropical forests while Rajaskekara and Verkatesha [34] reported the occurrence of higher numbers of insectivores in agroforests. The availability of a variety of food sources for both adults and young birds within and around the plantation land uses may be responsible for higher frequency of occurrence and abundance of insectivore’s species recoded in the study. On the other hand, the insectivores in the cocoa plantation recorded the same value which was obtainable in the other two plantations which is an indication that the frequency of spraying of the farm with insecticide has no pronounced effects on the activities of insects. The next predominant abundant trophic guild group in the land uses was carnivorous birds with African black kite (4), tawny eagle (4) and common kestrel (6) as the most prominent species which were mostly sighted in the cocoa plantation land use where abundance of food sources, such as frogs, snails, squirrels, rats and other small vertebrate species were readily present. Stafford, et al. [35] stated that the abundance of carnivorous bird species in rice fields may be due to the large quantity of food resources, such as polychaetes and mollusks in the rice plots during the migration season. The granivores feeding guild ranked next to carnivores and the granivorous species with higher frequency of occurrence were laughing dove (16), Red-eyed dove (14) and Black and white manikin (10). The nectarivore feeding guild were also more prominent in species richness and abundance in the gliricidia and cashew plantation than in the other land use types, this may be due to the presence of higher flowering intensity in the land use types, the most frequently observable nectarivore bird species were the sunbirds in the family Nectarinidae. Fleming [36] was of opinion that the structure and composition of avian communities changes in space and time with the availability of food resources and that variations are observed to be most visible among birds that feed on patchy and temporary food resources, like nectar and fruit. Cotton [37] found that the abundance and diversity of nectarivores are correlated with an increase in nectar availability. Fewer species of nectarivores inhabits agroecosystems negates the findings of the study. The frugivores were found only in the natural forest land use type and were completely absent in other land uses. The abundance of the available fruit resources may be one of the reasons for the high frugivore bird species richness and abundance in the natural forest. The abundance and richness of fruiting plants is crucial and relates positively with the diversity of frugivorous bird species and foraging behavior in certain habitat types [38]. Finally herbivores were the not abundant in the four land use types and were completely absent in the natural forest. The study provided findings on the effects of land uses on bird species diversity in Ekiti State and the results finding showed that the presence of diverse food sources is highly influential to the diversity and abundance of bird species in the study.
Conclusion
Birds are critically important in the ecosystem as they act as biological monitors, alerting people about what is happening in an environment. Therefore, it is necessary to have a data base for the land use effects on bird species diversity in Ekiti State. The result of this study revealed the variation in the diversity, abundance and distribution of birds in the study land uses and their most preferred land use type. The birds found were mostly insectivorous species and have the highest species composition and abundance in the natural forest and gliricidia plantation respectively. The relative abundance of birds encountered during the study fell mostly on rare category. The fact that more species of bird were not observed does not indicate that birds were totally absent in the study land use but it is an indication that the families of birds were also rare in the land use types and express the urgent need to map out effective strategy for the conservation of birds in the land use types of Ekiti State.
References
-
Deikumah JP, McAlpine CA, Maron M (2014) Mining matrix effects on West African rainforest birds. Biological Conservation 169: 334-343.
-
Kennedy CM, Marra PP, Fagan WF, Neel MC (2010) Landscape matrix and species traits mediate responses of Neotropical resident birds to forest fragmentation in Jamaica. Ecological Monographs 80(4): 651-669.
-
Ruiz-Guerra B, Renton K, Dirzo R (2012) Consequences of fragmentation of tropical moist forest for birds and their role in predation of herbivorous insects. Biotropica 44(2): 228-236.
-
Raman TRS (2003) Assessment of census techniques for interspecific comparisons of tropical rainforest bird densities: A field evaluation in the Western Ghats, India. Ibis 145(1): 9-21.
-
Naidoo R (2004) Species richness and community composition of songbirds in tropical forest agricultural landscape. Animal Conservation 7(1): 93-105.
-
Chamberlain DE, Fuller RJ, Brunce RGH, Shrubb M (2000) Changes in the abundance of farmland birds in relation to the timing of agricultural intensification in England and Wales. Journal of Applied Ecology 37(5): 771-788.
-
Benton TG, Bryant DM, Cole L, Crick HQP (2002) Linking agricultural practices to insect and bird populations: a historical study over three decades. Journal of Applied Ecology 39(4): 673-687.
-
Cline BB, Hunter ML (2016) Movement in the matrix: Substrates and distance-to-forest edge affect post metamorphic movements of a forest amphibian. Ecosphere 7(2): 11991-1202.
-
Siebert SF (2002) From Shade to Sun –grown perennial crops in Sulawesi, Indonesia. Implications for biodiversity conservation and soil fertility. Biodiversity and Conservation 11: 1889-1902.
-
Philpott SM, Arendt WJ, Armbrecht I, Bichier P, Diestch TV, et al. (2008) Biodiversity loss in Latin American Coffee landscapes: Review of the evidence on ants, birds and trees. Conservation Biology 22(5): 1093-1105.
-
Wood A, Stedma EP, Mang J (2000) Ten case study an overview. In: Wood (Ed.), The Root Causes of Biodiversity Loss. et al.). Earth scans Publication Ltd, UK, pp: 36-37.
-
Christopher PW (2003) The Implication of Land Use Change on Forestry Biodiversity. A case study of the “Half Mile Strip” on the Mount Kilimanjaro, Tanzania. LUCID. Project working paper 30. Nairobi. Kenya. International Livestock research Institute.
-
Harvey CA, Villalobos JAG (2007) Agroforestry systems conserve species-rich but modified assemblages of tropical birds and bats. Biodiversity and Conservation 16(8): 2257-2292.
-
Rodrigues JC, Pellizari VH, Mueller R, Baek K, Jesus EDC, et al. (2013) Conservation of the Amazon rainforest to agriculture results in biotic homogenization of soil bacterial communities. Proceedings of the National Academy of Sciences 110(3): 988-993.
-
Schroth G (2004) Agroforestry and Biodiversity conservation in tropical landscapes. Washington, D.C., Island Pess.
-
Norris K (2008) Agriculture biodiversity conservation opportunity knocks. Conservation Letters 1(1): 2-11.
-
Perfecto I, Vandermeer J (2002) Quality of agroecological matrix in a tropical montane landscape: Ants in Coffee plantations in Southern Mexico. Conservation Biology 16(1): 174-182.
-
Harvey CA, Medina A, Sanchez DM, Maes JC, Casanoves F, et al. (2006) Pattern of animal diversity in different forms of tree cover in agricultural landscape. Ecological Applications 16(5): 1986-1999.
-
Fahrig L, Girard J, Duro D, Pasher J, Smith A, et al. (2015) Farmlands with smaller crop fields have higher within field biodiversity. Agriculture Ecosystems and Environment 200: 219-234.
-
Bolwig S, Pomeroy D, Tushabe H, Mushabe D (2006) Crops, trees, and birds: Biodiversity change under agricultural intensification in Uganda’s farmed landscapes. Danish Journal of Geography 106(2): 115-130.
-
Drakenberg O (2007) Environmental Policy Brief for the Lake Victoria Basin. School of Economics and Commercial Law. Goteborg University 36: 2-36.
-
Bibby CJ, Burgess ND, Hill DA, Mustoe SH (2000) Bird Census technique. Academic Press, London.
-
Bibby CJ, Jones M, Marsden S (1998) Expendition Field Techniques: Bird Surveys. Expendition Advisory Centre. Royal Geographical Society, London.
-
Oksanen L (2001) Logic of experiments in ecology: Is pseudo- replication a pseudo-issue? Oikos 94:27-38.
-
Borrow N, Demey R (2004) Birds of western Africa, published by Christopher helm an imprint A and C Black publishers Ltd, 37 W Soho square, London WSD-3QZ.
-
Soka GE, Munishi PK, Mgina B (2013) Species diversity and abundance of Avifauna in and around Hombolo Wetland in Central Tanzania. International Journal of Biodiversity and Conservation 5(11): 782-790.
-
Radford JQ, Bennett AF, Cheers GJ (2005) Landscape-level thresholds of habitat cover for woodland-dependent birds. Biological Conservation 124(3): 317-337.
-
Fjeldså J (1999) The impact of human forest disturbance on the endemic avifauna of the Udzungwa Mountains, Tanzania. Bird Conservation International 9(1): 47-62.
-
Elmquist A, Langel Ü (2003) In vitro uptake and stability study of pVEC and its all-D analog. Biological Chemistry 384(3): 387-393.
-
Cody ML (1985) Habitat selection in birds. Academic Press.
-
Igl LD, Ballard BM (1999) Habitat associations of migrating and overwintering grassland birds in southern Texas. The Condor 101(4): 771-782.
-
Pearman PB (2002) The scale of community structure: habitat variation and avian guilds in tropical forest understory. Ecological Monographs 72(1): 19-39.
-
Blake JG, Loiselle BA (2001) Bird assemblages in second- growth and old-growth forests, Costa Rica: perspectives from mist nets and point counts. The Auk 118(2): 304- 326.
-
Rajashekara S, Venkatesha MG (2014) Insectivorous bird communities of diverse agro-ecosystems in the Bengaluru region, India. Journal of Entomology and Zoology Studies 2(5): 142-155.
-
Stafford JD, Kaminski RM, Reinecke KJ (2010) Avian foods, foraging and habitat conservation in world rice fields. Water birds 33(1): 133-150.
-
Fleming TH (1992) How do fruit and nectar feeding birds and mammals track their food resources? In: Hunter MD, Ohgushi T, Prick PW (Eds.), Effects of resource distribution on animal- plant interactions. Academic, San Diego, pp: 355- 391.
-
Cotton PA (2006) Seasonal resource tracking by Amazonian hummingbirds. Ibis 149(1): 135-142.
-
Moegenburg S, Levey DJ (2003) Do frugivores respond to fruit harvest? An experimental study of short-term responses. Ecology 84(10): 2600-2612.
- Lessons to Learn: Trees are More than the Lungs of the World
- Community Forestry Enterprises as a Model for Sustainable Forest Development: The Case Of The "Baja Tarahumara" in Chihuahua, Mexico
- Ecological and Socio-Economic Impacts of Chromolaena odorata and Mesosphaerum suaveolens, Two Invasive Alien Species in Central and Southern Benin, West Africa
- Epigenetic Sustainability: Modeling the Human Factor as a Natural Resource through Science 4.0 and the NR3C1 Biological Pilot
- Growth-at-Risk: A Framework for Assessing Economic Vulnerability
- The Rural Territory as a Socioecological System for the Management of Public Policy for Sustainable Rural Development