Improvement of Soil Biology and Rice Yield in Peat Land Ecology Using Aqueous Extract of Costus Afer: Soil Regenerative Agriculture under Rice Cropping
Conventional chemical fertilizer is harmfulness for the ecology and agriculture sustainability especially, in marginal agro- ecosystem of peat land (Histosol) which requires safeguarding for its’ potential of carbon sequestration however. Aqueous extract of Costus Afer was proposed as alternative input for rice production on peat land in South Côte d’Ivoire: a first trial was laid out with five (5) rates incrementing by 166.66liters/ha up to 666.66 applied in three splits (T4) and once (T5). Rice variety named VA6 was transplanted (20 cm × 20 cm) for three cropping cycles. A second trial was conducted during single cropping cycle adding the conventional fertilizer practice (T6) for the profitability assessment. Treatment induced high variability of rice grain yield (9.36 – 2.21 tha-1) during the Trial 1 and across both while, the yield was almost stable by treatment across cropping seasons (1-3) with significant effect for T4 and T5. Grand mean of rice yield recorded for both trials revealed lowest value for T6 (2.32 tha-1 ) while Costus solutions have induced more than 3.00 tha-1 and highest profit (293500 FCFA/ha) accounted for T5 with a net gain of 130 000 FCFA/ha/cycle according to Trial 2. There was a significant effect of the treatment on soil structural stability index recording a slight increase under Costus practice while soil pH (6.3 – 6.4) was favorable to bacteria, fungi, spore and endogenic cast of lumbric. Hence, the study supported the use of aqueous extract of Costus Afer as alternative input for regenerative agriculture especially, for rice cropping on peat land. However, the optimum rate should be more explored by further study.
Introduction
With the likely growth of world’s population towards 10 billion by 2050, the demand for rice will grow faster than for other crops [1]. There are already many challenges to achieving higher productivity of rice. In the future, the new challenges will include climate change and its consequences.
The threatening climate change includes a rise of the global average surface air temperature [2].
In the meantime, agriculture accounts for a driver of climate change especially, low-land rice production Clark [3] which is deemed to be the most productive Dossou Yovo [4] however. Indeed, flooding can promote gas emission (CO2; N2O and CH4) inducing air temperature rising with augmentation of greenhouse gas [5]. Hence, water management was advocated to rationalize irrigation and, thereby, reducing greenhouse gas emission [6]. Nevertheless, low soil fertility in low land as induced by long period of conventional agriculture practice, impairs the full success of such innovations.
Therefore, soils characterized by high inherent fertility like peat soil (Histosol) containing more than 40% of organic matter are often preferred by farmers [7]. Early, Attanandana [8] has explored possibilities to improve rice production on peat soil in line with efficient mineral nutrition. In contrast, there is limited investigation in the way to save this marginal soil (3%) acting as higher carbon (20 – 50%) sequester: environmental risks of farming on peat land was highlighted by Agus [9] with reference to agriculture practices. Bastoni [10] pointed out limited restoration of peat land under conventional practice of rice cultivation. Recommended practice of successive flooding and water drainage was showed as factor of aggravation of tillage and chemical fertilizer effects resulting soil particle instability Le Bissonnais [11], causing more emission of CO2.
Indeed, soil structural stability is related to soil content of structural carbon Golchin [12] which can be disturbed under conventional rice cropping practice. Otherwise, carbon sinking should be more expected in soil characterized by more stable structure. Therefore, regenerative agriculture Rhodes [13] is required for sustainable rice production on peat land. There are successful experiences with biofertilizer used in agriculture Fruchart [14] and vegetation extract may have high concentrations of nutrients [15]. Hence, the use of plant extract may be friendly for soil components and more profitable for plant production. In this line, a vegetal named Costus Afer, J.Braun was already identified as nutrients sources [16]. For rebuilding the function of peat land under rice cropping, aqueous extract of Costus Afer was used in the southern forest zone of Côte d’Ivoire characterized by limited extension of peat lands. The effect of three months fermented aqueous extract of Costus Afer was tested on soil quality and rice yield. The aim was to increase (i) soil biology; (ii) soil particle stability and (iii) to improve rice yielding. Overall, the study should recommend a specific dose of aqueous extract of Costus Afer for regenerative agriculture in low land rice cropping.
Material and Methods
Experimental Site
The experiment was conducted in South Côte d’Ivoire specifically, in the locality of Songon (5°19’32’’N; 4°10’17’’W;
56 msl) a peri-urban site of Abidjan. It is characterized by bimodal rainfall pattern with annual average amount of 1500 mm coupled with 28˚C fluctuating by 7˚ (dry season) and 5˚C (wet season). The experimental site is assimilated to a third order valley with permanent stream water in a forest zone. Plateau landscapes are prevailing (50 – 60 msl) with Acrisols occurrence in middle slope while Plinthosols and Petrosols are observed in upper slope. The lowland is characterized by Histosol occurrence that we assimilate to peat land that was already characterized by Yoboue [17] Table 1.
| Value (0-20 cm depth) | |
|---|---|
| pHwater | 4.7 |
| C.org(g/kg) | 45.42 |
| N(g/kg) | 2.2 |
| P (ppm) | 210 |
| Ca (cmol/kg) | 0.03 |
| Mg (cmol/kg) | 1.50 |
| K (cmol/kg) | 0.45 |
| Zn (cmol/kg) | 0.32 |
| Al (cmol/kg) | 0.08 |
| Fe (ppm) | 0.70 |
| CEC (meq/100g) | 3.51 |
Table 1: Chemical characteristics in 0 – 20 cm depth of studied Histosol.
Costus Afer
Costus Afer is characterized by its inflorescence as cone with bract covering 2 flowers and the corolla is white with a yellow throat. It is a perennial, rhizomatous herb up to 4 m tall. The leaves are arranged spirally, simple and entire; sheath tubular, closed, green with purple blotches; ligule 4–8 mm long, leathery, glabrous; petiole 4–12 mm long.
Aqueous extract of Costus Afer
Stems and leaves (5 kg) of Costus Afer (> 1 year old) were harvested, crushed and mixed in water (1 liter). The solution was leak out using paper filter. This manipulation was repeated 13 times up to observed limpid solution. Then, a composite sample of 13 sub-solutions early extracted was done with 250 ml of each. The composite sample of sub- solutions was keep in the shade of room conditions during three months before the trial. Chemical concentrations of leave and steams of Costus were already determined by Anyasor [16] as showed in Table 2.
| Chemistry | Leaf (mg /kg) | steam (mg/kg) |
|---|---|---|
| Calcium | 7.69±1.12 | 7.92±0.25 |
| Magnesium | 4.01±1.25 | 3.64±1.15 |
| Potassium | 1.02±0.34 | 0.95±0.03 |
| Sodium | 1.97±0.12 | 2.25±1.07 |
| Chromium | 0.07±0.01 | 0.10±0.05 |
| Lead | 0.01±0.00 | 0.02±0.00 |
| Manganese | 0.82±0.02 | 0.75±0.12 |
| Nickel | 0.17±0.01 | 0.12±0.05 |
| Copper | 0.44±0.02 | 0.52±0.11 |
| Cadmium | --- | --- |
Table 2: C**hemical concentration in organs of _Costus_ Anyasor [16].
---: non observed Table 2: Chemical concentration in organs of Costus Anyasor [16].
Rice Variety
A stable progeny (VA6) of 12th generation from a low- land rice hybrid (AR 051H,) released by Africa Rice Center with a potential yield of 8-10 tons per hectare according to agro-ecology was used. This rice variety is characterized by 1m in height, about 200 tillers/m2 and 75-90 days of cropping cycle duration.
Experimental Design
The rates of extracted solutions of Costus Afer were applied according to previous studies [18, 17]. After three cropping cycles testing different rates of the bio-fertilizer against blank treatment, a second trial (Trial 2) was conducted including additional treatment composed of chemical fertilizer (NPK + urea) as control corresponding to conventional fertilizer practice. The second trial was a single cropping cycle (later in wet season) laid out next to the area of the first trial (Trial 1).
The trial 1 was composed of different rates of fermented Costus Afer aqueous extracts: five (5) rates (0, 166.66, 333.33, 499.98 and 666.66 liters/ha) were applied in complete randomized blocks design with three replications and the rice variety VA6 was transplanted (20 cm × 20 cm) after 21 days of nursery duration. Treatments were coded as T0, T1, T2, T3, T4 and T5 respectively and applied as basal while the treatment T4 was splited (166.66 l/ha) during tillage and further during the tillering stage and boosting periods of rice. This experiment was conducted during three successive cropping cycles.
Trial 2 was conducted during single cropping cycle using blank (T0) and conventional treatment (T6) as controls in addition to the defined treatments of Costus extracts during the Trial 1. NPK-fertilizer (12-11-18) was applied as basal (150 kgha-1) and urea (80 kgNha-1) was splited equally for application during rice tillering and boosting stages respectively.
Data Collection
Soil Sampling
Core soil sample was collected in the center of experiment site using PVC tube before tillage as non-disturbed soil sample in the manner to observed morphopedological traits. After the harvest, soil samples were collected in each micro- plot using augur (0 – 20 cm) for soil biology screening and pH trend according to the treatment. Latest soil samples were also used to determine soil structural stability.
Agronomic Data
The harvest was done in 8m2 leaving two sowing rows of border each side. After sun drying, straw and grain were separated and the grains were sieved before oven-dried (70˚C) during 24 hours for determination of moisture content (M). After weighing of dried straw and grains, rice grain yield (GY) was calculated with moisture adjustment to 14%:
GY (t/ha) = [dried weigh of grain (kg)/ 8m2] × (10000/1000) × [(100-M)/86] [1]
Soil Structure Stability Index
Dried mottle of sampled soil was weighed (M) and put on 2mm mesh of sieve before immersion into fuole of water during 15mn. This assembly was submitted to checking during immersion. Fine (< 2mm) particles detached were sedimented in the bottom of the fuole. Then after, water was submitted to filtration for sediment collection using filter paper and sundried before weighing (m). Soil structural stability index (SS) was calculated as bellow:
SS(%)=(M-m)/M x100 [2]
The process was done by checking and non-checking the sieve; these measures were done for each treatment during the three cropping cycles of rice.
Soil Biology and Acidity Assessments
Macroscopic observation was done to estimate soil richness in macro-fauna using a sub-sample from the composite soil sample taken before setting the first experiment (3 cropping cycle).
Sub-sample of dried soil (100g) was also taken after experimentation to be mixed in water using a test tube. After decantation, a drop was observed using microscope (60×0.80) with incorporated picture processer. Microbes were identified according to morphology shape [19]. Furthermore, bacterial biomass were enumerated in nutrient broth (NB) medium [20, 21]. Elementary soil samples were taken by micro-plot of treatment at rice maturity period. Sub-sample of 100g was put into 250cc of water for pH determination using glass measurement method.
Profitability Assessment
The second trial was set up with two control plots (T0 and T6) especially for economical purpose. Inputs (bio- and chemical fertilizer) purchasing costs and paddy rice selling price (200 FCFA/kg) were considered to calculate the profit induced by treatment. Then after, the net Gain of bio-fertilizer practice was revealed when comparing the profit with that of chemical fertilizer practice respectively. By comparison, the threshold level of Costus Afer net gain was known when comparing the gain with that of the blank control treatment (T0).
Statistical Analysis
The mean values of rice grain yield were determined by descriptive and analysis of variance according to the treatments or cropping cycle. One way analysis of variance was also performed for comparison of soil structure stability (SS) according to cropping and treatment respectively. Mixed model analysis was performed for processing t-test analysis of rice grain yield mean values when considering birds’ damages as random factor.
Results
Cropping Cycle Effects on Rice Yield
Mean values of harvested rice grain yield is presented in table 1 for each treatment according to rice cropping cycles. Significant effect of cropping cycle is observed for treatment-T4 when poor significance occurred with T5 considering α = 0.10. Indeed, high variability of treatment effect is observed according to the coefficient of variation (CV) while it is lowest for the control. Roughly, the third cropping cycle recorded the lowest grain yield (5 – 2 tha-1).
| Rice grain yield (tha-1) | ||||||
|---|---|---|---|---|---|---|
| T0 | T1 | T2 | T3 | T4 | T5 | |
| Cycle 1 | 5.12a | 6.80a | 6.21a | 7.0a | 6.67a | 7.63a |
| Cycle 2 | 9.36a | 8.37a | 7.83a | 7.4a | 5.71a | 7.18a |
| Cycle 3 | 3.56a | 3.41a | 2.57a | 5.0a | 2.21a | 2.67a |
| CV(%) | 2.41 | 41.25 | 76.94 | 25.10 | 38.28 | 40.60 |
| Pr<F | 0.46 | 0.13 | 0.18 | 0.23 | 0.05 | 0.08 |
Table 3: Mean value of rice grain yield by treatment according to cropping cycles during the trial1.
There is also high variability of rice grain yield (6.80 – 1.00 t/ha) across the both trials according to the treatments. Lowest grain yields (1.00 – 2.30 tha-1) are noted for the trial 2 (Table 4).
| Grain yield (tha-1) | ||
|---|---|---|
| Mean for the three cycles of trial 1 (n = 9) | Mean for the single cycle of trial 2 (n = 3) | |
| T0-Blank control | 6.00 (± 0.13) | 1.30 (± 0.71) |
| T1 | 6.20 (± 0.41) | 1.20 (± 0.30) |
| T2 | 6.80 (± 0.20) | 1.00 (± 0.19) |
| T3 | 6.50 (± 0.18) | 1.40 (± 0.21) |
| T4 | 4.80 (± 0.16) | 1.40 (± 0.17) |
| T5 | 5.80 (± 0.30) | 1.50 (± 0.25) |
| T6-Conventional | ----- | 2.30 (± 0.21) |
Table 4: Rice grain yield mean values and error types by trial according to the treatments.
------: Missing data; (±…): Error type Table 4: Rice grain yield mean values and error types by trial according to the treatments.
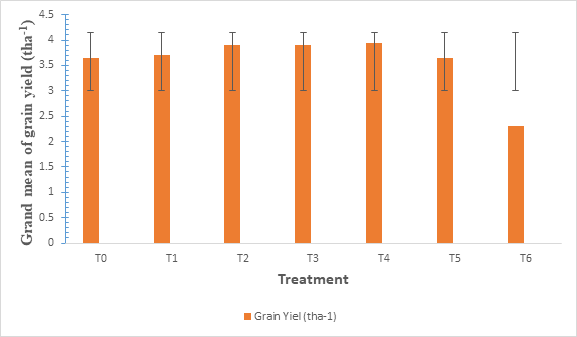
Average of rice grain yields recorded during trial 1 and trial 2 as grand mean values are presented in figure 1: there is high variability of rice grain yield (6.80 – 1.00 t/ha) according to the treatments across the both trials. Lowest grain yields (1.00 – 2.30 tha-1) account for the trial 2. Average of rice grain yields recorded during trial 1 and trial 2 as grand mean values are presented in figure 1: there is relative stable yield (3.1 – 3.90 tha-1) under bio-fertilizer effect during trial 1 overlapping the lowest value of 2.30 tha-
1 for the conventional-T6 (control) fertilizer option during the trial 2 (Figure 1). Chemical fertilizer effect (T6) is also low than that of blank treatment (T0) of trial 1 while twice lowers than the conventional during trial 2.
Although no significant difference is observed between the yields obtained under bio-fertilizer effect and that of the blank treatment (control), they are recording almost 1/3 higher yield than the chemical fertilizer treatment.
Profit Assessment of Applied Treatments
Yield differences between the effect of T6 (chemical fertilizer) and the other treatments during the trial 2 is presented is Table 5. There is significantly about 1 tha-1 of grain yield as profit when applying chemical fertilizer compared to the control and bio-fertilizer treatments respectively. But lowest differences (< 1 tha-1) are observed for the highest rates of bio-fertilizer (T3, T4 and T5).
| Ti - T6 | Yield difference (tha-1) | Probability > ׀t׀ |
|---|---|---|
| T0-T6 | -1.02 | 0.0222 |
| T1-T6 | -1.08 | 0.0187 |
| T2-T6 | -1.27 | 0.0037 |
| T3-T6 | -0.96 | 0.0325 |
| T4-T6 | -0.91 | 0.0258 |
| T5-T6 | -0.84 | 0.053 |
Table 5: Significant yield gap between the fertilizer treatment (T6) and the others (Ti: T0, T1, T2, T3, T4 and T5) during trial
The Table 6 is showing agro-economic data according to applied treatments during the trial 2 the coast of fertilizer, rice yield and income after selling.
| Treatment | Purchase (CFA/ha) | Yield (tha-1) | Income (CFA/ha) | Profit (CFA/ha) |
|---|---|---|---|---|
| T0 | 0 | 1.28 | 256940 | 256940 |
| T1 | 0 | 1.23 | 245880 | 245880 |
| T2 | 0 | 1.03 | 206760 | 206760 |
| T3 | 0 | 1.35 | 270400 | 270400 |
| T4 | 0 | 1.40 | 279980 | 279980 |
| T5 | 0 | 1.47 | 293500 | 293500 |
| T6 | 298 000 | 2.31 | 461620 | 163620 |
Table 6: Agro-economical parameters of applied treatments during the trial 2.
In spite of more rice grain yield (2.31 tha-1) as induced by chemical fertilizer (T6) than that of the blank control (1.28 tha-1) and the different rates of Costus Afer extract, its ‘profit (163620 FCFA/ha) is almost twice lower especially, when compared to that induced by T5 (293500 FCFA/ha). The threshold level of Costus profitability is observed for T3 (270400 FCFA/ha) when comparing with the profit (256940 FCFA) recorded for the control with blank treatment (T0).
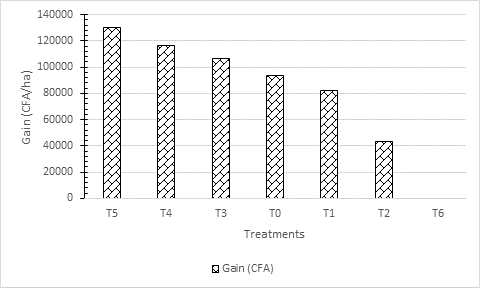
More evidences of economic performance of Costus extract are highlighted in figure 2 showing the gain while referring to chemical fertilizer (T6) practice: lowest gains are recorded for the lowest rates of Costus (T1 and T2) when compared to the blank treatment (T0). There is an increasing trend of the gain across T3, T4 and T5 in that order. The gains are ranging between (100 – 120 000 FCFA/ha) for a cropping cycle. Single application of Costus (T5) look likes better than split rates (666.66 l/ha-1) as done with T4.
Soil Characterization
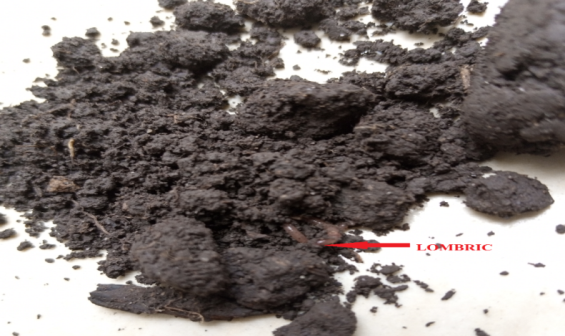
Macro observation of soil sample (Figure 3) reveals aggregated mottles and vegetal debris guesting a lombric (earthworm).
Microscopic observations of the soil solutions (Figure 4) show no identifiable matter in the soil solution relevant to the control treatment after the trial 1. In contrast, diverse
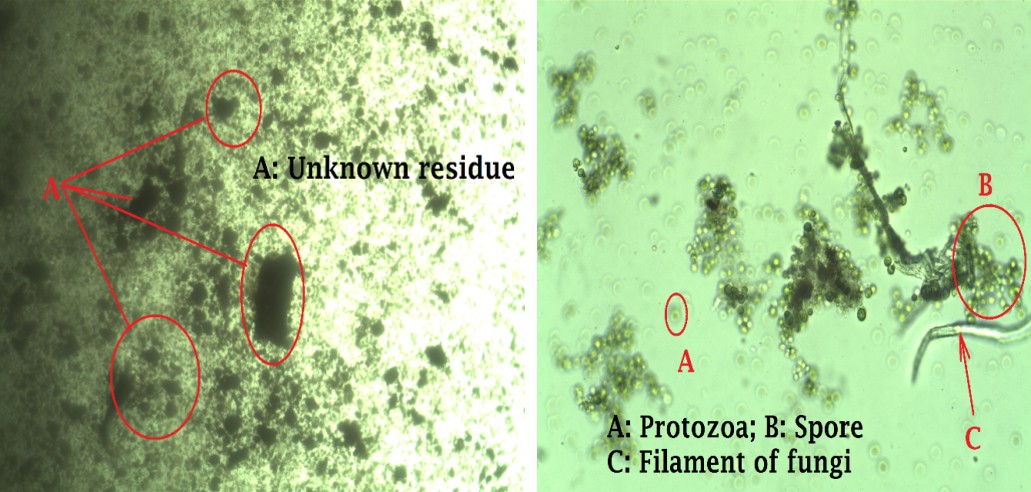
Blank treatment (T0) Costus treatment (T3) Figure 4: Pictures of soil solution according to control treatment (blank-T0) and Costus treatment (e.g. T3) after experiment of trial1.
Further analysis highlights the existence of bacteria as presented in table 6: roughly, UFC parameter is decreasing with the increase of the rate of Costus extract but, lowest values account for T4 and T6 (conventional practice).
organisms composed of protozoa, spore and fungi are recognized in that of bio-fertilizer treatment as presented for treatment (T3).
| Treatment | Number (×106) of bacteria/g of soil | Colony Forming Unit/g of soil |
|---|---|---|
| T0 | 366d | 455 |
| T1 | 2.24g | 118 |
| T2 | 18800b | 6 |
| T3 | 9.52f | 5 |
| T4 | 20400a | 4 |
| T5 | 1020c | 5 |
| T6 | 164e | 4 |
| Prob.> F | 0.001 | Single determination |
Table 7: Soil stability index for the plots of treatments according to the cropping cycles of trial 1.
Letter a, b, c, d, e, f and g are indicating mean values with significant difference. Table 6: Bacteria accounting in soil solution after the trial 2.
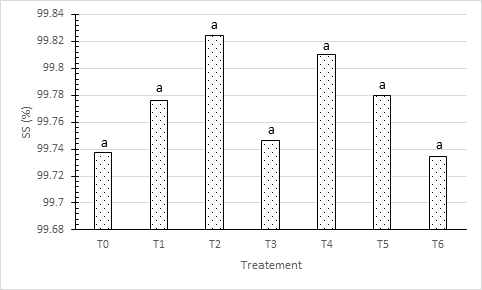
Cropping cycle effect on soil structure stability is presented in table 7 across the applied treatments.
| T0 | T1 | T2 | T3 | T4 | T5 | |
|---|---|---|---|---|---|---|
| Cycle 1 | 86.59b | 90.41b | 87.59b | 86.71b | 87.71b | 91.38c |
| Cycle 2 | 99.75a | 99.78a | 99.47a | 99.54a | 99.66a | 99.66a |
| Cycle 3 | 97.20a | 99.02a | 97.01a | 97.23a | 97.47a | 97.05b |
| Mean | 94.51 | 96.40 | 94.69 | 94.49 | 95.00 | 96.03 |
| Pr<F | <.0001 | <.0001 | 0.0006 | 0.0003 | <.0001 | <.0001 |
Table 8: Soil stability index for the plots of treatments according to the cropping cycles of trial 1.
Letters a and b are indicating the mean values with significant difference. There is significant effect of cropping cycle on soil structure stability index whatever the treatment. Lowest values are observed for the first cropping cycle while, increasing trend is roughly observed (mean values) with the increasing rate of Costus Afer extract. Figure 5 further reveals that lowest values of soil stability rate may account for the control plots (T0 and T6) in some extend as recorded for the first cropping cycle.
The mean values of soil pH are presented in figure 6 according to applied treatments during the trial 2.
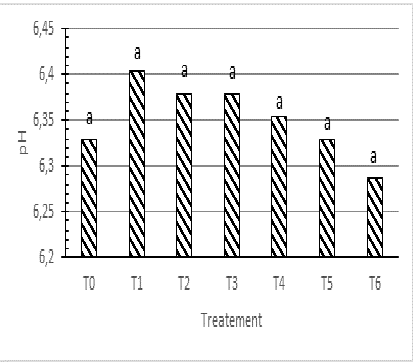
There is a decreasing trend of soil pH according to the increasing rate of Costus Afer although no significant difference is observed. Nevertheless, a unit value of pH can be observed between the records when referring to bio- fertilizer treatments and both controls, especially, when considering the chemical fertilizer effect.
Discussion
Peat Land Potential Fertility
The studied soil was Histosol with acidic (4.2) characteristic and high contents of N (2.2 gkg-1), P (201ppm) and K (0.45 cmolkg-1) in addition to the holistic greater content of organic carbon (45.42 gkg-1) known for such ecology. On this basis, we might expect a yield ranging from 5 – 8 tha-1 using high potential yielding rice variety (8 – 10 tha-1) without fertilizer according to a sound simulation model as QUEFTS (Quantitative Evaluation of the Fertility of Tropical Soils) released by Janssen [22]. Excepted for T4 (4.80 tha-1), the yields recorded during the trial 1 were about 6 tha-1 in line with this simulation. However, lowest yields (1 – 2.3 tha-1) were recorded during the trial 2. The yield gap observed between booth trials may be a consequence of crop management (flooding, weeding, soil levelling, birds’ damage) during the second trial although, birds’ damage was considered as random factor (mixed model). Over the potential of crop production in the studied peat land, lombric was observed as macro-organism well known as architect of soil Barrios [23] when no microorganism was clearly identified in soil solution of blank treatment as control (T0). Due to lombric contribution to soil nutrient stock building, there is evident justification of the level of yield observed for the blank control compared to that of other treatments especially during the trial 1. One major concern with the potential fertility of the studied peat land is the high content of P (201 ppm) ranging over the concentration of 0.01 – 1 ppm recorded in the solution of most agricultural soils [24]. Therefore, applying phosphorus to such peat land for agriculture is unlikely as recommended early by Olsen and Dean [25, 26, 27]. Nevertheless, this presumption will gain more sense while exploring phosphorus uptake rate by crop in this agroecology.
Bio-Fertilizer Aptitude of Costus Afer
There is consensual view of researchers (Lal [26]; Pieri [28]; Sanchez [29]; Lompo [30] regarding to organic matter ability to build up soil fertility in Africa. The study completed by Zadi [30] further confirmed this option specifically, for lowland soils (Fluvisols) by incorporating rice straw. But, this practice is limited in Africa because of the shortage of annual amount (95 000 000 tones) of raw material Kossila [31] to fit the need of 12 tha-1 as optimum. Even rice straw composting [N (1 gkg-1), K (2.3 gkg-1), Ca (2.1 gkg-1) and P (1 gkg-1)] was explored by Traore [32] with limited success because of high completion of bacteria for nutrient bio-availability to crop. Therefore, nutrient availability in bio-fertilizer is supporting its potential as a promising option for crop production.
Indeed, Costus aqueous extract as solution may lift the issue of high quantity of raw material to be transported and applied in the field, knowing that, the concentrations of nutrients in the solution is relative to the amount of raw material. In addition, no bio-geo-chemical process is required for nutrients availability to crop as necessary for compost mineralization [33].
Meïte (2018) previously characterized major nutrient concentrations in the aqueous solution of the local Costus Afer (2.06 g N/l ; 71 g P/l and 1.16 g K/l) and Yoboue [17] tested its performance with industrial bio-fertilizer (Polifol) as well as chemical fertilizer (NPK+Urea): no significant difference was observed between the grain yields recorded respectively during a single cropping cycle. During the current study, flooding (irrigation) variability may have influenced nutrient concentrations for rice nutrition and affecting uptake process Claassen and Barber [34] and, thereby, nutrient use efficiency. There is more evidence of this explanation of yield variability especially between trial 1 (early in wet season) and trial 2 (later in wet season). Highest flooding occurred at the end of the wet season may have reduced nutrient uptake and consequently, the rice yield during the trial 2. In this line, there was roughly a decreasing trend of rice grain yield across cropping cycles as often observed under conventional fertilizer practice [35]. Nevertheless, the decreasing of yield under Costus supplying was not much significant as observed under chemical fertilizer practice. Therefore, the application of aqueous extract of Costus Afer may induce more stable rice grain yield than conventional practice for sustainable rice production [36]. Also, a single application of Costus (T5) look likes better than split rates (666.66 l/ha-1) as done for treatment- T4. However, further study should tackle this issue for intensification of rice production with regard to Costus Afer promotion.
Soil Regeneration Aptitude of Costus Afer
After the study, macro-fauna was not observed in soil as observed (Lombric) before the experiment. The change induced by soil tillage applied before rice transplantation and inevitable compaction during crop management may explain this contrast regarding to land disturbance effect on lombric occurrence [37]. This result emphasized the importance of soil mechanical properties over its chemical for lumbric occurrence: in spite of soil-pH ranging closely to the optimum (6.3 – 6.4) according to the scale (6.5 – 8.6) defined by Jicong [38], no earthworm was observed in soil 0 – 20 cm depth. In contrast, highest biodiversity (protozoa, bacteria and fungi) was observed in topsoil after the trial 1 as much as illustrated for the treatment T3. Indeed, change in earthworm cast was early described by Degens [39] justifying the assumption that endogenic species may be found in deepest horizon. This assumption is supporting continuous development of the studied soil regarding the effect of endogenic earthworm on vegetation residues limiting the depth of Histosol. Overall, there is experimental evidence of bacteria, algae, protozoa and fungi as sources of nutrients for earthworms Kizilkaya [40] underlining the fact that the topsoil (0 – 20 cm) of the studied area was favorable to lumbric occurrence. Therefore, aqueous extract of Costus may have improved soil living matter giving chance to soil regeneration.
Sustainability of Costus Afer Bio-Fertlization
Over the evidence of soil regeneration aptitude of aqueous extract of Costus Afer, the practice looks like to sustain soil microbiology living period and economical profitability. Indeed, bacteria population Colony Forming Unit (CFU) was optimum for T2 (18800×106) and T4 (20400×106) over that of T6 (conventional check) and blank control (455). Nevertheless, there is inconsistency between the respective trends of the booth studied biological parameters: some bacteria could be inside fine particles (2 – 20 µm) as missing measurement according to Marshall [41]. Whatever the case, we can assert existence of a stock of living mater Cundell [42] especially as supplemental bacteria (CFU) during the current test. In this line, there is evidence of better effect of Costus treatment on soil bacteria occurrence than the chemical treatment which was also characterized by twice lower number (164× 106) of bacteria than that (366×106) of the blank control (Histosol) [43]. Over all, there was tendency for more structural stability of soil under Costus Afer extract practice than booth controls used during the current study. More yield stability (6 – 5tha-1) across cropping cycles was characterizing this innovation and slight yield differences (≈ 1tha-1) were observed as induced by fertilizer practice against the effect of Costus Afer in a reducing trend from the threshold rate of T3. Consequently, there was more profitability of Costus application at minimum rate as T3 (270400 FCFA/ha) when comparing with the profit (256940 FCFA/ha) recorded for the control with blank treatment (T0) almost twice higher than that of fertilizer practice [44]. Local raw material used for aqueous extraction is supporting this results whatever the evidence need to determine the optimum rate for recommendation. Further study should handle this issue exploring greater rate of Costus than T5 (666.66 liters/ha) currently applied.
Conclusion
The current study emphasized a potential of Costus Afer to regenerate the studied Histosol (Peat land) especially, for the applied rates ranging between T2 and T4 resulting more structural stability and bacteria occurrence in soil in addition to protozoa, spore and fungi in topsoil while endogenic earthworm could existed. High variability of rice grain yield (1 – 6 tha-1) was observed while looking like stable across successive cropping cycles with a net benefit of 100 – 120 000 FCFA/ha during a cropping cycle. Therefore, Costus Afer aqueous extract can be considered as a suitable alternative input for sustainable rice production with soil regeneration option.
References
-
Bodirsky BL, Rolinski S, Biewald A, Weindl I, Popp A, et al. (2015) Global food demand scenarios for the 21st century. Plos One 10: e01329201.
-
IRRI (2000) Rice. Chapter 4: Climate requirement, pp: 5-21.
-
Clark MA, Domingo NGG, Colgan K, Thakrar SK, Tilman D, et al. (2020) Global food system emissions could preclude achieving the 1.5° and 2°C climate change targets. Science 370(6517): 705-708.
-
Dossou-Yovo ER, Vandamme E, Dieng I, Johnson JM, Saitoa K, et al. (2020) Decomposing rice yield gaps into efficiency, resource and technology yield gaps in sub- Saharan Africa. Field Crops Research 258: 107963.
-
Flessa H, Ruser R, Dörsch P, Kamp T, Jimenez MA, et al. (2002) Integrated evaluation of greenhouse gas emissions (CO2 , CH4 , N2 O) from two farming systems in southern Germany. Agriculture Ecosystems and Environment 91(1-3): 175-189.
-
Carrijo DR, Akbar N, Reis AFB, Li C, Gaudin ACM, et al. (2018) Impacts of variable soil drying in alternate wetting and drying rice systems on yields, grain arsenic concentration and soil moisture dynamics. F Crop Res 222: 101-110.
-
Legros JP (2007) Les grands sols du monde 1st (Edn.), EPFL Press, Amazone, France, pp : 574.
-
Attanandana T, Chakranon B, Kyuma K, Moncharoen P (1999) Improvement of a Peat soil for rice cultivation in Thailand. Jpn J Trop Agr 43(2): 91-96.
-
Agus F (2008) Envionmental risks of farming on Peat land. 61 – 74pp, International Workshop on Post Tsunami Soil Management, 1-2 july 2008 in Bogor, Indonesia.
-
Bastoni IB, Sari ENN, Hadi EE, Hengki A, Rizky S, et al. (2020) Progress of paludiculture projects in supporting peatlandecosystem restoration in Indonesia. Global Ecology and Conservation 23: e01084.
-
Bissonnais YL (1996) Aggregate stability and assessment of crustability and erodibility: I. Theory and methodology. European Journal of Soil Science 47(4): 425-437.
-
Golchin A, Oades JM, Skjemstad JO, Clarke P (1994) Soil structure and carbon cycling. Australian Journal of Soil Research 32(5): 1043-1068.
-
Rhodes CJ (2017) The imperative for regenerative agriculture. Sci Prog 100(1): 80-129.
-
Fruchart S (2016) Efficacy trials of different biofertilizers on spring barley (Hordeum vulgare) and natural grassland. Plant biology and technology. Universite angers, France, pp : 72.
-
Tian G, Kang BT, Brussard L (1992) Effect of chemical composition on N, Ca and Mg release during incubation of leaves from selected agroforestry and fallow plant species. Biogeochemistry 16: 103-119.
-
Anyasor GN, Onajobi FD, Osilesi O, Adebawo O (2014) Proximate composition, mineral content and in vitro antioxidant activity of leaf and stem of _Costus Afer_ (Ginger lily). J Intercult Ethnopharmacol 3(3): 128-134.
-
Yoboue DD (2020) Effet de diverses fumures en riziculture. Master II, Universite Felix Houphouët- Boigny, Cocody, Abidjan, pp: 70.
-
Meite B (2018) Activites biofertilisantes d’extraits acqueux de _Costus Afer_ sur la croissance et le developpement du riz (_Oryza sp_.) en Côte d’Ivoire. Memoire de Master II, PAD, UFR-STRM, Universite Felix Houphouët-Boigny.
-
Yvon D (2001) « SOLS **-** Microbiolo- gie », _Encyclopædia Universalis._
-
Bongoua-Devisme AJ, Cebron A, Kassin KE, Yoro GR, Mustin C, et al. (2013) Microbial Communities Involved in Fe Reduction and Mobility During Soil Organic Matter (SOM) Mineralization in Two Contrasted Paddy Soils. Geomicrobiology Journal 30(4): 347-361.
-
Frostegård Å, Bååth E (1996) The use of phospholipid fatty acid analysis to estimate bacterial and fungal biomass in soil. Biol Fert Soils 22 : 59-65.
-
Janssen BH, Guiking FCT, van der Eijk D, Smaling EMA, Wolf J, et al. (1990) A system for quantitative evaluation of the fertility of tropical soils (QUEFTS). Geoderma 46(4): 299- 318.
-
Barrios E (2007) Soil biota, ecosystem services and land productivity. Ecological Economics 64(2): 269-285.
-
Donahue SJ, Heckendorn SE (1994) Soil test recommendations for Virginia. Virginia Cooperative Extension, Virginia Tech, Blacksburg, USA, pp: 111.
-
_Olsen_ SR, _Dean_ LR (_1965)_ Phosphorus. In Methods of Soil Analysis, American Society of Agronomy, Madison, Wisconsin 9: 920-926.
-
Lal R, Hall GF, Miller FP (1989) Soil degradation: I. Basic processes. Land Degradation and Development 1(1): 51- 69.
-
Pieri C (1989) Fertility of savannah lands. Assessment of thirty years of agricultural research and development in the South of the Sahara. Montpellier, CIRAD-IRAT, pp: 452.
-
Sanchez YPA, Shepherd KD, Soule MJ, Place FM, Buresh MJ, et al. (2003) Effects of earthworms on plant growth: patterns and perspectives. Pedobiologia 47(5-6): 846- 856.
-
Lompo F, Segda Z, Gnankambary Z, Ouandaogo N (2009) Influence des phosphates naturels sur la qualite et la bio-degradation d’un compost de pailles de maïs. Tropicultura pp: 105-109.
-
Zadi F, Kone B, Gala Bi TJ, Akassimadou EF, Konan KF, et al. (2014) Lowland Rice Yield as Affected by Straw Incorporation and Inorganic Fertilizer Over Cropping Seasons in Fluvisol. Journal of Advances in Agriculture 3(1): 129-141.
-
Kossila V (1988) The availability of crop residues in developing countries in relation to livestock populations, pp: 29-39.
-
Traore M (2018) Activation du compostage de la paille du riz par effet du phosphate. Memoire de Master, Universite Felix Houphouët-Boigny, pp : 95.
-
Tuomela M, Vikman M, Hatakka A, Itavaara M (2000) Biodegradation of lignin in acompost environment: a review. Bioresource Technol 72(2): 169-183.
-
Claassen N, Barber SA (1976) Simulation Model for nutrient uptake from soil by a growing root system. Agronony Journal 68(6): 961-964.
-
Kone B, Konan KF, Kouame NR (2018) Diagnostic of Mineral Deficiencies and Interactions in Upland Rice Cropping Across Different Agroecologies of West Africa. In: Bationo A, et al. (Eds.), Improving the Profitability, Sustainability and Efficiency of Nutrients Through Site Specific Fertilizer Recommendations in West Africa Agro-Ecosystems. Springer, Cham, pp: 81-92.
-
Kone B (2014) Sustaining rice production in Tropical Africa: Coping with rice yield gape and declining yield. Lap Lambert Publishing, pp: 223.
-
Bouche MB (1977) Strategies lombriciennes. In: Lohm, U. and Persson, T. eds. “Soil organisms as components of ecosystems.” Ecological Bulletin (Stockholm) 25: 122- 132.
-
Jicong H, Yanyun O, Guangqing L, Dong R (2005) The Influence of Temperature, pH and C/N Ratio on the Growth and Survival of Earthworms in Municipal Solid Waste. Agricultural Engineering International: the CIGR Ejournal. Manuscript FP 7: 1-6.
-
Degens BP (1997) The contribution of carbohydrate C and earthworm activity to the water stable aggregation of a sandy soil. Aust J Soil Res 35(1): 61-71.
-
Kizilkaya K, Tait RG, Garrick DJ, Fernando RL, Reecy JM (2011) Whole genome analysis of infectious bovine keratoconjunctivitis in Angus cattle using Bayesian threshold models. Bmc Proceedings 5(4): S22.
-
Marshall KC (1976) Interfaces in Microbial Ecology. Harvard Univ. Press, Cambridge MA.
-
Cundell T (2011) The limitations of the colony-forming unit in microbiology. Microbiological Consulting LLC.
-
Botinelli N, Angers DA, Hallaire V, Michot D, Le Guillou C, et al. (2017) Tillage and fertilization practices affect soil aggregate stability in a humic Cambisol of Northwest France. Soil and Tillage Research 170: 14-17.
-
Mokwunye AU (1997) Analysis of budding yeast kinases controlled by DNA damage: Methods Enzymol, pp: 283.
- Lessons to Learn: Trees are More than the Lungs of the World
- Community Forestry Enterprises as a Model for Sustainable Forest Development: The Case Of The "Baja Tarahumara" in Chihuahua, Mexico
- Ecological and Socio-Economic Impacts of Chromolaena odorata and Mesosphaerum suaveolens, Two Invasive Alien Species in Central and Southern Benin, West Africa
- Epigenetic Sustainability: Modeling the Human Factor as a Natural Resource through Science 4.0 and the NR3C1 Biological Pilot
- Growth-at-Risk: A Framework for Assessing Economic Vulnerability
- The Rural Territory as a Socioecological System for the Management of Public Policy for Sustainable Rural Development