An Assessment of the Ecotoxicological Effects of Deltamethrin and Cypermethrin Using the Microbial Assay for Risk Assessment (Mara)
Rapid microscale toxicity test makes it possible to screen large numbers of compounds. This test greatly simplifies toxicity identification, evaluation, and other effect directed to chemical analyses of environmental samples. The microbial assay for risk assessment (MARA) is a24 hour multi-species test that seeks to address this problem by using a battery of ten bacteria and yeast. There has been little independent evaluation of this test, and no published information on its sensitivity to pyrethroid insecticides. A series of Microbial assay for risk assessment (MARA) was carried out to assess the effect of deltamethrin and cypermethrin; two synthetic pyrethroid insecticides. Results obtained indicate cypermethrin and deltamethrin were non- toxic to most of the microorganisms at environmentally relevant concentrations. However, two microorganisms were sensitive to the two insecticides indicating application of these insecticides at the recommended concentrations may be modifying the microbial community by inhibiting the growth of sensitive microorganisms, and enhancing that of tolerant ones. Our results also show a similar toxicity pattern from the MARA test for both insecticides. Showing there is a potential for establishing a toxicity fingerprint for pyrethroid insecticides with more research. The results obtained from this research confirm the fact that species sensitivities to pesticides are different; therefore, for a better protection of the aquatic environment and all its resources, information is needed on the sensitivities of a wide range of species at different trophic levels.
Tankie Placid F*, Patricia BA Fai, Demefack Zookem JM, Tankie Honorine N and Tankie Quinta
Introduction
The use of biological organisms is vital in the measurement and the evaluation of the potential impact of contaminants. Ecotoxicity tests (or bioassays) have been developed to characterize the toxicity of individual chemicals [1, 2]. Bioassays use biological systems to detect toxic chemicals or toxicants in environmental samples. A selected species provides a response considered to be representative of organisms indigenous to the environment potentially of concern [3]. The development of short-term bioassays to screen samples/chemicals came about with the realization that analysis of environmental samples for all suspected chemicals can prove very time-consuming and expensive [4]. With the use of the bioassays, chemicals, samples or sampling areas can be prioritized after assessment, providing an indication of acute toxicity, genotoxicity or chronic effects [5, 4]. An aquatic toxicity test (or bioassay) is a procedure in which the responses of aquatic organisms are used to detect or measure the presence or effect of use on one or more substances, wastes, or environmental factors, alone or in combination [6]. Toxicity tests are classified according to duration (short-term, intermediate-term, and/or long- term); method of adding test solutions (static, renewal, or flow through); and purpose (effluent quality monitoring, single compound testing, relative toxicity, relative sensitivity, taste or odour, or growth rate, etc) [6].
Species exhibit differences in sensitivity to chemicals. Although single species bioassays are highly replicable, they do not incorporate interactions that occur in natural systems [1, 7]. Therefore for routine screening, a battery of rapid, inexpensive, small scale bioassays at different trophic levels would be useful as an efficient and essential tool for predicting environmental hazards to the aquatic ecosystem [1, 5]. The use of a multiple strain assay, using metabolically and genetically diverse bacteria could potentially provide a much more accurate and appropriate tool for the screening of chemicals with unknown ecotoxicological properties [8]. The Microbial Assay for Risk Assessment (MARA) is a recently developed innovative and cost-effective 24 h multispecies test that allows the determination of toxicity of chemicals and environmental samples [8, 2]. Because of the newness of this bioassay its sensitivity to many important chemicals is still to be demonstrated. In addition, it is important to assess the test performance in the tropics as most of the results reported for MARA in the literature were obtained in temperate countries. The aim of this work was to assess the ability of the MARA to detect and assess the effects of two pyrethroid insecticides (Cypermethrin and Deltamethrin) commonly used by farmer in Cameroon.
Materials and Methods
Materials
All materials and equipment for the MARA test were obtained from the UK National Collection of Industrial, Food and Marine Bacteria (NCIMB, Bucksburn, Aberdeen) and consisted of MARA plates (containing lyophilised MARA microorganisms), microbial growth medium (Phytone peptone), Hp scanner7400c, dye (1% terazolium red solution) and MARA software. The insecticides, cypermethrin and deltamethrin are distributed by AFCOTT Cam Sarl, Garoua and SOPICAM, Douala respectively and were bought from a pesticide store in Dschang town (Cameroon).
Method
The MARA test was performed according to the standard protocol described by Wadhia [5]. In this work, the microbial species that were used consisted of ten bacterial species: Microbacterium sp., Brevundimonas diminuta, Citrobacter freundii, Comamonas testosterone, Enterococcus casseliflavus, Delftia acidovorans, Kurthia gibsonii, Staphylococcus warnerii, Pseudomonas aurantica, Serratia rubidaea, and one yeast species, Pichia anomalia.
Sample preparation
The cypermethrin formulation used contained 100g/l of the active ingredient in solution. The recommended dose of cypermethrin was 125mg/l. A stock solution of concentration 140mg/l was prepared since it was close to the recommended dose and could be prepared accurately from 100g/l of cypermethrin and it was used to make serial dilutions for all the MARA tests. For the MARA test 20ml was measured from the stock solution and 0.4g of phytone peptone was added to the sample. After dissolution of the solid medium, 0.2ml tetrazolium red (1% w/v solution) was added to the sample. In the case of deltamethrin, a formulation containing 25g/l of the active ingredient was used. The recommended dose of deltamethrin was 42mg/l. A stock solution of concentration 50mg/l was prepared from 25g/l of deltamethrin and this was used to make serial dilutions for all the MARA tests following the same procedure as for cypermethrin.
Plate preparation prior to sample testing
All plates were allowed to equilibrate for two hours to room temperature after removal from their protective packaging. A volume of 150µl of growth medium (Phytone peptone, 2% w/v) was added to each well containing the microorganisms (row H, columns 1–11, figure 1) and to the last well in row H, column 12 (The latter contained the freeze-dried base only and was used as a contamination control since it was treated with sample in the same way as the microorganisms in the plate. Any biomass observed in wells in column 12 was attributed to contamination). After the addition of growth medium, all plates were incubated for four hours at 30 ± 2oC in a sealed plastic container containing moist tissue paper to ensure that constant humidity was maintained. Three plates were used for each sampled tested, giving three replicates for each sample.
Sample dilution series
After pre-incubation the plates were removed from the incubator and 100µl of medium containing tetrazolium red (0.01% w/v) was added to each well in rows A–F. A volume of 150 µl of the prepared sample was added to the wells in row G. Using a 12 channel pipette, 50µl of sample was transferred from each well in row G to the corresponding well in row F. The contents of the wells in row F were mixed by filling and discharging the 12 channel pipette into the wells. After mixing, 50µl of the contents of the wells in row F were transferred to the wells in row E. This procedure was repeated to row B. The contents of the wells in row B were mixed as before and 50µl from each well in the row was discarded.
In implementing this procedure a concentration gradient (in 3x steps) was obtained from row G (highest concentration) to row B (lowest concentration). The concentrations gradient of deltamethrin and cypermethrin in the test ranged from 50mg/l and 140mg/l (in row G) to 0.21mg/l and 0.58mg/l (in row B) respectively. No sample was added to the wells in row A. This constituted the negative control. Using the above procedure a constant reaction volume of 100µl was obtained in all the wells in rows A–G.
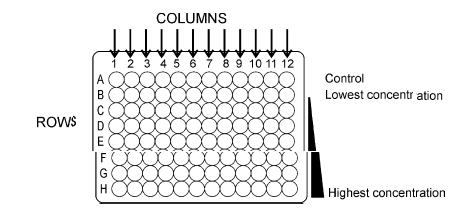
Figure 1: A schematic picture of a MARA plate. Eleven different microbial strains are lyophilised in a 96-well microplate, one strain in each of column 1–11 as indicated by the arrows. Column 12 is a control. The chemical to be tested for its toxicity is added to the pre-prepared plate in a concentration gradient, the highest concentration in row G and the lowest in row B. Row A is the negative control where the bacteria may grow without interference of the tested chemical.
Inoculatoin and incubation
Finally, 15µl was transferred, after mixing, from the wells in row H to the corresponding wells in row A, using a 12-channel pipette; this was repeated through rows B–G. This procedure ensured that all the wells in each column were inoculated with the same volume of the bacterial suspension. Each plate was then placed in a plastic container as before and incubated at 30±2°C for 18 hours.
Test measurements
After incubation, the plates were removed from the incubator. Any condensation on the base of the plates was carefully removed using tissue paper, care being taken not to shake the plates. Growth in the 96 wells on each plate was recorded (after removal of the lid) by means of a scanner (HP Scanner 7400c) using transmitted light and a resolution of 100. The scanned plate images were stored in Microsoft Excel files and subsequently analysed using a specially designed software package (MARA software Version 2.0.1) to determine, the microbial toxic concentration (MTC). Statistical Analysis Statistical analysis was done using the MARA software Version 2.0.1 and Microsoft Excel® with graphs plotted in Sigma Plot 2000. The MARA plate images were copied from the Excels files and loaded one at a time into the MARA software for analysis. The MARA software assigned numerical values to each well in the plate, which represented the amount of microbial growth. The software was also used to calculate the percentage growth and growth inhibition of micro-organisms in each well relative to the respective controls as well as microbial toxic concentration (MTC) values for each microorganism and an overall mean MTC for the 11 MARA organisms in the plate. The MTC was calculated using the MARA software according to the formula MTC= Cmin d(P tot/P o ) _ 1 Developed by Wadhia [5] where: Cmin = Lowest concentration in the gradient, Po= Pellet size in the control well, d= Dilution factor and Ptot= The sum of the pellet sizes in the all wells exposed to the concentration gradient of the chemical to be tested.
Where possible, the Excel™ macro called REGTOX, which models the dose–response relationship with the non-linear Hill equation (http://eric.vindimian.9online.fr/en_index. html) was used to calculate 50% inhibition concentration (IC50) for each MARA species which can be compared with the MARA MTCs values.
Results
The MARA system in the present study consists of an array of 11 microbial strains in a 96-well microplate that is exposed to a concentration gradient of a chemical to be tested (Figure 1).
a b
Cypermethrin MARA Results
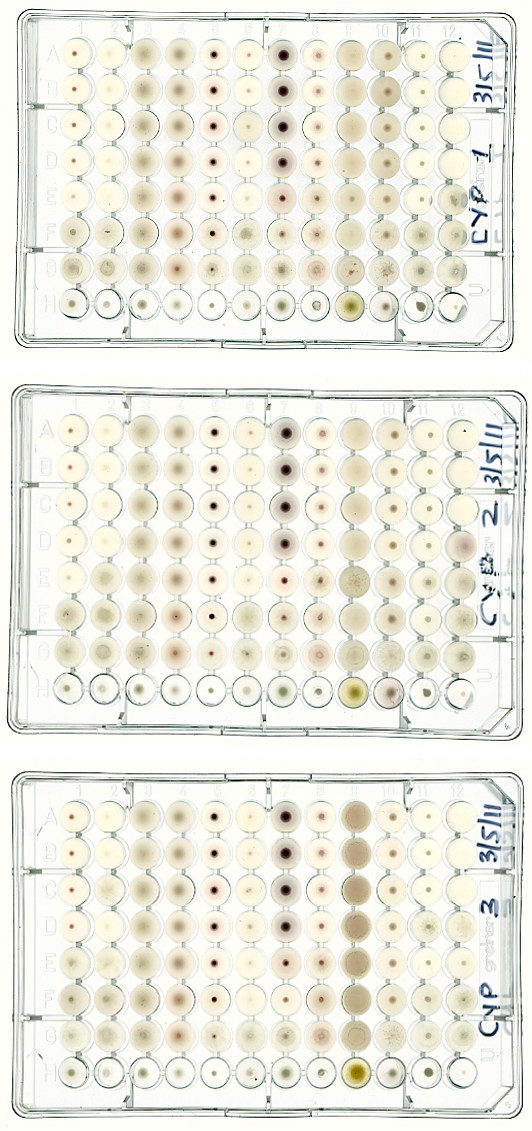
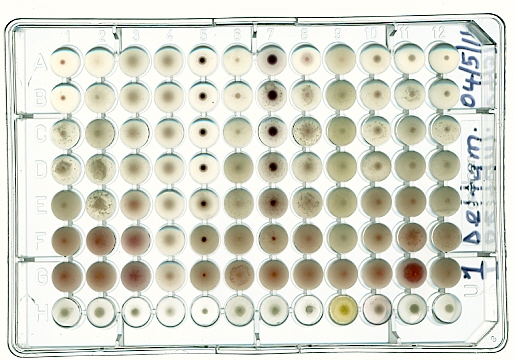
Figure 2 shows the Plate SCans for the three Replicates of Cypermethrin.
c Figure 2: Cypermethrin replicates scans (a: Replicate 1, b: Replicate 2 and c: Replicate 3).
It is clear from the three MARA scans for cypermethrin in figures 2 above that the test was replicable and from visual appreciation it seems that microorganism number 7 is affected since there is a clear reduction in the size of the pellets formed from row A (control) to G (highest concentration of cypermethrin). Some effect could also be seen on microorganism number 5 especially at the highest concentration. These plate images were introduced into the MARA software for analysis, and the following growth values were attributed to the different wells (Tables 1-3). It can be seen from the growth values that there was unsatisfactory growth even in the controls of some of the microorganisms (particularly number 1, 2, 3,6, 8 and 11). Therefore toxic effects on these microorganisms could not be assessed.
| SL. NO | 11 MARA microorganisms | Cypermethrin | |||||||||||
|---|---|---|---|---|---|---|---|---|---|---|---|---|---|
| Data | 1 | 2 | 3 | 4 | 5 | 6 | 7 | 8 | 9 | 10 | 11 | 12 | Conc.(mg/l) |
| A | 12 | 0 | 56 | 49 | 44 | 5 | 128 | 14 | 47 | 45 | 7 | 5 | 0 |
| B | 11 | 0 | 67 | 55 | 49 | 4 | 133 | 12 | 51 | 95 | 7 | 0 | 0.58 |
| C | 10 | 0 | 63 | 57 | 48 | 6 | 128 | 11 | 57 | 52 | 8 | 0 | 1.7 |
| D | 9 | 0 | 64 | 59 | 42 | 3 | 121 | 20 | 51 | 63 | 6 | 0 | 5.2 |
| E | 3 | 0 | 62 | 64 | 38 | 1 | 62 | 37 | 49 | 38 | 6 | 56 | 16 |
| F | 28 | 18 | 68 | 69 | 41 | 44 | 29 | 39 | 37 | 45 | 54 | 38 | 47 |
| G | 53 | 48 | 72 | 76 | 35 | 29 | 55 | 59 | 69 | 55 | 49 | 39 | 140 |
| H | 26 | 6 | 26 | 9 | 8 | 8 | 43 | 23 | 168 | 31 | 51 | 11 | |
| Data | 1 | 2 | 3 | 4 | 5 | 6 | 7 | 8 | 9 | 10 | 11 | 12 | Conc. (mg/l) |
| A | 9 | 1 | 47 | 40 | 48 | 7 | 109 | 21 | 35 | 23 | 11 | 12 | 0 |
| B | 8 | 0 | 42 | 42 | 47 | 4 | 123 | 17 | 33 | 27 | 15 | 12 | 0.58 |
| C | 7 | 0 | 54 | 50 | 48 | 3 | 119 | 18 | 48 | 30 | 15 | 8 | 1.7 |
| D | 8 | 0 | 61 | 54 | 44 | 3 | 110 | 15 | 51 | 24 | 9 | 50 | 5.2 |
| E | 2 | 32 | 54 | 57 | 39 | 2 | 33 | 46 | 108 | 47 | 22 | 35 | 16 |
| F | 46 | 53 | 59 | 66 | 31 | 33 | 36 | 32 | 50 | 53 | 9 | 48 | 47 |
| G | 32 | 40 | 64 | 69 | 18 | 27 | 33 | 50 | 75 | 37 | 39 | 58 | 140 |
| H | 25 | 23 | 35 | 21 | 20 | 23 | 53 | 27 | 186 | 73 | 32 | 3 |
Table 1: Growth values for MARA cypermethrin replicate 1 scan (note that row A is the test (positive) control; column 12 is the n
| SL. NO | 11 MARA microorganisms | Cypermethrin | |||||||||||
|---|---|---|---|---|---|---|---|---|---|---|---|---|---|
| Data | 1 | 2 | 3 | 4 | 5 | 6 | 7 | 8 | 9 | 10 | 11 | 12 | Conc. (mg/l) |
| A | 11 | 0 | 51 | 47 | 46 | 2 | 129 | 17 | 166 | 21 | 5 | 0 | 0 |
| B | 12 | 0 | 55 | 49 | 47 | 3 | 142 | 15 | 171 | 22 | 6 | 0 | 0.58 |
| C | 11 | 9 | 62 | 53 | 50 | 5 | 132 | 15 | 184 | 22 | 8 | 0 | 1.7 |
| D | 10 | 0 | 59 | 52 | 45 | 6 | 113 | 15 | 191 | 21 | 25 | 6 | 5.2 |
| E | 18 | 5 | 66 | 62 | 39 | 1 | 47 | 45 | 177 | 21 | 7 | 4 | 16 |
| F | 48 | 48 | 77 | 73 | 30 | 0 | 15 | 58 | 163 | 23 | 15 | 34 | 47 |
| G | 11 | 38 | 71 | 74 | 17 | 17 | 42 | 69 | 134 | 31 | 11 | 20 | 140 |
| H | 20 | 4 | 26 | 8 | 7 | 12 | 39 | 18 | 288 | 31 | 43 | 0 |
Table 2: Growth values for MARA Cypermethrin Replicate 3 scan.
However, the visual assessment of the effects on microorganism number 5 and 7 was confirmed by these growth values. For microorganism number 7 MTC values are shown on table 4.
| Plate | 1 | 2 | 3 |
|---|---|---|---|
| MTC | 19 | 16 | 12 |
| Mean MTC | 15.67± 3.5 |
Table 3: MARA MTC for microorganism number 7 (in mg/l).
Using statistical software (REGTOX) an IC50 value of 15.73mg/l was calculated with the 95% confidence intervals of 10 – 26.36 mg/l.
| Plate | 1 | 2 | 3 |
|---|---|---|---|
| MTC | 94 | 34 | 44 |
| Mean MTC | 57.33± 30.4 |
Table 4: MARA MTC for microorganism number 5 (in mg/l).
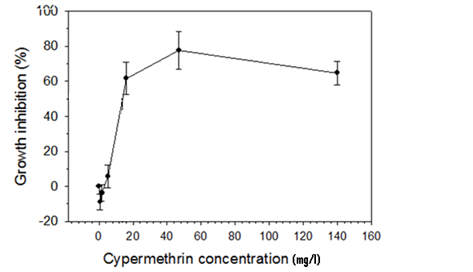
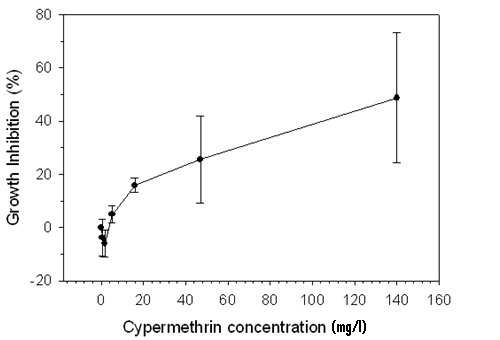
In the case of microorganism number 5 the calculated MTCs for the three replicates were more variable as evidenced by the high standard deviation (SD) as shown on table 5. Making it impossible to obtained valid IC50 with REGTOX In this case MTC and IC50 results calculated from the two softwares agreed with each other. The MARA growth values can also be used to present the results as a dose-response curve (Figures 3 & 4).
Deltamethrin MARA Results
Figure 5 shows scan images of MARA results for deltamethrin. Visual inspection reveals a similar pattern
a b
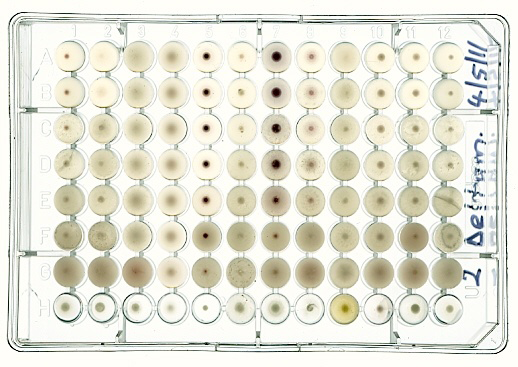
as for cypermethrin with microorganism number 5 and 7 showing prominently as the only organisms affected.
However, unlike for cypermethrin, the growth values (Tables 6-8) allocated by the MARA software did follow this observation. This was because the deltamethrin solution became very cloudy when water was added to it during preparation of the various test concentrations and the degree of cloudiness increased with increasing deltamethrin concentrations. As a result, the pellets formed were overshadowed and the software could not differentiate the cloudy colour from the pellet formation. This is obvious when looking at column 12 (negative control) in all three images and tables. This column is not supposed to show any appreciable growth because there is no microorganism in it but the values attributed to it increased to values much higher than even control growth values (row A) showing this is an artifact. It was therefore impossible to obtain reliable MTCs and IC50s for deltamethrin. Cypermethrin was also mildly cloudy but not enough to affect the test results significantly.
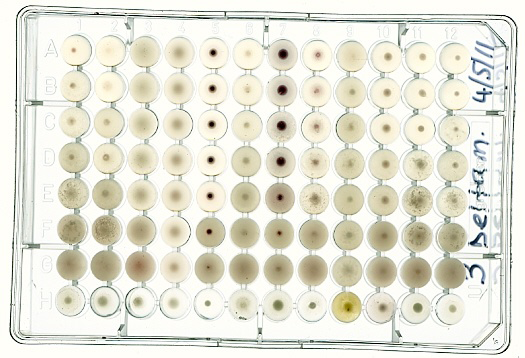
c Figure 5: Deltamethrin replicates scans (a: replicate 1, b: replicate 2 and c: replicate 3).
It can also be seen from tables 6-8 that the same microorganisms that did not grow satisfactorily in the cypermethrin test behaved similarly namely microorganisms number 1, 2, 3, 6, 8 and 11. We believe this lack of good growth may have been due to our filter-sterilization of the growth medium which could have reduced some of the nutrients and sensitive organisms to this were affected.
| Data | 1 | 2 | 3 | 4 | 5 | 6 | 7 | 8 | 9 | 10 | 11 | 12 | Deltamethrin Conc. (mg/l) |
|---|---|---|---|---|---|---|---|---|---|---|---|---|---|
| A | 10 | 4 | 79 | 72 | 47 | 6 | 141 | 15 | 78 | 36 | 21 | 19 | 0 |
| B | 10 | 16 | 79 | 71 | 50 | 11 | 163 | 41 | 121 | 52 | 64 | 20 | 0.21 |
| C | 17 | 65 | 81 | 70 | 48 | 43 | 138 | 69 | 146 | 69 | 102 | 56 | 0.62 |
| D | 83 | 130 | 84 | 70 | 48 | 83 | 167 | 68 | 134 | 83 | 141 | 121 | 1.9 |
| E | 140 | 98 | 112 | 70 | 76 | 93 | 259 | 144 | 153 | 150 | 209 | 166 | 5.6 |
| F | 216 | 235 | 136 | 69 | 176 | 196 | 192 | 196 | 151 | 172 | 235 | 222 | 17 |
| G | 230 | 230 | 184 | 69 | 203 | 205 | 225 | 216 | 193 | 230 | 320 | 223 | 50 |
Table 5: Growth values for MARA deltamethrin replicate 1 scan.
| Data | 1 | 2 | 3 | 4 | 5 | 6 | 7 | 8 | 9 | 10 | 11 | 12 | Deltamethrin Conc. (mg/l) |
|---|---|---|---|---|---|---|---|---|---|---|---|---|---|
| A | 10 | 1 | 57 | 51 | 44 | 5 | 112 | 18 | 28 | 20 | 13 | 5 | 0 |
| B | 16 | 2 | 55 | 53 | 47 | 14 | 114 | 27 | 62 | 24 | 16 | 9 | 0.21 |
| C | 23 | 69 | 61 | 51 | 44 | 10 | 126 | 27 | 65 | 24 | 33 | 13 | 0.62 |
| D | 54 | 84 | 71 | 53 | 43 | 46 | 165 | 72 | 117 | 45 | 85 | 33 | 1.9 |
| E | 124 | 70 | 102 | 55 | 53 | 85 | 179 | 110 | 101 | 113 | 121 | 110 | 5.6 |
| F | 173 | 141 | 114 | 49 | 190 | 155 | 174 | 189 | 123 | 150 | 235 | 162 | 17 |
| G | 209 | 217 | 221 | 47 | 149 | 141 | 189 | 223 | 159 | 206 | 221 | 189 | 50 |
Table 6: Growth values for MARA deltamethrin replicate 2 scan.
| Data | 1 | 2 | 3 | 4 | 5 | 6 | 7 | 8 | 9 | 10 | 11 | 12 | Deltamethrin Conc. (mg/l) |
|---|---|---|---|---|---|---|---|---|---|---|---|---|---|
| A | 10 | 1 | 61 | 53 | 49 | 4 | 128 | 19 | 32 | 24 | 13 | 8 | 0 |
| B | 14 | 2 | 54 | 49 | 49 | 9 | 125 | 19 | 44 | 24 | 15 | 6 | 0.21 |
| C | 21 | 28 | 62 | 49 | 50 | 14 | 130 | 30 | 82 | 29 | 16 | 12 | 0.62 |
| D | 104 | 38 | 62 | 50 | 46 | 71 | 146 | 44 | 88 | 59 | 60 | 35 | 1.9 |
| E | 116 | 139 | 71 | 53 | 45 | 131 | 199 | 79 | 105 | 96 | 159 | 58 | 5.6 |
| F | 181 | 166 | 144 | 49 | 170 | 160 | 179 | 176 | 132 | 203 | 205 | 179 | 17 |
| G | 152 | 171 | 187 | 39 | a169 | 199 | 186 | 197 | 123 | 198 | 227 | 214 | 50 |
Table 7: Growth values for MARA deltamethrin replicate 3 scan.
Discussion
Results obtained from the MARA toxicity tests in this research have shown that cypermethrin and deltamethrin are non-toxic to most of the microorganisms used at concentrations close to or slightly higher than the recommended application dose. Despite the cloudiness of the two insecticides when mixed with water in our experiments which made reading of toxicity results difficult the MARA toxicity test indicated that cyperemethrin and deltamethrin insecticides treatments did not lead to a considerable inhibition of the growth of most of the microorganisms when compared to the control. This result is in conformity with results from other toxicity of different pesticides on bacteria and microorganisms [9, 10, 11, 12]. Some of these authors have studied the toxic effects of cypermethrin and deltamethrin to a range of microorganisms including the cucumber phyllosphere microbial community, soil microorganisms, soil bacteria, and freshwater sediment microbial community other than those used in our study [10, 11, 13]. These authors concluded that these pesticides instead tended to stimulate the growth of microbial communities and did not represent much danger. Digrak [9] reported that the total number of viable bacteria was found to be higher than that of the control groups during incubation in the isofenphos treated soil sample.
However, two of the microorganisms (Number 5 and 7) were affected by both insecticides in this present study and considering the MTCs and IC50s in the case of cypermethrin, this effect occurred at concentrations much lower than the recommended dose of 125mg/L. This effect cannot be ignored. According to Widenfalk [14], when natural microbial communities are exposed to both environmentally relevant and high concentration of different pesticides, these pesticides decreased overall microbial activity at concentrations that are predicted to be environmentally safe. The insecticides used in our study may have possibly impaired the ability of these two microorganisms to recycle nutrients and perform other functions such as metabolic activity and denitrification. It shows that the insecticides used in this present study if applied at the recommended dose may inhibit the growth of some sensitive microorganisms while promoting the growth of tolerant ones thus modifying the microbial community. Widenfalk [14] explained their observation of stimulated bacterial production at the highest pesticides exposure concentrations in their study as being probably due to increased activity of tolerant microorganisms. This is in agreement with our results. The scientific literature proposes a number of processes that can cause favourable growth conditions for tolerant microbes [9, 14, 11, 12]. Firstly, toxic effects on sensitive microorganisms may result in decreased competition for nutrients and an increased release of labile organic matter from decaying microorganisms. Hence, those groups of microorganisms that are not negatively affected by the pesticide exposure could take the competitive advantage and increase their growth. Secondly, some types of microbes may experience a competitive advantage by their capability of using pesticides as an energy source [9, 14, 11]. The second explanation is more likely in our case since each of the microorganisms was in a separate compartment in the microplate. Therefore, the high microbial growths observed on most of the microorganisms in our study most likely were due to pesticide-induced increase in denitrification rate, which could have used the insecticide as a carbon source for growth. According to Widenfalk [10] an increase in growth activity may also be an effect of stress in response to the pesticide, e.g. causing an increase in metabolism. Alternatively, stimulatory effects on denitrification as a response to exposure of the pesticides may also be due to cell growth and increases in cell numbers. Consequently, cypermethrin and deltamethrin exposure may induce shifts in the dominance of certain groups of microbes in microbial communities. Microbial metabolism is an important process for degrading pesticides in the soil environment [9]. Such changes in the microbial communities of soils and sediments may eventually reduce the ability of the ecosystem to degrade pesticides. It is therefore important to investigate in the field if such changes occur and which microorganisms are negatively affected in order to assess if bacterial species necessary for pesticides degradation are preserved with current pesticides use.
One novelty of MARA is the concept of toxicity fingerprinting and pattern recognition based on the comparison of the toxic fingerprint from a tested compound to a database consisting of fingerprints from a large number of previously tested compounds with known toxic properties [8]. One of the objectives of this research was to investigate if a similar toxicity pattern would be found for the two pyrethroid insecticides used and our limited date show a similar pattern for the two insecticides. This is not very surprising given that all pyrethroids have essentially the same basic mechanism of action on voltage-dependent sodium channels Valentine [15], Siegfried [16] even though it is not clear how this relates to single celled organisms like those in MARA test which may not have such physiological processes. Of course more research with other pyrethroid pesticides is needed to confirm if this pattern will be maintained, in which case, the pattern can be stored in a database and used as a toxicity fingerprint for pyrethroid pesticides in future. The results of our study also indicated some implication for the use of MARA bioassay. The use of non transparent pesticides (which was the case of cypermethrin and deltamethrin) can be considerable, because it can result in a serious underestimation of the toxicity of these types of compounds or insecticides. Therefore, more information is needed on the sensitivity of the MARA test for different groups of chemicals.
Conclusion
The results obtained from this research confirms the fact that species sensitivities to pesticides are different and therefore for a better protection of the aquatic environment and all its resources, information is needed on the sensitivities of a wide range of species at different trophic levels. This can be achieved by carrying out batteries of bioassays using organisms from different trophic levels. MARA is an innovative battery of test within a test and has been shown in this study to be useful in assessing the effect of pesticides to the microorganisms, despite certain drawbacks like its inability to deal with formulations that are not transparent in water. However, this research also demonstrated that the MARA bioassay, despite being a battery of tests, does not represent all trophic levels in the aquatic ecosystem. Therefore, we conclude that for a more complete assessment of the aquatic ecosystem, the MARA bioassay should be used in combination with at least a fish or daphnia bioassay and an algal bioassay in order to assess effects on multicellular organisms, primary producers as well as primary and secondary consumers.
Acknowledgement
We are grateful to the UK National Collection of Industrial, Food and Marine Bacterial (NCIMB), Laboratory of Applied Biology and Ecology (LABEA) in the University of Dschang for providing all the materials and equipment for the MARA test and Dr Patricia Fai for the training skills on MARA test.
References
-
Fai P, Grant A (2010) An assessment of the potential of the microbial assay for risk assessment (MARA) for ecotoxicological testing_._ Ecotoxicology 19(8): 1626- 1633.
-
Wadhia K, Thompson KC (2007) Low-cost eco-toxicity testing of environmental samples using micro-biotests for potential implementation of the Water Framework Directive. TrAC Trend Anal Chem 26(4): 300-307.
-
Van Beelen P (2003) A review on the application of microbial toxicity tests for deriving sediment quality guidelines. Chemosphere 53(8): 795-808.
-
Farre M, Martinez E, Barcelo D (2007) Validation of inter laboratory studies on toxicity in water samples. Trends in Analytical Chemistry 26(4): 283-291.
-
Wadhia K, Dando T, Thompson C (2007) Intra- laboratory of Microbial Assay for Risk Assessment (MARA) for potential application in the implementation of the Water Framework Directive (WFD). Journal of Environmental Monitoring 9: 953-958.
-
Clesceri L, Greenberg A (1998) Standard method for the examination of water and waste water: wastington D.C American public health association, American water association and water environment federation.
-
Fochtman P, Raszka A, Nierzedska E (2000) The use of conventional bioassays, microbiotests, and some rapid methods in the selection of an optimal test battery for the assessment of pesticides toxicity. Environ Toxicol 15(5): 376-384.
-
Gabrielson J, Kuhn I, Colque-Navarro P, Hart M, Iversen A, et al. (2003) Microplate-based microbial assay for risk assessment and (eco) toxic fingerprinting of chemicals. Anal Chim Acta 485(1): 121-130.
-
Digrak M, Kazanici F (2001) Effect of some organophosphorus insecticides on soil microorganisms. Turk J Biol 25: 51-58.
-
Widenfalk A, Svensson JM, Goedkoop W (2004) Effects of the pesticides captan, deltamethrin, isoproturon, and pirimicarb on the microbial community of freshwater sediment. Environmental Toxicology and Chemistry 23(8): 1920-1927.
-
Zhang B, Zhang H, Jin B, Tang L, Yang J, et al. (2008) Effect of cypermethrin insecticide on the microbial community in cucumber phyllosphere. Journal of Environmental Sciences 20(11): 1356-1362.
-
Nazia S, Bharti S, Sinha MP (2010) Effect of organophosphorus insecticide on soil bacteria. An International Quarterly Journal of Life Sciences 1: 239- 246.
-
Leboulanger C, Bouvy M, Pagano M, Dufour R, Patrice G, et al. (2009) Responses of planktonic microorganisms from tropical reservoirs to paraquat and deltamethrin exposure. Archives of Environmental Contamination and Toxicology 56(1): 39-51.
-
Widenfalk A (2005) Interactions between Pesticides and Microorganisms in Freshwater Sediments: Toxic Effects and Implications for Bioavailability. Doctoral thesis, Faculty of Natural Resources and Agricultural Sciences, Department of Environmental Assessment, Swedish University of Agricultural Sciences, pp : 38.
-
Valentine W (1990) Toxicology of selected pesticides, drugs, and chemicals. Pyrethrin and pyrethroid insecticides. The Veterinary Clinics of North America. Small animal practice 20(2): 375-382.
-
Siegfried B (1993) Comparative toxicity of pyrethroid insecticides to terrestrial and aquatic insects. Environmental Toxicology and Chemistry 12: 1683- 1689.
- Lessons to Learn: Trees are More than the Lungs of the World
- Community Forestry Enterprises as a Model for Sustainable Forest Development: The Case Of The "Baja Tarahumara" in Chihuahua, Mexico
- Ecological and Socio-Economic Impacts of Chromolaena odorata and Mesosphaerum suaveolens, Two Invasive Alien Species in Central and Southern Benin, West Africa
- Epigenetic Sustainability: Modeling the Human Factor as a Natural Resource through Science 4.0 and the NR3C1 Biological Pilot
- Growth-at-Risk: A Framework for Assessing Economic Vulnerability
- The Rural Territory as a Socioecological System for the Management of Public Policy for Sustainable Rural Development