Assessment of the Physico-Chemical Parameters of Gubi Dam, Bauchi State, Nigeria
The assessment of seasonal variation of the physico-chemical quality of Gubi dam, Bauchi State Northeastern Nigeria was investigated. The water samples were collected bi-monthly from July, 2022 to June, 2023 for the physico-chemical parameters. The water temperature, pH, conductivity, depth and total dissolved solids, carbon dioxide, biological oxygen demand, alkalinity, nitrate, phosphate, transparency were measured in-situ with the use of Mercury in glass thermometer, water testing kits, wagtech photometer model 7100 and turbid meter HACH 2100P respectively. The dissolved oxygen and biochemical oxygen demand were measured ex-situ in the laboratory using Winkler’s method. The results showed variation in the water parameters within the months. The mean water temperature ranged from 22.33±0.5ºC to 29.33±0.29ºC, while the mean pH varied from 6.54±0.03 in May and June to 8.88±0.11 in August. Mean dissolved oxygen ranged from 6.12±0.09mg/l in April to 8.59±0.58mg/l in July while the mean Carbon-dioxide varied from 0.06±0.05 mg/l in June to 1.73±0.29mg/l in August. The mean turbidity varied from 64.33±1.53NTU in November to 115.83±5.107NTU in July while the mean alkalinity ranged from 66.667±8.33mg/l in July to 87.333±3.79mg/l in December. The mean nitrate varied from 0.01±0.005mg/l in May to 8.28±0.06mg/l in August while the mean phosphate ranged from 0.21±0.04 mg/l in April to 5.13±0.076 mg/l in August. The mean Total dissolved solids ranged from 74.07±4.67mg/l in February to 98.60±1.04mg/l in June while the mean Biological oxygen demand ranged from 0.015±0.002 mg/l in May and June to 0.07±0.01 mg/l in August. The lowest mean Electrical conductivity 145.23±10.65 μS/cm was recorded in September and the highest 518.10±16.89 μS/cm in July while the mean depth varied from 4.03±0.06m in March, April and May to 8.83±0.29m in August. The Physico-chemical parameters recorded in the rainy season differed significantly (p < 0.05) with the parameters recorded in dry season. Correlation coefficient (r) showed positive correlation between temperature and dissolved oxygen with all the physico-chemical parameters. pH had a negative correlation with alkalinity, conductivity, transparency and Total dissolved solids. The results of all the physicochemical parameters measured in Gubi dam are within the permissible limits of national and international standards, the Dam can be regarded as stable and healthy environment for aquatic livings.
Introduction
The expansion of population and advancement of each society necessitate the presence of high-quality groundwater sources such as rivers, streams, lakes, wells, boreholes, and springs, as aquatic organisms rely entirely on it. Within numerous urban and rural communities in sub-Saharan Africa, water is predominantly utilized for household purposes [1]. The assessment of the physicochemical characteristics of such water is crucial in determining the quality of groundwater. Okereke JN, et al. [2] have previously highlighted that the characteristics of these water sources are jeopardized by the discharge of effluents from municipal waste, agricultural practices, and industrial sites, leading to a decline in the biodiversity of aquatic ecosystems. Some of these effluents may contain organic and/or inorganic contaminants as discussed by Mohammad A, et al. [3]. Human interventions along riverbanks often introduce non- biodegradable inorganic substances, resulting in a significant environmental burden [4], impacting water resources in terms of quantity and quality across various spatial and temporal scales. Wurtsbaugh WA, et al. [5] provided a detailed analysis emphasizing the importance of limnological characteristics of aquatic habitats where fish reside, which is essential for evaluating their productivity and suitability for aquaculture, encompassing physical, chemical, and biological parameters.
Faunal distribution, vertical and horizontal migration, diversities, feeding patterns, and other ecological roles are intricately linked to a comprehensive understanding of the physico-chemical characteristics of aquatic ecosystems, as emphasized by Omoboye HY, et al. [6]. It is imperative that the levels of various physicochemical parameters fall within the specified thresholds to achieve optimal fish production [7], as highlighted by Boyd CE [8]. Adedeji HA, et al. [4] have noted the significance of temperature variations, dissolved oxygen (DO), carbon dioxide (CO2), pH, conductivity, total dissolved solids (TDS), water clarity, and other factors in shaping the ecology of riverine fish populations. Previous studies by Onuoha CP, et al. [7] on the Ologe lagoon and recent research conducted by Omoboye HY, et al. [6] on the Owalla Reservoir have provided valuable insights into these dynamics. studies conducted by various researchers such as Oyan and Asejire Lakes; Atobatele OE [9] on Aiba Reservoir; Oso JA [10] on Ero Reservoir; Idowu EO [11] on Ado-Ekiti reservoir; Ani C [12] on selected rivers in Ebonyi state, Nigeria; and Odoemelam SA [13] on cross river at Afikpo North local government area of Ebonyi state, Nigeria provide valuable insights for this research. The significance of water for humans, animals, and plants underscores the importance of evaluating its quality to establish sustainable usage practices and implement necessary corrective measures. The primary objective of this study is to assess the physico-chemical parameters of Gubi Dam in Bauchi State, Nigeria.
Materials and Methods
Study Area
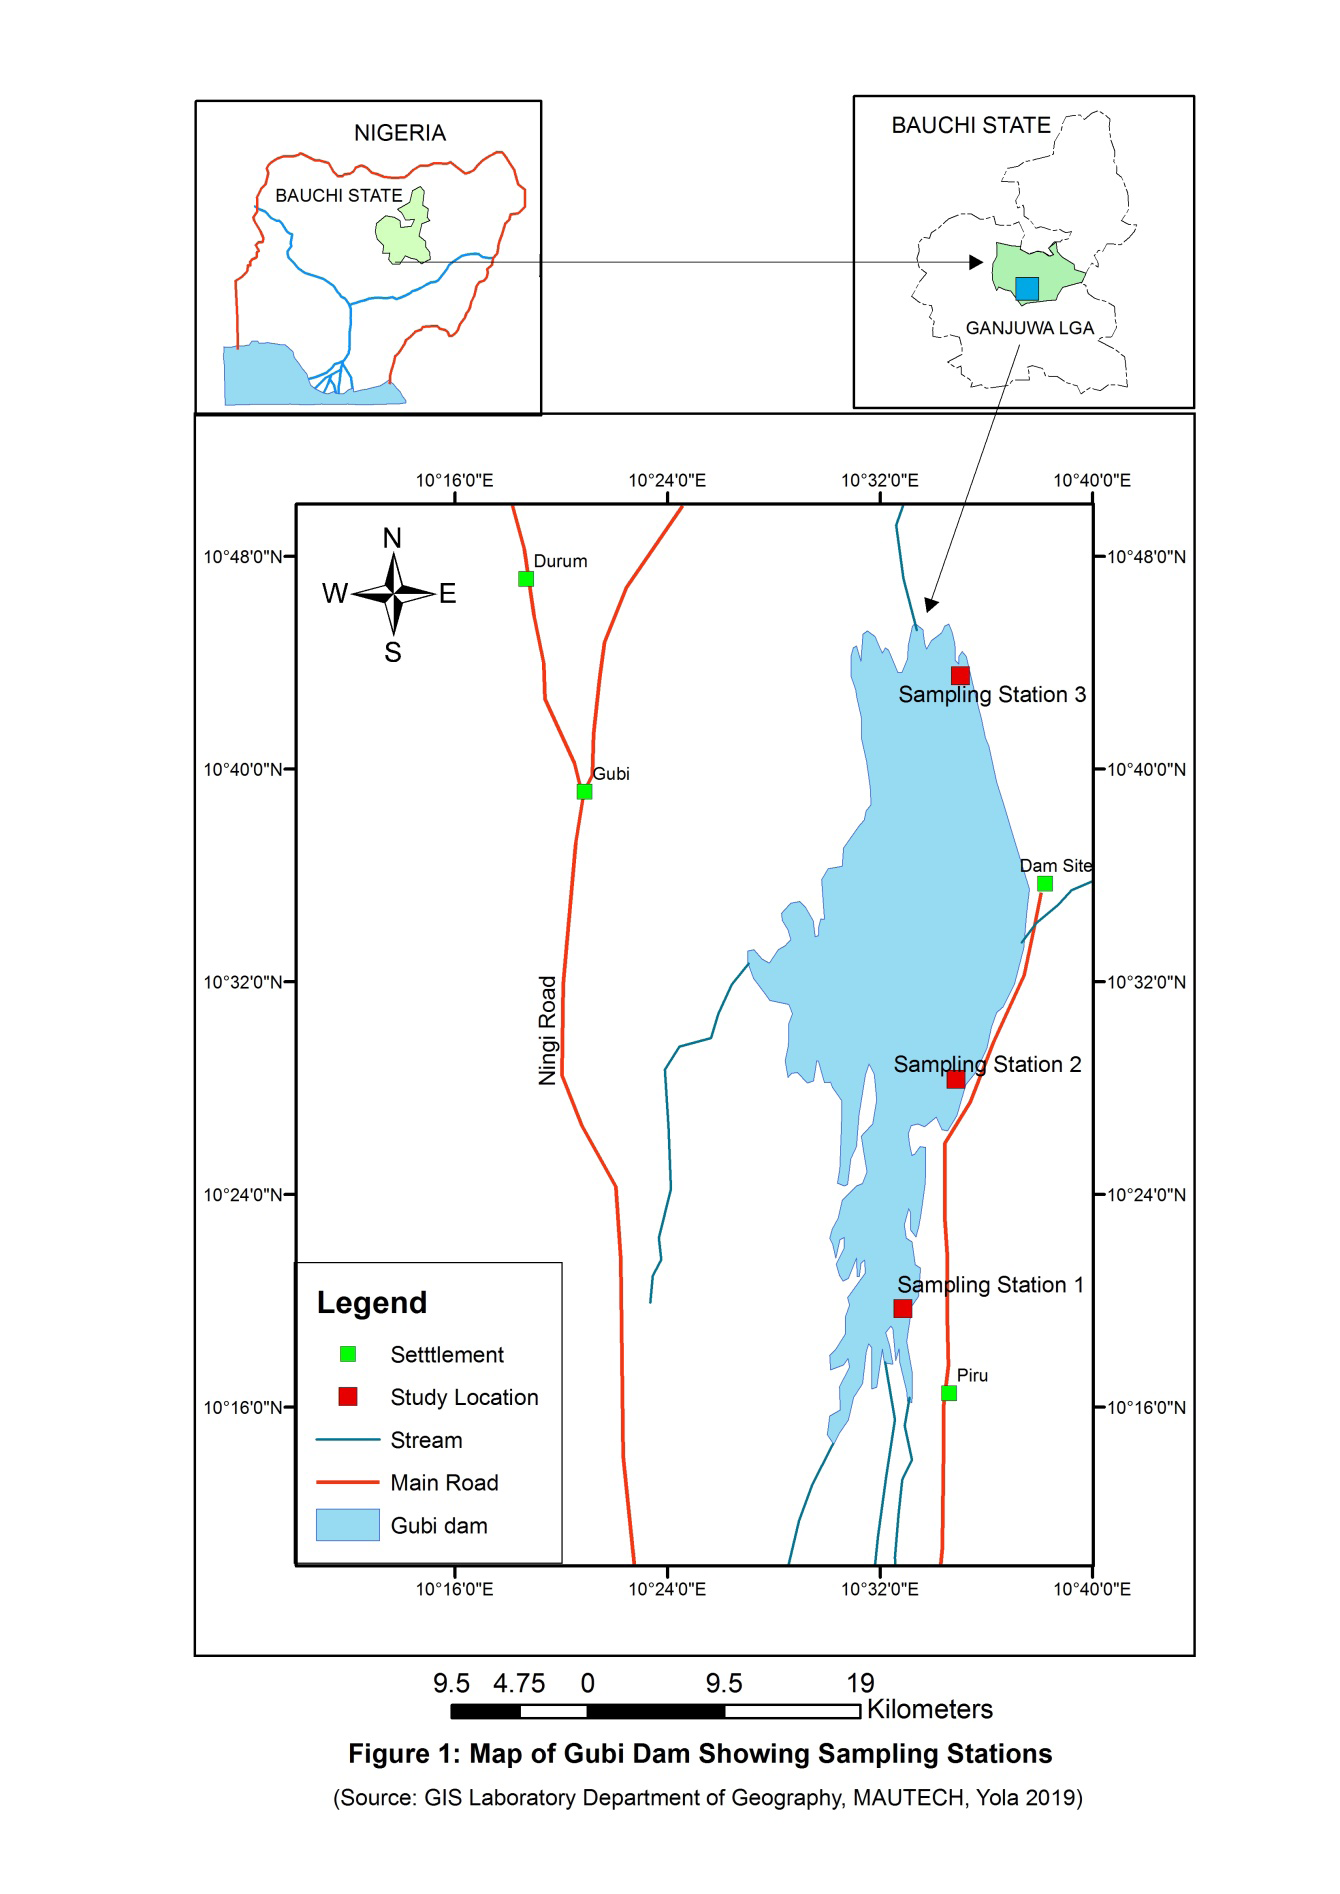
The sampling was conducted at the Gubi dam, Bauchi State, Nigeria (Figure 1). The Gubi dam is geographically located between Latitude 10o 25′ N to 100 26′ N and latitude 90 51′ E to 90 52′ E, the dam receives its water from Tatimari (Shadawanka, Dinya) Larkarina, Suntum and Kumi tributaries. The dam is used for drinking, irrigation and fishing by settlers around the dam [14, 15].
Water sampling and Duration
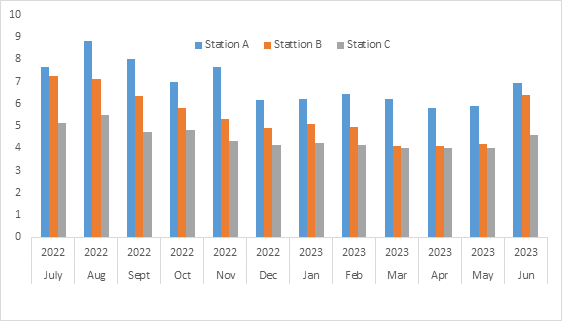
Water samples were collected from three different points on the Dam and mean values of the three points were computed and recorded. The sampling was carried out every fortnight between July, 2022 to June, 2023. Sampling was done between 7.00 am and 9.00 am. Water samples were collected from the dam using one-liter capacity PVC sampling bottles from three stations, on a monthly basis. Temperature, and depth were determined in-situ while pH, dissolved oxygen, carbon dioxide, biological oxygen demand, alkalinity, nitrate, phosphate, turbidity, total dissolved solid and conductivity were done in the department of fisheries laboratory.
Temperature readings were taken using mercury in glass thermometer to the nearest 0.1 °C. The thermometer was place at about 10 cm below the water surface for about 5 minutes to stabilize after which the readings were taken and recorded. The pH readings were measured using wag tech pH meter (7020 model) while the turbidity was measured using a HACH 2100P direct reading portable turbidity meter.
Total dissolve solids and conductivity were measured using a portable wag tech conductivity/TDS meter (model). Dissolve oxygen (DO), Carbon dioxide and Biological Oxygen Demand (BOD) was estimated using [16]. All determinations were done in triplicates and the mean values were recorded (Figire 1-13).
Statistical Analysis
Data were subjected to the analysis of variance and a significance test for difference among monthly variation of physico-chemical parameters using the Duncan Multiple Range Test (DMRT) was used to separate the means at P<0.05 level of significance with the aid of statistical analysis (Statistix 10.0).
Results
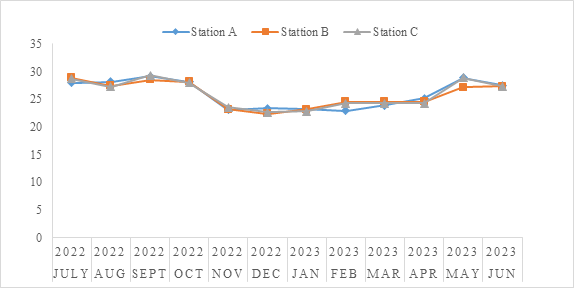
Table 1 shows the mean, standard error and range of physico-chemical parameters measured during the study period in Gubi dam. The monthly variations of physico- chemical parameters of Gubi dam measured between July, 2022 to June, 2023 are presented in Figures 2-13.
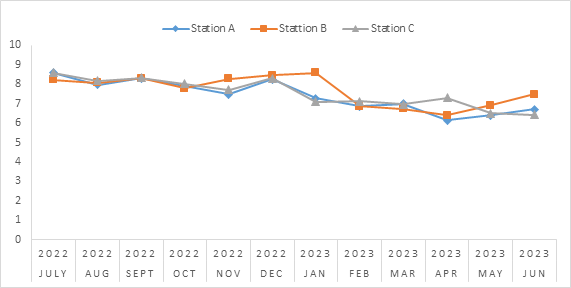
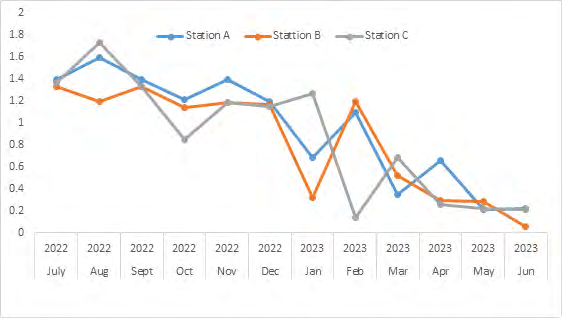
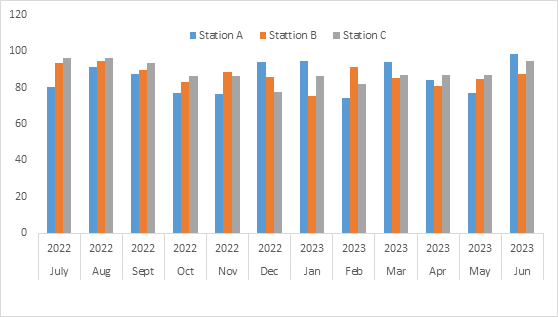
The highest mean water temperature was recorded in September while the lowest mean temperature was in December. Transparency was highest in January and lowest in November.
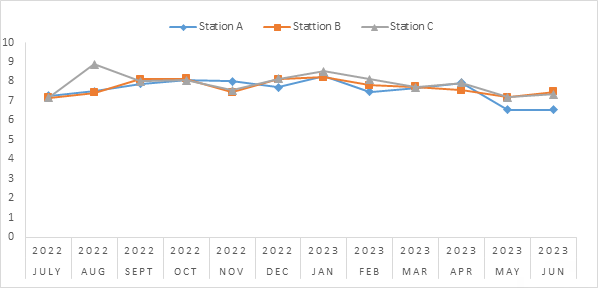
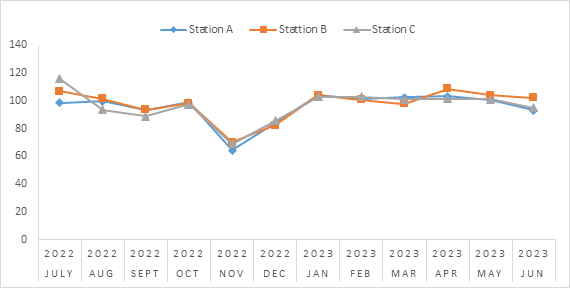
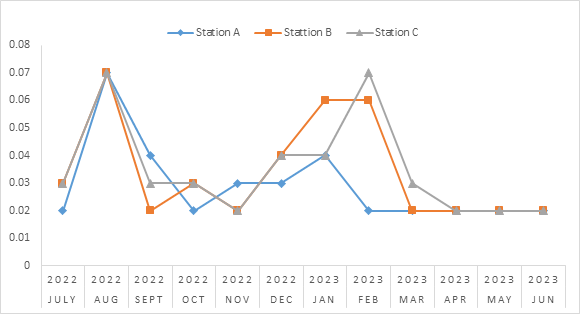
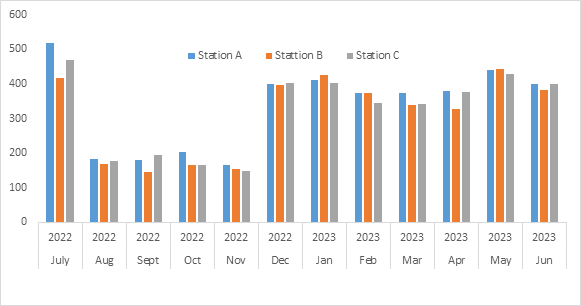
The highest dissolved oxygen value was recorded in July and lowest in April, although there was significance difference in the value recorded. The biological oxygen demand had the highest value in the month of August 2022, BOD differed significantly across the months while the lowest was recorded in the month of May and June 2023. The mean highest conductivity was recorded in the month of July, 2022 while the mean lowest was recorded in the month of September.
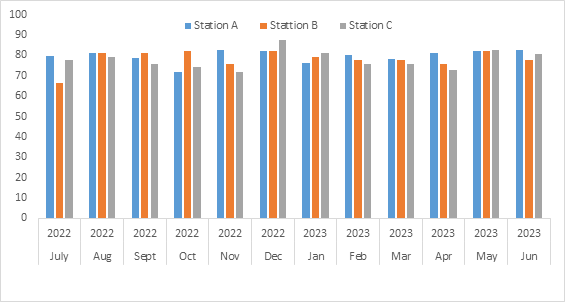
Conductivity differed significantly (p<0.05) between rainy and dry season months. The mean highest total dissolved solid was recorded in June 2022 while the mean lowest was recorded in February. The lowest monthly mean pH was obtained during the early rainy season in May and June 2023, while the highest was obtained in August 2022. The analysis of variance (p<0.05) showed that pH to be statistically higher during the wet season than in the dry season.
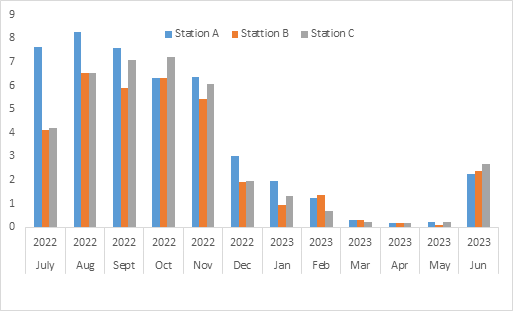
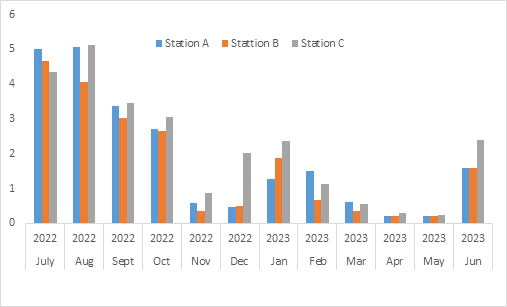
Carbon-dioxide was statistically higher (p<0.05) with mean value in August 2022, lowest mean was reported in June 2023. Alkalinity was statistically higher (p<0.05) in December 2022, lowest mean value was recorded in in July 2022. The highest monthly mean concentration of nitrate recorded was obtained at the peak of the rains in August 2022. A decrease was observed in the dry season with the lowest concentration recorded in May 2023.
Phosphate had the least concentration in April, highest mean value was obtained in August 2022. So also, phosphate concentration was significantly higher (p<0.05) in rainy season. Highest depth was recorded in August 2022 while lowest depth was recorded in March, April and May 2023.
The correlation coefficient (r) values for the physico- chemical parameters are showed in Table 2. The water temperature correlated positively with all the parameters. pH correlated positively with DO (r=0.515), Depth (r=0.005), CO2 (0.432), Nitrates (r=0.218), Phosphate (r=0.102) but correlated negatively with alkalinity (r=-0.078), conductivity (r=-0.447), Transparency (r=-0.125) and TDS (r=-0.173) (p<0.05) respectively.
Biological oxygen demand correlated negatively with conductivity (r=-0.237) but correlated positively with the remaining parameters. Alkalinity correlated positively with conductivity and TDS (r=0.196; 0.147) respectively but correlated negatively with transparency (r=-0.176), depth (r=-0.184), CO2 (r=-0.185), Nitrates (r=-0.249), Phosphate (r=-0.214). The Conductivity showed low negative correlation to Phosphate (-0.260) while it shows higher correlations to depth (-0.459), CO2 (-0.543), TDS (-0.067), Nitrates ( -0.738). Transparency shows negative correlations with Depth (r=-0.081), CO2 (r=-0.360) and Nitrates (r=-0.370) while it shows low correlations to TDS (r=0.105) and Phosphate (0.232). The total dissolved solid showed low correlation with the Carbon-dioxide (r=0.206) and Nitrates (r=0.355) while it showed high correlation with Phosphate (r=0.623) (Tables 1 & 2).
| Parameters | Present Study | Maximum permissible limits in water | ||||
|---|---|---|---|---|---|---|
| Min | Max | Mean±S.E | WHO | USEPA | SON | |
| Temp. (0C) | 22.33 | 29.17 | 25.86+310.37 | 40 | < 31oC | Ambient |
| pH | 6.54 | 8.3 | 7.57+90.86 | 6.8 | 6.5-8.5 | 6.5-8.5 |
| Dissolved Oxygen (mg/l) | 6.12 | 8.59 | 7.40+88.85 | 04-Jun | 5 | >4 |
| Biological Oxygen Demand (mg/l) | 0.02 | 0.07 | 0.03+0.35 | <3 | <5 | <5 |
| Alkalinity (mg/L) | 71.67 | 82.33 | 79.72+956.63 | 200 | - | 100 |
| Conductivity (μmhos/cm) | 179.6 | 518.1 | 335.355+4024.26 | 500 | - | 1000 |
| Transparency (cm) | 64.33 | 104.2 | 95.42+1145.01 | 50 | - | 50 |
| Depth (m) | 6.2 | 8.83 | 6.90+82.76 | - | - | - |
| Total Dissolved Solid (mg/l) | 76.5 | 98.6 | 84.99+934.9 | 1000 | 500 | 500 |
| Carbon dioxide (mg/L) | 0.21 | 1.6 | 0.95+11.45 | - | - | - |
| Nitrates(mg/L) | 0.2 | 8.28 | 3.77+45.28 | <10 | 10 | |
| Phosphates(mg/L) | 0.21 | 5.06 | 1.88+22.56 | <0.1 | <0.1 | <0.1 |
Table 1: The mean, standard error and range of physico-chemical parameters of Gubi Dam and Set standard for Domestic Use and A
Where: WHO-World Health Organisation; USEPA- United States Environmental Protection Agency; SON- Standard Organisation of Nigeria. Table 1: The mean, standard error and range of physico-chemical parameters of Gubi Dam and Set standard for Domestic Use and Aquaculture.
| Temp | pH | DO | BOD | Alkalinity | Conductivity | Transp. | Depth | TDS | CO2 | Nitrates | Phosphate | |
|---|---|---|---|---|---|---|---|---|---|---|---|---|
| Temp. | 1 | |||||||||||
| PH | -0.403 | 1 | ||||||||||
| D O | 0.156 | 0.373 | 1 | |||||||||
| BOD | -0.195 | 0.515 | 0.375 | 1 | ||||||||
| Alkalinity | -0.125 | -0.078 | -0.062 | 0.193 | 1 | |||||||
| Conductivity | -0.177 | -0.447 | -0.35 | -0.237 | 0.196 | 1 | ||||||
| Transparency | 0.345 | -0.125 | -0.325 | 0.056 | -0.176 | 0.535 | 1 | |||||
| Depth | 0.568 | 0.005 | 0.678 | 0.413 | -0.184 | -0.459 | -0.081 | 1 | ||||
| TDS | 0.413 | -0.173 | 0.287 | 0.246 | 0.147 | -0.067 | 0.105 | 0.675 | 1 | |||
| CO2 | 0.095 | 0.432 | 0.911 | 0.558 | -0.185 | -0.543 | -0.36 | 0.699 | 0.206 | 1 | ||
| Nitrates | 0.478 | 0.218 | 0.779 | 0.283 | -0.249 | -0.738 | -0.37 | 0.875 | 0.355 | 0.819 | 1 | |
| Phosphate | 0.605 | 0.102 | 0.7 | 0.466 | -0.214 | -0.26 | 0.232 | 0.922 | 0.623 | 0.675 | 0.758 | 1 |
Table 2: Correlation coefficient between the physicochemical parameters in Gubi Dam, Bauchi state.
Discussion
Physico-chemical parameters of Gubi Dam during the study period showed variations which may be associated with patterns of water use and rainfall. Temperature is an essential factor that influences primary production in reservoir [17]. The mean water temperature of Gubi Dam fluctuated between 22.33 oC and 29.33 oC which falls within the adopted range for tropical water bodies [18]. Climatic factors are determined factors for increase or decrease in temperature in the tropics [19]. Similar mean temperature value was also reported by Adedeji HA [4] and Uttah CE [20]
from Lake Ribadu Adamawa and Calabar River respectively. The increase and decrease in temperature recorded in the study might be attributed to the climate of tropics usually before precipitation the increase in temperature is experienced which coincide with the time of sampling and to the cold weather of harmattan. The mean variation in pH values was generally alkaline during the sampling period and fluctuated between 6.54 and 8.88. Similar mean pH value was also reported by Tusayi BW [21] in Dadin kowa Dam, in Watari Dam Kano and in Lake Ribadu Adamawa [22]. The mean pH value from this study falls within the recommended values documented by Boyd CE, et al. [23, 24] for most tropical natural waters which suggest that the lake is good for aquatic life production. The mean variation of the dissolved oxygen ranged from 6.12-8.59mg/l which is similar to the values also reported by Abubakar UM, et al. [25] who worked on Dadin-kowa reservoir and (10) on Ero reservoir but higher that the value reported by Anago IJ, et al. [26] from Awba Reservoir, University of Ibadan.
Biological oxygen demand recorded in Gubi Dam 0.02 mg/L and 0.07 mg/L was very low compared to the value 0.44 to 2.4 mg/L in Dadin kowa Dam Gombe State. Dhanam S [27] stated that the Biological oxygen demand of unpolluted water is less than 1.00 mg/l, moderately polluted water 2.00 – 9.00 mg/l while heavily polluted water has Biological oxygen demand more than 10.00 mg/l. In Gubi Dam pH recorded has strong positive correlation with BOD. Alkalinity value recorded in this work was between 66.667 and 87.333mg/l and this is in line with the work of Patil JG [28] who reported 76mg/l to 79.30 mg/l in Adan Dam Reservoir and 80.2mg/l to 105 mg/l in Oustery Lake. Variation in alkalinity recorded in this study between the wet and dry months could be associated to the erosion of the soil with bicarbonate, carbonate or hydroxide compounds during the wet season into the water body [29]. The exploitation of alluvial soil at the Dam site by the citizens of the area may also contribute to change in alkalinity because it leads to erosion. The mean value of conductivity (335+4.02μmhos/cm) suggests that the conductivity level is intermediate. Conductivity levels below 50μmhos/cm are regarded as low; those between 50- 600 μmhos/cm are medium while those above 600μmhos/ cm are high conductivity [30]. This value of transparency recorded in Gubi Dam was high compare to the value recorded by (22) in Watari Dam Kano, however Similar to the value recorded by Ali MZ [31] in Kogi state. Depth values of between 6.20m and 8.83m recorded in this study are similar to those recorded by Aghoghovwia OA [32] of 780 – 1500 cm on Warri River, Nigeria. Higher depth during the wet period also agrees with the results obtained in other regions by Aghoghovwia OA [32, 33]. Depth values tend to increase as a result of influx of flood which consequently increases the volume of water in the basin. The mean value for total dissolve solid (84.99+934.9) was relatively lower in this study which is also lower than that of lake Ribadu and Dadin-kowa. There was positive correlation between the total dissolved solids and water temperature which is similar to the report of Eze EC [26] that reported positive correlation between the total dissolved solids and air temperature. High nitrate value recorded in this study might be attributed to nitrate fertilizer leached from Agricultural field and waste disposal in to the dam. Human activities in the catchment areas usually introduced inorganic substances that are non-biodegradable and have been reported to create an environmental burden of considerable magnitude which effects are left on the quantity and quality of water resources over a wide range of space and time scales [4]. Nitrogen value recorded was similar to the work of and it was high compared to the report of Tusayi BW [21] in Dadin kowa Dam and those of (35) in a reservoir of Tamilnadu. Phosphate has strong positive correlation with temperature. High value of phosphate recorded during the period of the study were comparable to the work of Nafiu SA [22] in Watari Dam Kano and these might be associated with anthropogenic activities that are taking place around the dam.
Conclusion
In conclusion, it is found that all measured parameters are within the permissible limits of national and international standards; hence, the dam can be regarded as stable and healthy environment which promotes primary productivity as at the time of this study.
Conflict of Interest
The authors declare that the research was conducted in the absence of any commercial or financial relationships that could be construed as a potential conflict of interest.
Funding Information
This study involved no external funding.
Author’s Contribution
Conceptualization AMD and MYH; Investigation AMD and JIA; Project administration AMD, Methodology, AMD and JIA; Formal Analysis, MYH; Supervision JIA; Writing – Original Draft Preparation MYH and AMD; Writing-Review & Editing MYH, AMD and MAM. All authors were involved in critical interpretation of the data, manuscript revision, and final version approval.
References
-
Magrin G, De Montclos MAP (2018) Crisis and Development. The Lake Chad Region and Boko Haram. Agence Française de Development: Paris, France.
-
Okereke JN, Ogidi OI, Obasi KO (2016) Environmental and health impact of industrial wastewater effluents in Nigeria-A Review. Int J Adv Res Biol Sci 3(6): 55-67.
-
Mohammad A, Asiri AM (2017) Inorganic pollutants in wastewater: methods of analysis, removal and treatment. Materials Research Forum LLC.
-
Adedeji HA, Idowu TA, Usman MA, Sogbesan OA (2019) Seasonal variations in the Physico-chemical paramaters of Lake Ribadu, Adamawa State Nigeria. International Journal of Fisheries and Aquatic Studies 7(1): 79-82.
-
Wurtsbaugh WA, Heredia NA, Laub BG, Meredith CS, Mohn HE, et al. (2015) Approaches for studying fish production: Do river and lake researchers have different perspectives?. Canadian Journal of Fisheries and Aquatic Sciences 72(1): 149-160.
-
Omoboye HY, Aduwo AI, Adewole H, Adeniyi IF (2022) Water quality and planktonic community of Owalla Reservoir, Osun State, Southwest Nigeria. Acta Limnologica Brasiliensia 34: e11.
-
Onuoha CP (2009) Phytoplankton biomass and diversity in relation to environmental parameters at Ologe Lagoon, Lagos (Doctoral dissertation, University of Lagos (Nigeria)).
-
Boyd CE (1979) Water Quality Management for Pond Fish Culture. Elsevier Scruneh Publishers pp: 249.
-
Atobatele OE, Ugwumba OA (2008) Seasonal Variation in the physico chemistry of a small tropical reservoir (Aiba Reservoir, Iwo, Osun, Nigeria). African Journal of Biotechnology 7(12): 1962-1971.
-
Oso JA, Fagbuaro O (2008) An Assessment of the Physico- Chemical Properties of a Tropical Reservoir, Southwestern, Nigeria. Journal of Fisheries International 3(2): 42-45.
-
Idowu EO, Ugwumba AAA, Edward JB, Oso JA (2013) Study of the Seasonal Variation in the Physico-chemical Parameters of a Tropical Reservoir. Greener Journal of Physical Sciences 3(4): 142-148.
-
Ani C, Okogwu OI, Nwonumara GN, Nwani CD, Nwinyimagu AJ (2016) Evaluation of Physicochemical Parameters of Selected Rivers in Ebonyi State, Southeast, Nigeria. Greener Journal of Biological Sciences 6(2): 34- 41.
-
Odoemelam SA, Okorie DO, Oko IO (2013) Physico- chemical parameters and heavy metal content of water, fish and sediments from cross river at Afikpo north local Government area of Ebonyi state, Nigeria. Bioresearch Bulletin pp: 10-15.
-
Bauchi State Water Board/TP/037 (1990) Documentary of Gubi Dam Water Supply Scheme. pp: 4.
-
Wufem BM, Ibrahim AQ, Gin NS, Shibdawa MA, Adamu HM, et al. (2009) Levels of Heavy metals in Gubi dam water Bauchi, Nigeria. Global Journal of environmental sciences 8: 2.
-
American Public Health Association (APHA) (2005) Standard methods for the examination of water and wastewater. In: 20th (Edn.), Washington DC, USA.
-
Sunder S (2015) Analysis of Plankton Diversity and Density with Physico-Chemical Parameters of Open Pond in town Deeg (Bhratpur) Rajasthan, India (2015) International Research Journal of Biological Sciences 4(11): 61-69.
-
Alabaster JS, Lioyd R (1980) Water Quality for freshwater fish. FAO and Butter Worths, London, UK, pp: 29.
-
Abubakar U (2014) Some Aspects of Limnology and Biology of some selected Fish species in Lake Alau Borno state, Nigeria. Unpublished MSc. Federal University of Agriculture Makurdi pp: 167.
-
Uttah CE, Uttah C, Akpan P, Mikpeme E, Ogbeche J, et al. (2008) Bio-survey of Plankton as indicators of water quality for recreational activities in Calabar River, Nigeria M. Tech Thesis NSUKA University. Unpublished pp: 14-38.
-
Tusayi BW (2016) Analysis of physico-chemical Parameters and Plankton Biodiversity in Dadin Kowa Reservoir, Gombe State, Nigeria. M.Tech Thesis Modibbo Adama University of Technology Yola. Unpublished
-
Nafiu SA, Rabiu HD, Abdullahi MT, Halliru SN, Kabiru MY, et al. (2017) Potential Health Impacts of Phytoplankton Composition in Watari Dam Kano, Nigeria. International Journal of Advanced Academic Research Sciences, Technology and Engineering 3: 2488-9849.
-
Boyd CE (1979) Water Quality Management for Pond Fish Culture. Elsevier Scruneh Publishers pp: 249.
-
WHO (World Health Organization) (1984) International Standard for drinking water. In: 4th (Edn.), Geneva, USA.
-
Abubakar UM, Umar DM, Zainab MZ (2015) Effects of Some Physicochemical Parameters on Oreochromis niloticus in Dadin Kowa Reservoir Gombe State Nigeria. International Journal of Advances in Chemical Engineering and Biological Sciences 2(2): 110-112.
-
Anago IJ, Esenowo IK, Ugwumba AAA (2013) The Physico-chemistry and Plankton Diversity of Awba Reservoir University of Ibadan, Ibadan Nigeria. Research Journal of Environmental and Earth Sciences 5(11): 638- 644.
-
Dhanam S, Sathya A, Elayaraja B (2016) Study of Physico- chemical Parameters and Phytoplankton Diversity of Oustery Lake in Puduchery. World Scientific News 54: 153-164.
-
Patil JG (2012) Assessment of Physico-chemical Parameters of Adan Dam Reservoir, Karanja (Lad), District Washim (m.s.). Vidyabharati International Interdisciplinary Research Journal 1(2): 15-20.
-
Eze EC (2015) Water Quality and Algal Biodiversity of Ebonyi River, Udenu LGA Enugu State Nigeria. MSc Thesis University of Nigeria, Nsukka pp: 16-43.
-
Adeleke CA (1982) Studies on the ecology and feeding habits of Lymnea natalensis (Krauss), intermediate host of cattle liver fluke in Ibadan area. Ph.D. Thesis, University of Ibadan.
-
Ali MZ, Micheal AA, Yahuza T (2013) Physico-Chemical Characteristics and phytoplankton Abundance of the Lower Niger River, Kogi State, Nigeria. Journal of Environmental Science, Toxicology and Food Technology (IOSR-JESTFT) 2: 31-37.
-
Aghoghovwia OA (2011) Physico-chemical characteristics of Warri River in the Niger Delta Region of Nigeria. Journal of Environmental Issues and Agriculture in Developing Countries 3(2): 40-46.
-
Singh S, Gupta BK (2010) Analysis physico-chemical Parameter of ground water with reference of town Deeg (Bharatpur) Raj, Proc. of 12th national conf. of Society of sci. and Environ, on interdisciplinary approaches in environ, sci. held on 9th and 10th Oct., at Vadodara (Gujrat), India, pp: 39.
-
Kather Bee S, Chitra J, Malini E (2015) Studies on Plankton Diversity and Water Quality of Ambattur Lake, Tamilnadu. International Journal of Pure and Applied Zoology 3: 31-36.
-
Sivakumar K, Karuppasamy R (2008) Factors affecting productivity of phytoplankton in a reservoir of Tamilnadu, India. American Eurasian Journal of Botany 1(3): 99-103.
- Lessons to Learn: Trees are More than the Lungs of the World
- Community Forestry Enterprises as a Model for Sustainable Forest Development: The Case Of The "Baja Tarahumara" in Chihuahua, Mexico
- Ecological and Socio-Economic Impacts of Chromolaena odorata and Mesosphaerum suaveolens, Two Invasive Alien Species in Central and Southern Benin, West Africa
- Epigenetic Sustainability: Modeling the Human Factor as a Natural Resource through Science 4.0 and the NR3C1 Biological Pilot
- Growth-at-Risk: A Framework for Assessing Economic Vulnerability
- The Rural Territory as a Socioecological System for the Management of Public Policy for Sustainable Rural Development