Effects of Randomized Central Nerve System Anomalies on the Expression of Stem/Progenitor Cell Markers in the Different Components of Human Fetus Umbilical Cord
Aim: In this study, immunophenotypic changes of stem cells in umbilical cords of fetuses taken with 12-20 weeks of central nervous system (CNS) anomaly were investigated at the tissue level. The basis of the study was based on the hypothesis that central nervous system pathologies may adversely affect the stem cell profile in the umbilical cord during early fetal development. Materials and Methods: The umbilical cords of 6 human fetuses with CNS anomalies between 12-20 weeks were used as the study group (n=6). As the control group, umbilical cords of 6 human fetuses with no CNS anomalies were used (n=6). CD29, CD44, CD73, STRO1, Vimentin, CD90, CD31 and CD34 stem/progenitor markers were evaluated separately in the amniotic epithelium (AE), Wharton jelly (WJ), umbilical artery (UA) and umbilical vein (UV) by immunohistochemistry. CD29, CD90 CD31 expressions were also evaluated by immunofluorescent staining. Results: CNS anomalies suppressed bio-markers in mesenchymal stem cells (MSCs) in WJ. CD29, CD73 and CD90 expressions were found to be low in the AE of CNS Anomaly groups. When looking at the MSC profile in the UA, it was found that CD44 and CD90 expressions decreased in fetus cords with CNS anomalies. CNS anomalies suppressed CD44, CD73 and CD90 immunoexpressions of MSCs in the UV. STRO1 expressions were severely suppressed in both WJ and perivascular areas in the study group. A similar situation is valid for CD34 and CD31 immune-expression. Conclusion: In this study, the effects of CNS anomalies on the umbilical cord stem cell niches were revealed. The effects of CNS anomalies on the stem/progenitor cell profile in the fetal umbilical cord have been demonstrated for the first time in this study.
Introduction
Developmental anomalies of the umbilical cord and fetal blood vessels are associated with central nervous system (CNS) anomalies and are the main causes of compromised fetal circulation [1, 2]. CNS anomalies are the second most common type of congenital disorders after common cardiac anomalies in development and often result in stillbirths or miscarriages [3, 4]. The umbilical cord is a very important source of stem cells for medical and clinical applications and is very rich in mesenchymal cells from the embryonic period. Mesenchymal stem cells (MSCs), which are generally located in Wharton jelly in the umbilical cord, have also been successfully isolated and replicated from umbilical artery (UA) and umbilical vein (UV). Fetal stem cells are more potent cells than adult stem cells, which makes them more advantageous than adult stem cells [5, 6]. The umbilical cord (UC) consists of two arteries and one vein, blood vessels, and Wharton Jelly (WJ) components, which feature mucous connective tissue surrounding them. Perivascular areas in the umbilical cord are especially the parts where MSCs are located [7]. Mesenchymal stem cells in these areas commonly express strongly the CD29, CD44, CD73, CD90, and CD105 markers.
They are negative cells in terms of the expression of hematopoietic stem cell markers such as CD34, CD45, and HLA-DR [8, 9]. CD31 is also expressed in the UA and UV endothelium [10]. STRO1 is a pluripotent stem cell marker and is also expressed in umbilical cord tissue [11]. As UC is fetal as well as extra-embryonic tissue, it is usual to have a pluripotent cell profile. It has been reported that MSCs isolated from WJ share similar characteristics with other cord blood MSCs as well as adult bone marrow MSCs with respect to the expression of markers, differentiation potential, and production of cytokines [8, 9, 10]. Whether these cells isolated from UV, WJ and UA represent different cell populations remains unclear [12]. Our study fills this deficiency in the literature as it reveals the stem/progenitor cell profile in both the umbilical cord of fetuses with CNS anomalies and the umbilical cord of control samples without CNS anomalies. In this study, the immunophenotypic changes in the surface membrane markers of the stem cells in the umbilical cords of fetuses taken with 12-20 weeks of CNS anomaly were investigated according to their localization at the tissue level. In our study, separate profiling of mesenchymal, hematopoietic, pluripotent and endothelial cells in the umbilical cord of fetuses with CNS anomalies was provided.
Materials and Methods
The Selection of Fetal Umblical Cord Materials
This study was approved by the Health Sciences University Istanbul Training and Research Hospital clinical research ethics committee on 21.12.2018 with the decision number “1609”. In the study, umbilical cords of 6 human fetuses between 12-20 weeks with central nervous system anomaly and taken for any reason such as abortion or curettage were used as the study group (n=6). As the control group, umbilical cords of 6 human fetuses between 12-20 weeks, without central nervous system anomaly and taken for any reason such as abortion or curettage, were used (n=6). In this study, a total of 12 human fetal umbilical cords, n = 12 (control group, n=6 and study group, n=6) were used.
The Sampling of Umbilical Cord Tissues
During the material collection, the umbilical cord of the fetuses was cut from the fetuses and taken into a separate container. Each umbilical cord sample taken was fixed with 10% buffered neutral formalin. Formalin was injected through the umbilical vein for fixation and preserved in fixative at 20 times the tissue volume. Transverse sections approximately 0.5 cm long were taken from the midline of each fetal umbilical cord material and sampled into labelled tissue cassettes. The umbilical cord tissues, whose sections were prepared macroscopically and fixation was completed, were embedded in paraffin after tissue follow-up and sections of 5 µm thickness were transferred to poly-lysine coated glass slides.
Hematoxylin-Eosin Staining
Hematoxylin-eosin staining was performed to show the general tissue morphology of the umbilical cord in the control group and fetuses with CNS anomalies.
Immunohistochemistry
Surface markers, mesenchymal, hematopoietic, pluripotent stem cell profiles and endothelial cell profiles in the umblical cord of the fetuses in the control and study groups were evaluated by immunohistochemistry. Human integrin b1/CD29 antibody (Proteintech, USA, 1:50 diluted), human CD44 antibody (Proteintech, USA, diluted 1:100), human CD73 antibody (Proteintech, USA, 1:50 diluted), human MMP3/STRO1 antibody (Proteintech, USA, 1:40 diluted), human Vimentin antibody (BioLegend, USA, diluted 1:100), human THY1/CD90 antibody (Proteintech, USA, diluted 1:100), human CD31 antibody (BioLegend, USA, 1:10 diluted) and human CD34 antibody (BioLegend, USA, diluted
1:300) were used as primary antibodies. Biotin conjugated secondary antibody and HRP-conjugated streptavidin- peroxidase were used before DAB chromogen (Thermo Scientific, USA).
Immunohistochemical staining was carried out from paraffin-embedded tissue sections by making some optimizations according to the previously described procedure. 21 Paraffin sections were deparaffinized using xylene and alcohol series after 1 hour incubation at 60°C in the oven. Antigen retrieval was performed by boiling tissue preparations in 0.01M citrate buffer (BioLegend, USA) at 95- 100°C for 30 minutes. After boiling the preparations were allowed to cool to room temperature in citrate. Endogenous peroxidase activity was blocked by using a 0.3% peroxidase suppressor (Thermo Scientific, USA). The tissues were then blocked with UV Blocking Solution (Thermo Scientific, USA) for 20 minutes at room temperature to prevent non-specific antibody binding. The preparations were incubated at +4°C overnight with the primary antibodies indicated according to the dilution ratios given above. The preparations were incubated with biotin-containing secondary antibody and Streptavidin-Peroxidase-HRP for half an hour. Then the preparations were stained brown with Diaminobenzidine (DAB) chromogen. After the staining process, washing processes were performed and the nuclear regions were counter-stained with Harris modified Hematoxylin (Thermo Scientific, USA). A light microscope (Leica DM IL Led, Germany) was used to photograph images of tissue sections after the preparations were mounted.
Semi-Quantitative Analysis and Scoring of Immunoperoxidase Activities
To measure the immuno-expression of the markers, the average intensity of the brown area and the mean area significance values (Intensity/Area) were evaluated. Immun- expressions between groups were statistically compared. Intensity/Area analyses were performed through ImageJ (NIH, Bethesda, MD, USA) software. In addition, the immune expressions of the evaluated markers were scored by 5 different investigators who did not know in which group the material belonged. The 0-4+ range was used for scoring (0: No expression, 1+: Mild expression, 2+: Moderate expression, 3+: High expression and 4+: Overexpression). Images were photographed in a light microscope with camera attachment (Leica DM IL Led, Germany) at 10, 20 and 40x objective magnification. Analyses were carried out on 40x images.
Immunofluorescent Staining
After the paraffin was removed from the tissues with paraffin sections, the tissues were washed with PBS. After washing, permeabilization was carried out with 0.3% triton-x-100. After permeabilization, it was washed again and blocked with 1% BSA at room temperature for 1 hour. After the blocking, 3 washes were carried out. Tissues were incubated with Human integrin b1/CD29 (Proteintech, USA, 1:50 diluted), Human THY1/CD90 (Proteintech, USA, 1:50 diluted) and Human CD31 (BioLegend, USA, Diluted to 1:50) primary antibodies at + 4oC overnight. It was then washed again to remove unbound primary antibodies and treated with FITC (fluorescent isothiocyanate) -conjugated goat-anti-rabbit fluorescent secondary antibody (Santa Cruz Biotechnology, USA) for 1 hour at room temperature. After the last washing process, the nuclear regions of the tissues were marked with DAPI (4′,6-diamidino-2-phenylindole) and the slides were closed with an antigen-protective mounting medium. All steps from the secondary antibody stage were carried out in the dark environment. Protein expressions were evaluated under a fluorescent microscope (Axio scope A1, Zeiss, Germany).
Statistical Analysis
Semi-quantitative intensity/area analyses of immunoexpressions between groups were performed using multiple-t-test for amniotic epithelium (AE) and Wharton jelly (WJ), and unpaired t-test for umbilical artery (UA) and umbilical vein (UV). Descriptive statistics between control and study group were given as minimum, median, maximum, mean, standard deviation, 95% CI (Confidence Interval) and “p” value. Data with a p-value less than 0.05 were considered statistically significant. All statistical analyses were performed with GraphPad Prism version 8 statistical software.
Results
Immunohistochemical Analysis of Mesenchymal Stem Cell Specific Markers
The general morphology of the umbilical cord is stained with hematoxylin-eosin staining and localizations of amniotic epithelium, fibroblasts in Wharton jelly, umbilical artery and umbilical vein are shown as in Figures 1-6. It was found that CNS anomalies significantly suppressed the immuno- expression of CD29, CD44, CD73, CD90 and vimentin for mesenchymal stem cells in Wharton gel compared to the control group (p <0.05). In terms of amniotic epithelium, CD29, CD44, CD73, CD90 markers show immuno-expression in both groups. Expression of vimentin in amniotic epithelium was not observed in both control and study groups. It was found that the immune-expression differences between the groups in terms of amniotic epithelium were not as obvious as the cells in the Wharton gel, but statistically significant. Immune-expression of MSC-specific markers was encountered not only in Wharton gel, but also in the umbilical artery, umbilical vein and perivascular areas. Immune-expressions of CD44, CD90 and vimentin were found to be severely suppressed in the fetal cord umbilical arteries with CNS anomalies compared to the control group, but no statistically significant difference was found in CD29 and CD73 immuno-expressions. It has been determined that CNS anomalies increase CD29 immuno-expression in the umbilical vein, and decrease CD44, CD73, vimentin and CD90 immunoexpressions.
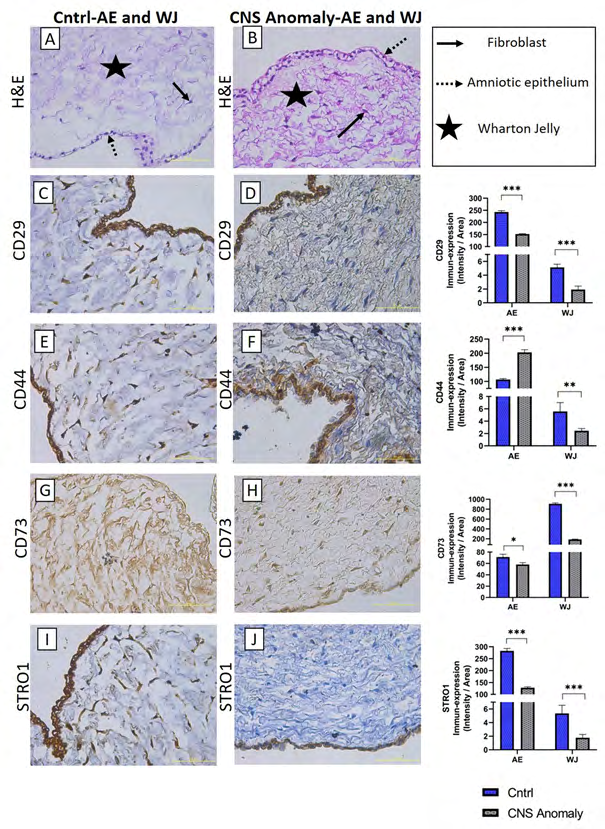
Figure 1: The general morphology of amniotic epithelium and Wharton jelly in groups is seen with hematoxylin-eosin staining (A-B). Immun-expressions and density/area significance analyzes (C-D) of CD29 between groups in amniotic epithelium and wharton jelly, immuno-expressions of CD44 between groups in amniotic epithelium and wharton jelly, and density/area significance analysis (E-F), Immun-expressions and density/area significance analyzes (G-H) of CD73 between groups in amniotic epithelium and wharton jelly and immuno-expressions of STRO1 in amniotic epithelium and wharton jelly between groups and density/area significance analyzes are given (I-J) . Scale bar 50µM and microscope magnification 40x.
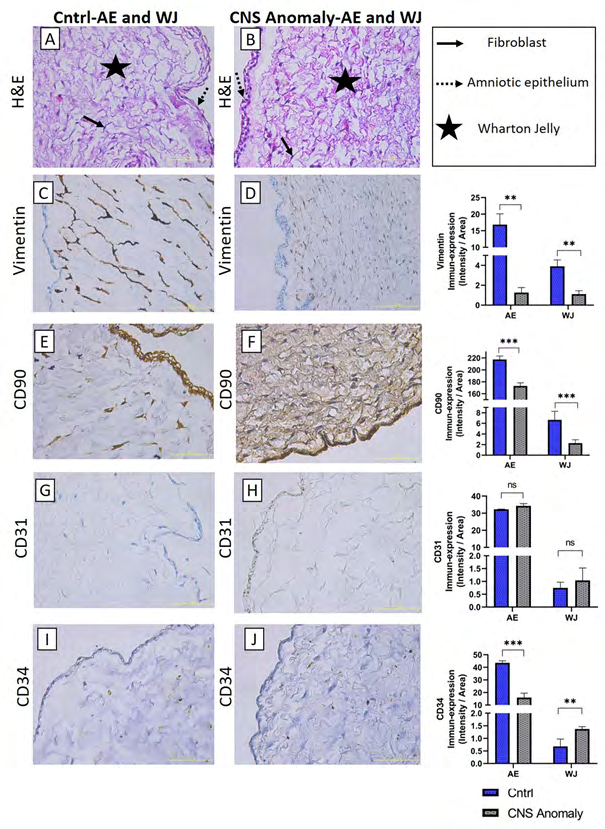
Figure 2: General morphology is seen with hematoxylin-eosin staining in amniotic epithelium and Wharton jelly (A-B). Immun-expressions and density/area significance analyzes (C-D) of vimentin marker between groups in amniotic epithelium and wharton jelly, immuno-expressions of CD90 between groups in amniotic epithelium and wharton jelly, and density/ area significance analysis (E-F), CD31 Immun-expressions and density/area significance analyzes (G-H) between groups in amniotic epithelium and wharton jelly and immuno-expressions and density/area significance analyzes of CD34 between groups in amniotic epithelium and wharton jelly are given (I-J). Scale bar 50µM and microscope magnification 40x.
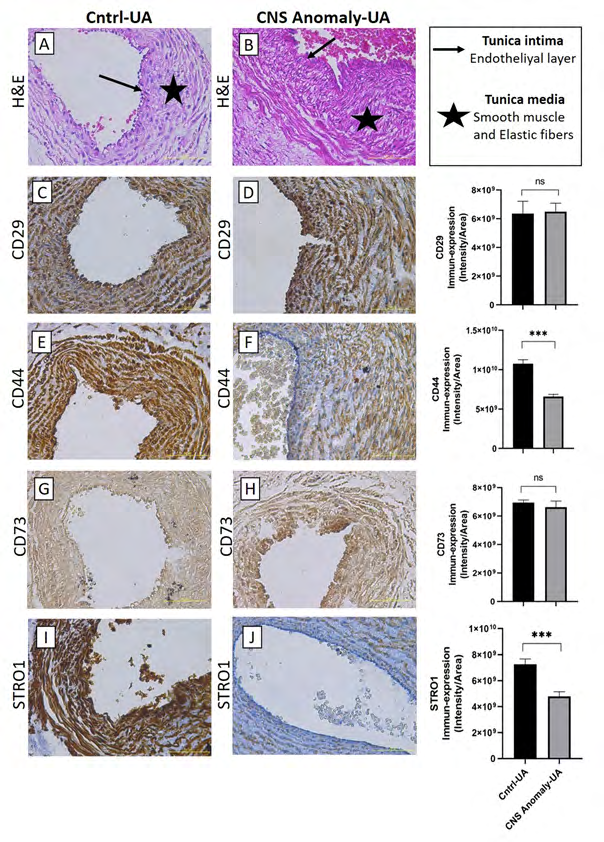
Figure 3: Hematoxylin-eosin staining in the umbilical artery and showing general morphology (A-B). Immun-expressions of CD29 in umbilical artery between groups and density/area significance analysis (C-D), immuno-expressions of CD44 in umbilical artery between groups and density/area significance analysis (E-F), immuno-expressions of CD73 in umbilical artery between groups and density/area significance analyzes (G-H) and immuno-expressions of STRO1 in the umbilical artery between groups and density/area significance analyzes (I-J) are given. Scale bar 50µM and microscope magnification 40x.
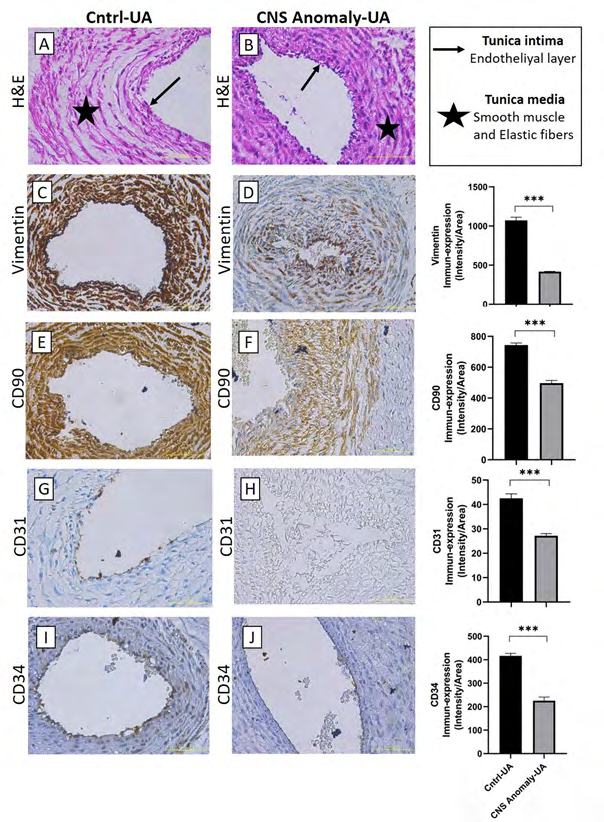
Figure 4: Hematoxylin-eosin staining in the umbilical artery of the control group and fetal cords with CNS anomalies and general morphology (A-B). Immun-expressions of Vimentin between groups in the umbilical artery and density/area significance analysis (C-D), immuno-expressions of CD90 between groups in the umbilical artery and density/area significance analysis (E-F), immune-expressions of CD31 between groups in the umbilical artery. And density/area significance analyzes (G-H) and immuno-expressions of CD34 in the umbilical artery between groups and density/area significance analyzes (I-J) are given. Scale bar 50µM and microscope magnification 40x.
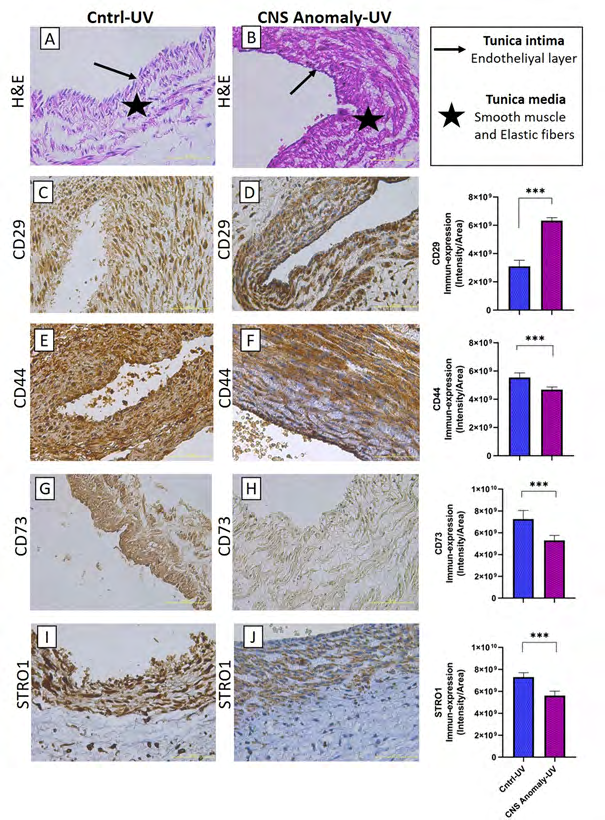
Figure 5: Hematoxylin-eosin staining in the umbilical vein of the control group and fetal cords with CNS anomalies and general morphology (A-B). Immune-expressions of CD29 between groups in the umbilical vein and density/area significance analysis (C-D), immuno-expressions of CD44 between groups in the umbilical vein and density/area significance analysis (E-F), immune-expressions of CD73 between groups in the umbilical vein and density/area significance analyzes (G-H) and immuno-expressions of STRO1 in the umbilical vein between groups and density/area significance analyzes (I-J). Scale bar 50µM and microscope magnification 40x.
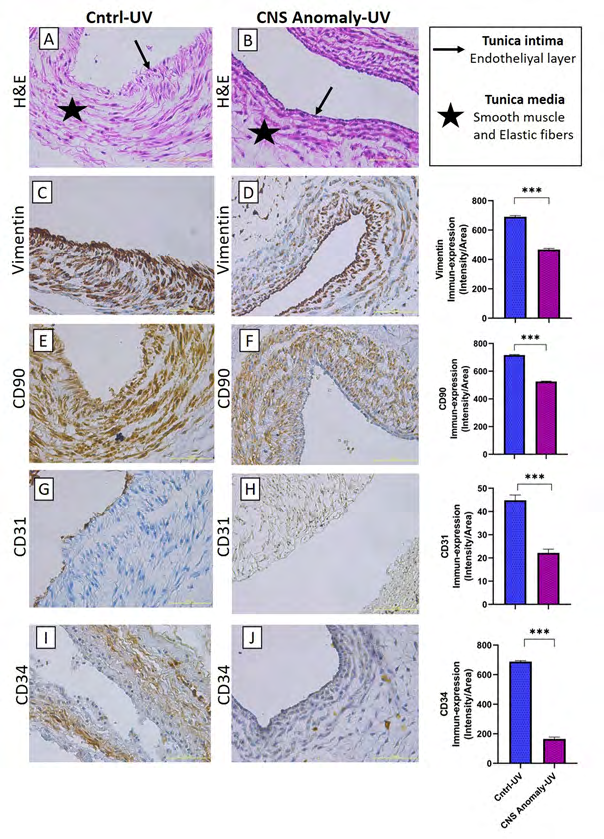
Figure 6: Hematoxylin-eosin staining in the umbilical vein of the control group and fetal cords with CNS anomalies and general morphology (A-B). Immun-expressions of Vimentin between groups in the umbilical vein and density/area significance analysis (C-D), immuno-expressions of CD90 between groups in the umbilical vein and density/area significance analysis (E-F), immune-expressions of CD31 between groups in the umbilical vein. And density/area significance analyzes (G-H) and immuno-expressions of CD34 in the umbilical vein between groups and density/area significance analyzes (I-J). Scale bar 50µM and microscope magnification 40x.
Immunohistochemical Analysis of STRO1, One of the Immature Pluripotent Mesenchymal Progenitor Cell Markers
CNS anomalies suppressed STRO-1 immuno-expressions in both amniotic epithelial regions and Wharton jelly. Similarly, STRO1 immuno-expressions in the umbilical artery and umbilical vein were much lower in the group with CNS anomalies compared to the control group. STRO1 immuno-expression was strongly expressed in the amniotic epithelium, Wharton gel and umbilical artery in the control group. STRO1 expression is moderate in the umbilical vein of the control group. In the group with CNS anomalies, STRO1 immuno-expression was found to be low in almost all of the amniotic epithelium, Wharton jelly, umbilical artery and umbilical vein.
Immunohistochemical Analysis of CD31, One of the Endothelial Progenitor Cell Markers
No statistically significant difference was found between CD31 immuno-expressions in amniotic epithelium and Wharton jelly in both control and CNS anomaly groups. It was found that CNS anomalies severely suppressed CD31 immuno-expression in the umbilical artery and umbilical vein.
Immunohistochemical Analysis of CD34, One of the Hematopoietic Cell Markers
Hematopoietic CD34 immune expressions were found to be under-expressed in both groups of amniotic epithelium and Wharton jelly. While severe immuno-expression was observed for the control group in the umbilical artery and umbilical veins, CD31 immuno-expression was suppressed in fetal umbilical cords with CNS anomalies.
Immunofluorescence Staining Analysis
CD29, CD90 and CD31 markers were compared with immunofluorescent stains in the control and study groups as in Figure 7.
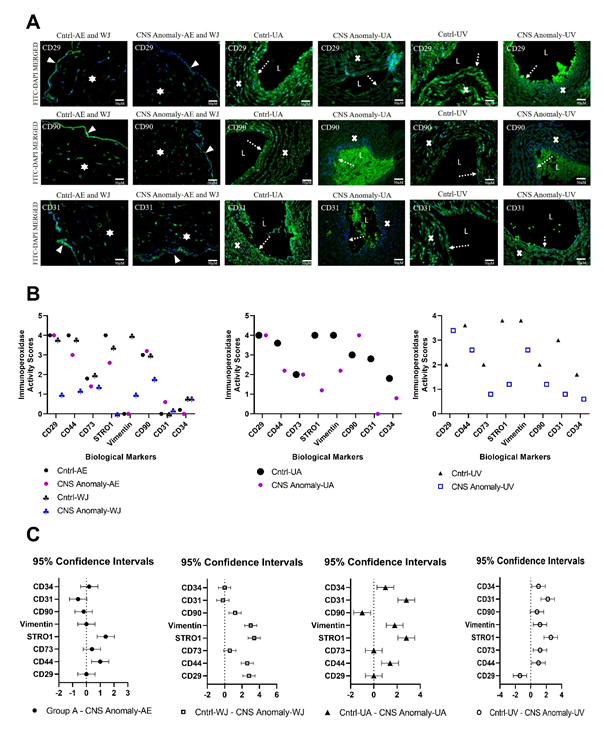
Figure 7: Among the groups, CD29, CD90 and CD31 immunofluorescence expressions are seen in the amniotic epithelium (AE), Wharton jelly (WJ), umbilical artery (UA) and umbilical vein (UV) regions. The solid white triangle symbol indicates the amniotic epithelium, the star symbol Wharton jelly, the dashed white arrow symbol the endothelial layer, the letter “L” UA and UV lumen, and the “x” symbol UA and the UV vessel wall. Microscope magnification 40x. Scale bar 50 µM (A). Immunoperoxidase activity scores between groups of biological markers in the AE, WJ, UA and UV regions are shown in the graph (B). 0: No expression, 1+: Mild expression, 2+: Moderate expression, 3+: High expression and 4+: Over expression. 95% CI was compared in fetal cords with control and CNS anomalies in the AE, WJ, UA and UV regions (C).
- umbilical artery in fetal cords with CNS anomaly, whereas there was no significant difference in umbilical vein.
- Semi-Quantitative
- Analysis of
- Immunoperoxidase
- Activities of
- Stem/
- Progenitor Cell Markers
- The stem/progenitor cell semi-quantitative analysis results for amniotic epithelium and Wharton jelly are given in Table 1.
- Marker
- Localization
- Mean of
- Cntrl
- Mean of CNS
- Anomaly
- Difference
- SE of difference t ratio df
- P Value
- CD29
- AE
- 243
- 152
- 90.6
- 3.4
- 26.7
- 4
- <0.001
- WJ
- 5.13
- 1.92
- 3.21
- 0.361
- 8.88
- 5
- <0.001
- CD44
- AE
- 107
- 203
- -96.2
- 5.91
- 16.3
- 4
- <0.001
- WJ
- 5.57
- 2.45
- 3.12
- 0.661
- 4.72
- 8
- 0.001
- CD73
- AE
- 71.2
- 58.2
- 13.1
- 3.44
- 3.8
- 4
- 0.02
- WJ
- 908
- 187
- 721
- 12.3
- 58.6
- 4
- <0.001
- STRO1
- AE
- 283
- 128
- 155
- 6.36
- 24.4
- 4
- <0.001
- WJ
- 5.34
- 1.78
- 3.57
- 0.58
- 6.15
- 8
- <0.001
- Vimentin
- AE
- 16.9
- 1.27
- 15.6
- 1.89
- 8.26
- 4
- 0.002
- WJ
- 3.91
- 1.11
- 2.79
- 0.416
- 6.72
- 4
- 0.003
- CD90
- AE
- 217
- 173
- 44,4
- 3,51
- 12,7
- 8,00
- <0,001
- WJ
- 6,66
- 2,28
- 4,38
- 0,780
- 5,61
- 8,00
- <0,001
- CD31
- AE
- 32.3
- 34.3
- -2.01
- 0.766
- 2.62
- 4
- 0.11
- WJ
- 0.747
- 1.04
- -0.292
- 0.237
- 1.23
- 8
- 0.25
- CD34
- AE
- 43.6
- 15.9
- 27.6
- 1.94
- 14.3
- 6
- <0.001
- WJ
- 0.681
- 1.37
- -0.689
- 0.154
- 4.47
- 7
- 0.003
Table 1: Comparison of stem / progenitor cell markers in amniotic epithelial (AE) and Wharton jelly (WJ) localizations between
After semi-quantitative analysis of density and area significance values, CD29, CD73, STRO1, vimentin, CD90 and CD34 immunoperoxidase activity in the amniotic epithelium of the control group was higher than the groups with CNS anomalies (p<0.05). CD44 and CD31 immunoperoxidase activity was found to be higher in amniotic epithelium of fetal umbilical cords with CNS anomalies compared to control. In the control group WJ, CD29, CD44, CD73, STRO1, vimentin and CD90 immunoperoxidase activity was higher than the groups with CNS anomalies (p<0.05). CD31 and CD34 immunoperoxidase activity was higher in Wharton jelly of fetal umbilical cords with CNS anomalies compared to control.
The stem/progenitor cell semi-quantitative analysis results for the umbilical artery are given in Table 2. CD29 immunoperoxidase activity in the umbilical artery did not differ significantly between the groups (p=0.76). CD44 immunoperoxidase activity was lower in the group with CNS anomaly compared to the control (p<0.001). There was no statistical difference between the groups in terms of CD73 immunoperoxidase activity (p=0.31). STRO1 immunoperoxidase activity was much higher in the control group (p<0.001). Vimentin, CD90, CD31 and CD34 immunoperoxidase activities were found to be higher in the control group than the group with CNS anomaly (p<0.001).
| Localization | Minimum | Median | Maximum | Mean | Std. Deviation | Std. Error of Mean | Lower 95% CI | Upper 95% CI | P value | |
|---|---|---|---|---|---|---|---|---|---|---|
| Cntrl-CD29 | UA | 5,19x10⁹ | 6,40x10⁹ | 7,71x10⁹ | 6,36x10⁹ | 8,63x10⁸ | 3,52x10⁸ | 5,45x10⁹ | 7,26x10⁹ | 0.76 |
| CNS Anomaly-CD29 | UA | 5,72x10⁹ | 6,82x10⁹ | 6,94x10⁹ | 6,49x10⁹ | 5,97x10⁸ | 2,44x10⁸ | 5,86x10⁹ | 7,12x10⁹ | 0.76 |
| Cntrl-CD44 | UA | 1,02x10¹⁰ | 1,07x10¹⁰ | 1,14x10¹⁰ | 1,08x10¹⁰ | 5,19x10⁸ | 2,59x10⁸ | 9,93x10⁹ | 1,16x10¹⁰ | <0.001 |
| CNS Anomaly-CD44 | UA | 6,25x10⁹ | 6,65x10⁹ | 6,83x10⁹ | 6,59x10⁹ | 2,78x10⁸ | 1,39x10⁸ | 6,15x10⁹ | 7,04x10⁹ | <0.001 |
| Cntrl-CD73 | UA | 6,73x10⁹ | 7,01x10⁹ | 7,09x10⁹ | 6,94x10⁹ | 1,86x10⁸ | 1,08x10⁸ | 6,48x10⁹ | 7,40x10⁹ | 0.31 |
| CNS Anomaly-CD73 | UA | 6,92x10⁹ | 7,13x10⁹ | 7,83x10⁹ | 7,25x10⁹ | 4,14x10⁸ | 2,07x10⁸ | 6,59x10⁹ | 7,91x10⁹ | 0.31 |
| Cntrl-STRO1 | UA | 4,27x10⁹ | 4,89x10⁹ | 5,20x10⁹ | 4,78x10⁹ | 3,55x10⁸ | 1,59x10⁸ | 4,34x10⁹ | 5,22x10⁹ | <0.001 |
| CNS Anomaly-STRO1 | UA | 5,19x10⁹ | 6,40x10⁹ | 7,71x10⁹ | 6,36x10⁹ | 8,63x10⁸ | 3,52x10⁸ | 5,45x10⁹ | 7,26x10⁹ | <0.001 |
| Cntrl-Vimentin | UA | 1028 | 1079 | 1109 | 1072 | 41.4 | 23.9 | 969 | 1175 | <0.001 |
| CNS Anomaly-Vimentin | UA | 414 | 416 | 420 | 417 | 3.25 | 1.87 | 409 | 425 | <0.001 |
| Cntrl-CD90 | UA | 730 | 740 | 759 | 744 | 13.5 | 6.03 | 727 | 760 | <0.001 |
| CNS Anomaly-CD90 | UA | 477 | 503 | 511 | 497 | 17.5 | 10.1 | 454 | 541 | <0.001 |
| Cntrl-CD31 | UA | 40.6 | 42.7 | 44.3 | 42.5 | 1.84 | 1.06 | 38 | 47.1 | <0.001 |
| CNS Anomaly-CD31 | UA | 26.3 | 27.3 | 28 | 27.2 | 0.866 | 0.5 | 25 | 29.3 | <0.001 |
| Cntrl-CD34 | UA | 406 | 419 | 426 | 417 | 10.2 | 5.89 | 391 | 442 | <0.001 |
| CNS Anomaly-CD34 | UA | 208 | 234 | 235 | 226 | 15.2 | 8.8 | 188 | 264 | <0.001 |
Table 2: Comparison of stem/progenitor cell markers between groups in the umbilical artery (UA) region and descriptive statistica
The stem/progenitor cell semi-quantitative analysis results for the umbilical vein are given in Table 3. CD29 immunoperoxidase activity was found higher in the umbilical vein of fetal cords with CNS anomaly compared to the control group (p <0.001). CD44, CD73, STRO1, Vimentin, CD90, CD31 and CD34 immunoperoxidase activities were higher in the control group than the group with CNS anomalies (p<0.001). Immunoperoxidase activity scores of stem/progenitor cell markers between the groups are given in Table 4, and the statistical comparisons of the scores of the markers and the 95% confidence interval (95% CI) between the groups are shown in Figure 7B and Figure 7C.
| Localization | Minimum | Median | Maximum | Mean | Std. Deviation | Std. Error of Mean | Lower 95% Cl | Upper 95% Cl | P value | |
|---|---|---|---|---|---|---|---|---|---|---|
| Cntrl-CD29 | UV | 2,37 x10⁹ | 3,20 x10⁹ | 3,49 x10⁹ | 3,10 x10⁹ | 4,32 x10⁸ | 1,93 x10⁸ | 2,56,109 | 3,63 x10⁹ | <0.001 |
| CNS Anomaly-CD29 | UV | 6,07 x10⁹ | 6,26 x10⁹ | 6,64 x10⁹ | 6,33 x10⁹ | 2,15 x10⁸ | 9,59 x10⁷ | 6,06,109 | 6,59 x10⁹ | <0.001 |
| Cntrl-CD44 | UV | 5,09 x10⁹ | 5,56 x10⁹ | 5,96 x10⁹ | 5,55 x10⁹ | 3,22 x10⁸ | 1,31 x10⁸ | 5,21,109 | 5,88 x10⁹ | <0.001 |
| CNS Anomaly-CD44 | UV | 4,51 x10⁹ | 4,64 x10⁹ | 4,99 x10⁹ | 4,68 x10⁹ | 1,88 x10⁸ | 7,68 x10⁷ | 4,49,109 | 4,88 x10⁹ | <0.001 |
| Cntrl-CD73 | UV | 6,06 x10⁹ | 7,21 x10⁹ | 8,39 x10⁹ | 7,25 x10⁹ | 7,97 x10⁸ | 3,25 x10⁸ | 6,41,109 | 8,09 x10⁹ | <0.001 |
| CNS Anomaly-CD73 | UV | 4,62 x10⁹ | 5,40 x10⁹ | 5,87 x10⁹ | 5,29 x10⁹ | 4,61 x10⁸ | 1,63 x10⁸ | 4,91,109 | 5,68 x10⁹ | <0.001 |
| Cntrl-STRO1 | UV | 6,70 x10⁹ | 7,52 x10⁹ | 7,65 x10⁹ | 7,3 x10⁹ | 4,02 x10⁸ | 1,8 x10⁸ | 68,109 | 7,79 x10⁹ | <0.001 |
| CNS Anomaly-STRO1 | UV | 2,37 x10⁹ | 3,20 x10⁹ | 3,49 x10⁹ | 3,10 x10⁹ | 4,32 x10⁸ | 1,93 x10⁸ | 2,56,109 | 3,63 x10⁹ | <0.001 |
| Cntrl-Vimentin | UV | 682 | 690 | 700 | 691 | 8.66 | 5 | 669 | 712 | <0.001 |
| CNS Anomaly-Vimentin | UV | 461 | 463 | 476 | 467 | 8.03 | 4.64 | 447 | 487 | <0.001 |
| Cntrl-CD90 | UV | 712 | 716 | 723 | 716 | 4.04 | 1.81 | 711 | 721 | <0.001 |
| CNS Anomaly-CD90 | UV | 522 | 525 | 530 | 525 | 3.16 | 1.41 | 521 | 529 | <0.001 |
| Cntrl-CD31 | UV | 42.7 | 44.4 | 47.3 | 44.8 | 2.29 | 1.32 | 39.1 | 50.5 | <0.001 |
| CNS Anomaly-CD31 | UV | 21 | 21.7 | 24 | 22.2 | 1.56 | 0.903 | 18.3 | 26.1 | <0.001 |
| Cntrl-CD34 | UV | 680 | 690 | 694 | 688 | 7.21 | 4.16 | 670 | 706 | <0.001 |
| CNS Anomaly-CD34 | UV | 157 | 157 | 180 | 165 | 13.3 | 7.67 | 132 | 198 | <0.001 |
Table 3: Comparison of stem / progenitor cell markers between groups in the umbilical vein (UV) region and descriptive statistica
| Immunoperoxidase Activity Scores | ||||||||
|---|---|---|---|---|---|---|---|---|
| Control Groups | CNS Anomaly Groups | |||||||
| Localizations | ||||||||
| AE (Mean+SD) | WJ (Mean+SD) | UA (Mean+SD) | UV (Mean+SD) | AE (Mean+SD) | WJ (Mean+SD) | UA (Mean+SD) | UV (Mean+SD) | |
| Markers | ||||||||
| CD29 | 4+0 | 3.8+0.4 | 4+0 | 2+0 | 4+0 | 1+0.7 | 4+0 | 3.4+0.5 |
| CD44 | 4+0 | 3.8+0.4 | 3.6+0.5 | 3.6+0.5 | 3+0 | 1.2+0.4 | 2.2+0.4 | 2.6+0.5 |
| CD73 | 1.8+0.4 | 2+0 | 2+0 | 2+0 | 1.4+0.5 | 1.4+0.5 | 2+0 | 0.8+0.4 |
| STRO1 | 4+0 | 3.4+0.5 | 4+0 | 3.8+0.4 | 2.6+0.8 | 0+0 | 1.2+0.4 | 1.2+0.4 |
| Vimentin | 0+0 | 4+0 | 4+0 | 3.8+0.4 | 0 | 1+0 | 2.2+0.8 | 2.6+0.5 |
| CD90 | 3+0.7 | 3+0.7 | 3+0 | 2+0 | 3.2+0.4 | 1.8+0.4 | 4+0 | 1.2+0.4 |
| CD31 | 0+0 | 0+0 | 2.8+0.8 | 3+0.7 | 0.6+0.5 | 0.2+0.4 | 0+0 | 0.8+0.4 |
| CD34 | 0.2+0.4 | 0.8+0.4 | 1.8+1 | 1,6+0.5 | 0+0 | 0.8+0.4 | 0.8+0.4 | 0.6+0.5 |
Table 4: Immunoperoxidase activity scores of biological markers between groups are given.
Discussion
Fetal anomalies are one of the main causes of perinatal deaths and bring along major permanent disorders and health problems [13]. CNS anomalies such as hydrocephalus, spina bifida, encephalopathy during fetal period result in miscarriages or obligatory removal of the fetus. These anomalies have negative effects on the placenta and umbilical cord. In the study conducted by Nasiel J, et al. [14], it appears in the literature that disorders in the placenta and umbilical cord are associated with hypoxic ischemic encephalopathies in newborns [14]. Well-functioning placenta and umbilical cord are very important for the healthy development and normal birth of the fetus. Placenta plays a very important key role in fetal and neonatal mortality and morbidity [1, 15]. The relationship of placental pathologies with brain damage in infants has been investigated by Harteman JC, et al. [16]. Especially encephalopathy due to hypoxic ischemia has been reported to be associated with umbilical cord and placenta. CNS anomalies such as hydrocephalus, meningomyelocele, Dandy-Walker malformations and holoprosencephaly cause abortion of the fetus and create serious defects in the umbilical cord. With the study reported by Nyberg DA, et al. [17], there are more CNS malformations and more chromosomal disorders in fetuses with a single umbilical artery as a result of CNS anomaly compared to those with double umbilical artery. Myelomeningocele, one of the CNS anomalies, causes fetuses to be born with severe congenital defects or fetal deaths.
These relations between umbilical cord and CNS anomalies have led us to think that they may have some negative effects on mesenchymal, hematopoietic and endothelial stem/progenitor cells in the umbilical cord of fetuses with CNS anomalies in terms of specific stem cell markers. Therefore, in this study, how the stem/progenitor cell immunophenotypes in the umbilical artery, umbilical vein, Wharton jelly and amniotic epithelium change in CNS anomalies were examined. Today, in regenerative medicine, we see that mesenchymal stem cells are obtained from fetal sources such as cord blood, Wharton’s jelly and extra- embryonic tissues, and are investigated in animal models, especially in applications such as regenerative medicine and tissue engineering [5, 18, 19, 20]. In our study, when the CD29, CD44, CD73 and CD90 markers, which are MSC markers, were compared, it was observed that CNS anomalies had a significant suppressive effect on MSCs, especially in Wharton jelly. While CD29, CD73 and CD90 protein expressions were found to be low in amniotic epithelium in fetal cords with CNS anomaly, CD44 expression was higher than control. When the MSC profile in the umbilical artery area was examined, it was found that CD44 and CD90 expressions decreased significantly in fetus cords with CNS anomalies. It has been observed that CNS anomalies suppress CD44, CD73 and CD90 immunoexpressions of MSCs in the umbilical vein region of the umbilical cord.
It is revealed by Alrefaei GI, et al. [21] that maternal age affects CD29 and CD105 immune expressions of mesenchymal stem cells in umbilical cord tissue. The researchers reported that as maternal age progressed, MSC markers CD29 and CD105 protein expressions decreased in the umbilical cord. As the maternal age progresses, the risk of fetal anomalies to increase is obvious. Especially, CNS anomalies are common, and expression of MSC markers may be decreasing, as in our study, perhaps for this reason. The findings we obtained in this study conducted with the cords of fetuses aged between 12-20 weeks showed us that CNS anomalies disrupted MSS immunophenotypes in the umbilical cord. In addition, the suppressive effects of CNS anomalies on the immune expression of vimentin, one of the MSC markers in the umbilical cord tissue, showed that our results were consistent. These findings obtained by immunohistochemical analyzes were also supported by immunofluorescent staining. In addition, STRO1 protein expressions, a marker in pluripotent stem cells, were found to be severely suppressed in both Wharton gel and umbilical vessel perivascular areas in fetal umbilical cords with CNS anomalies. A similar situation is valid for the immune expression of CD34, which is one of the hematopoietic stem cell markers, and CD31, which is one of the endothelial cell markers.
According to these results, it is understood that CNS anomalies significantly impair mesenchymal, endothelial, hematopoietic and pluripotent cell markers in umbilical cord tissue in fetuses of 12-20 weeks of age. Regenerative recovery of MSC immunophenotypes impaired in central nervous system anomalies is important in this respect. Therefore, the regulation of the microenvironment in the umbilical cord tissue with healthy MSCs or their secretion factors may play a vital role in preventing fetal abortions and feeding the fetus without any hypoxic-ischemic condition through the umbilical artery and umbilical vein. Wang A, et al. [8] reported that placental mesenchymal stem cells showed a significantly greater healing potential when compared to adult bone marrow mesenchymal stem cells in their study to repair in-utero defects using placental mesenchymal stromal cells in sheep myelomeningoceles [22].
Extra-embryonic tissues such as placenta, umbilical cord, amniotic fluid or amniotic membrane are rich sources of fetal stem cells [23, 24]. It has been reported that the cellular content and early neuroepithelial markers in the amniotic fluid are important in the pathological development of myelomeningoceles in rats [25]. Frozen umbilical cord veils are shown as a regenerative resource in the repair of in-utero spina bifida [26]. It can be thought that this regeneration is achieved thanks to the rich stem cells in the matrix of the umbilical cord. The umbilical cord is a rich source of stem cells. Stem cells in the umbilical cord have specific stem cell markers and are important cell sources used therapeutically today and even in banking. It is known that its regeneration capacity is higher than adult stem cells. It has been discussed in this literature information that CNS anomalies are associated with fetal death or separation of the placenta and umbilical cord from the uterus [27].
In the literature, it has been stated that CNS anomalies cause the fetus to leave the uterus, but it has not been investigated whether there is a defect or deterioration in the umbilical cord stem cells when or before leaving the uterus [28, 29, 30]. These reported information led us to think that CNS anomalies may negatively affect specific markers in umbilical cord stem cells. Therefore, in this study, immunophenotypic changes in surface membrane markers of stem cells in umbilical cords of fetuses taken with 12-20 weeks of CNS anomaly were analysed immunohistochemically to show stem cell specific markers according to tissue level localization. In our study, separate profiling of mesenchymal, hematopoietic, pluripotent and endothelial cells in the umbilical cord of fetuses with CNS anomalies was provided. The use of healthy umbilical cord-derived mesenchymal stem cells for regenerative medicine in CNS injuries or defects, which are very important clinically, may have an effect on the health of the baby in the newborn and prenatal period. In this study, the effects of CNS anomalies on the umbilical cord stem cell niches were revealed. Our results reveal a new perspective in this area. The effects of CNS anomalies on the stem/ progenitor cell profile in the fetal umbilical cord have been demonstrated for the first time in this study.
Conclusion
Our data from this study showed that CNS pathologies significantly affect some specific stem cell markers in the umbilical cord. In this context, it may be planned to carry out further studies on the interaction of central dysplasia and stem cell profile at the cell culture and molecular level in the future. Interaction mechanisms can be evaluated by specific signalling pathways.
Acknowledgment
This study was supported by the Beykent University Scientific Research Projects support fund. This study was approved by the Health Sciences University Istanbul Training and Research Hospital clinical research ethics committee on 21.12.2018 with the decision number “1609”. Authors thank to this institution for its support.
Conflict of interest
No potential conflict of interest was reported by the authors.
References
-
Pinar H, Carpenter M (2010) Placenta and umbilical cord abnormalities seen with stillbirth. Clin Obstet Gynecol 53(3): 656-672.
-
Aydın E, Tanacan A, Büyükeren M, Uçkan H, Yurdakök M, et al. (2019) Congenital central nervous system anomalies: Tenyear single center experience on a challenging issue in perinatal medicine. J Turk Ger Gynecol Assoc 20(3): 170-177.
-
Icenogle DA, Kaplan AM (1981) A review of congenital neurologic malformations. Clin Pediatr (Phila) 20(9): 565-576.
-
De Noronha L, Medeiros F, Martins VD, Sampaio GA, Serapião MJ, et al. (2000)Malformations of the central nervous system: analysis of 157 pediatric autopsies. Arq Neuropsiquiatr 58(3B): 890-896.
-
Abdulrazzak H, Moschidou D, Jones G, Guillot PV (2010) Biological characteristics of stem cells from foetal, cord blood and extraembryonic tissues. J R Soc Interface 7(S6): 689-706.
-
Beeravolu N, McKee C, Alamri A, Mikhael S, Brown C, et al. (2017) Isolation and Characterization of Mesenchymal Stromal Cells from Human Umbilical Cord and Fetal Placenta. J Vis Exp 122: 55224.
-
Sarugaser R, Lickorish D, Baksh D, Hosseini MM, Davies JE (2005) Human umbilical cord perivascular (HUCPV) cells: a source of mesenchymal progenitors. Stem Cells 23(2): 220-229.
-
Wang A, Brown EG, Lankford L, Keller BA, Pivetti CD, et al. (2015) Placental Mesenchymal Stromal Cells Rescue Ambulation in Ovine Myelomeningocele. Stem Cells Transl Med 4(6): 659-669.
-
Anzalone R, Iacono L, Corrao S, Magno F, Loria T, et al. (2010) New emerging potentials for human Wharton’s jelly mesenchymal stem cells: immunological features and hepatocyte-like differentiative capacity. Stem Cells Dev 19(4): 423-438.
-
Hu CH, Li ZM, Du ZM, Zhang AX, Yang DY, et al. (2009) Human umbilical cord-derived endothelial progenitor cells promote growth cytokines-mediated neorevascularization in rat myocardial infarction. Chin Med J (Engl) 122(5): 548-555.
-
Trivanović D, Kocić J, Mojsilović S, Krstić A, Ilić V, et al. (2013) Mesenchymal stem cells isolated from peripheral blood and umbilical cord Wharton’s jelly. Srp Arh Celok Lek 141(3-4): 178-186.
-
Ishige I, Nagamura T, Honda J, Harnprasopwat R, Kido M, et al. (2009) Comparison of mesenchymal stem cells derived from arterial, venous, and Wharton’s jelly explants of human umbilical cord. Int J Hematol 90(2): 261-269.
-
Melcer Y, Svirsky R, Vaknin Z, Tavor OL, Feldman N, et al. (2017) Fetal abnormalities leading to termination of twin pregnancies: the 17-year experience of a single medical center. J Matern Fetal Neonatal Med 30(3): 347- 351.
-
Nasiel J, Papadogiannakis N, Löf E, Elofsson F, Hallberg B (2016) Hypoxic ischemic encephalopathy in newborns linked to placental and umbilical cord abnormalities. J Matern Fetal Neonatal Med 29(5):721-726.
-
Pinar H, Goldenberg RL, Koch MA, Hall JH, Hawkins HK, et al. (2014) Placental findings in singleton stillbirths. Obstet Gynecol 123(2 Pt 1): 325-336.
-
Harteman JC, Nikkels PG, Benders MJ, Kwee A, Groenendaal F, et al. (2013) Placental pathology in full-term infants with hypoxic-ischemic neonatal encephalopathy and association with magnetic resonance imaging pattern of brain injury. J Pediatr 163(4): 968-995.
-
Nyberg DA, Shepard T, Mack LA, Hirsch J, Luthy D, et al. (1988) Significance of a Single Umbilical Artery in Fetuses With Central Nervous System Malformations. J Ultrasound Med 7(5): 265-273.
-
Mihu CM, Mihu D, Costin N, Ciucă DR, Suşman S, et al. (2008) Isolation and characterization of stem cells from the placenta and the umbilical cord. Rom J Morphol Embryol 49(4): 441-446.
-
Romanov A, Svintsitskaya A, Smirnov N (2003) Searching for alternative sources of postnatal human mesenchymal stem cells: candidate MSC-like cells from umbilical cord. Stem Cells 21(1): 105-110.
-
Weiss ML, Troyer DL (2006) Stem Cells in the Umbilical Cord. Stem Cell Rev 2(2): 155-162.
-
Alrefaei GI, Ayuob NN, Ali SS, Karim SA (2015) Effects of maternal age on the expression of mesenchymal stem cell markers in the components of human umbilical cord. Folia Histochem Cytobiol 53(3): 259-271.
-
Wang S, Hung C, Peng T, Huang CC, Wei HM, et al. (2004) Mesenchymal stem cells in the Wharton’s jelly of the human umbilical cord. Stem Cells 22(7): 1330-1337.
-
Shieh HF, Ahmed A, Rohrer L (2018) Donor mesenchymal stem cell linetics after transamniotic stem cell therapy (TRASCET) for experimental spina bifida. J Pediatr Sur 53(6):1134-1136.
-
Sagar R, Jallow LW, David AL, Götherström C, Westgren M (2018) Fetal Mesenchymal Stromal Cells: an Opportunity for Prenatal Cellular Therapy. Curr Stem Cell Rep 4(1): 61-68.
-
Zieba J, Miller A, Gordiienko O, Smith GM, Krynska B (2017) Clusters of amniotic fluid cells and their associated early neuroepithelial markers in experimental myelomeningocele: Correlation with astrogliosis. PLoS One 12(3): e0174625.
-
Papanna R, Moise Jr KJ, Mann LK, Fletcher S, Schniederjan R, et al. (2016) Cryopreserved human umbilical cord patch for in-utero spina bifida repair. Ultrasound Obstet Gynecol 47(2): 168-176.
-
Weiss ML, Medicetty S, Bledsoe AR, Rachakatla RS, Choi M, et al. (2006) Human umbilical cord matrix stem cells: preliminary characterization and effect of transplantation in a rodent model of Parkinson’s disease. Stem Cells 24(3): 781-792.
-
Steinberg A (2003) Abortion for fetal CNS malformations: religious aspects. Childs Nerv Syst 19(7-8): 592-595.
-
Barel O, Vaknin Z, Smorgick N, Reish O, Mendlovic S, et al. (2009) Fetal abnormalities leading to third trimester abortion: nine-year experience from a single medical center. Prenat Diagn 29(3): 223-228.
-
Morris RK, Mackie F, Garces AT, Knight M, Kilby MD (2020) The incidence, maternal, fetal and neonatal consequences of single intrauterine fetal death in monochorionic twins: A prospective observational UKOSS study. PLoS One 15(9): e0239477.
- Research Progress of Induced Pluripotent Stem Cells and Their Clinical Application Prospects
- Nishan Al-Kamal is the Starting Point of A Feminist Scientist
- Current Concepts and Future Perspectives of Stem Cell Therapy in Peripheral Arterial Disease
- Stem Cell and Oxidative Stress-Inflammation Cycle
- Adipose Derived Mesenchymal Stem Cells Origin, Characteristics and Promises
- Mitochondria Targeted Antioxidants can Improve In Vitro Embryo Production in Buffalo