Factors that Affect the Incidence of Babesia and Blood Donor Testing in Select States: A Regression Analysis
Aims: Babesiosis is a serious health concern that has resulted in fatalities and more than two hundred cases of transfusiontransmitted Babesiosis (TTB) in the United States. A study was conducted to identify climate factors that affect the number of cases of Babesia, and in addition pinpoint factors that may have impacted required testing on blood donors in select states. Methods: Logistic regression was performed using state as the dependent variable, and babesia cases and deaths as predictor variables. Multiple regression was performed using babesia cases as the dependent variable and temperature and precipitation as predictor variables. Cases of Babesia by state was accessed from the CDC for the years 2011-2020. Monthly climate data was accessed from the Northeast Regional Climate Center for the same timeframe. The number of deaths from Babesia was retrieved from state health departments. Statistical significance was set at P
Introduction
Babesia is one of the most common vector-borne diseases in the United States. It is transmitted through the bite of a Ixodes tick, via solid organ transplantation, or transfusion of a blood product from an infected donor constituting a public health threat. There have been more than 200 cases of transfusion transmitted babesiosis (TTB) reported in the US [1] with Babesia microti identified as causing the majority of cases; this species is endemic in the midwestern and northeastern regions of the US [2]. Another species of Babesia that has been associated with TTB is Babesia duncani, albeit with much less frequency [3]. Babesia infects red blood cell products in refrigeration and freezer storage; B. microti has been shown to remain viable at 4˚C and survive up to 35 days in RBCs, and indefinitely in cryopreserved RBCs [4]. Symptoms present one to four weeks after infection for tick transmission [from one to nine weeks for TTB, which can extend to six months] and include fever, chills, sweats, headache, nausea, fatigue, and loss of appetite [5]. Immunocompromised persons are particularly vulnerable for life threatening clinical manifestations comprising coagulopathies such as DIC (Disseminated Intravascular Coagulation), splenomegaly, hepatomegaly, renal failure, liver failure, and heart failure resulting in death [6]. Most persons infected are asymptomatic which is a prime concern for blood donation facilities.
The rates of Babesiosis have been on the rise in the US, increasing 9 percent per year from 2015 to 2022 [7]. In 2019, the FDA published recommendations for blood centers regarding donor screening and donor deferral for Babesia. Briefly, blood centers must test each donation for evidence of Babesia in Connecticut, Delaware, Maine, Maryland, Massachusetts, Minnesota, New Hampshire, New Jersey, New York, Pennsylvania, Rhode Island, Vermont, Virginia, Wisconsin, and Washington DC using a licensed nucleic amplification test (NAT). Donors found to have a reactive test for Babesia are deferred from donating blood for 2 years. Moreover, states that do not test for Babesia or employ pathogen-reduction techniques must revise their donor history questionnaire asking prospective donors if they have ever had a positive test result for Babesia [8].
It is prudent to identify factors that can be linked to a disease and moreover may play a role in revising donor screening processes. Findings may be of value for other related processes and therefore a study was conducted evaluating factors thought to affect cases of Babesia as well as donor testing using logistic regression and multiple regression.
Methods
A logistic regression analysis was conducted employing states as the unit of analysis. The dependent variable was a dichotomous, coded 1 for states required to perform donor testing for Babesia, or 0 for states not required to perform testing. Cases of Babesia [9] as well as reported deaths served as the independent variables. Alaska, Colorado, Hawaii, Idaho, Mississippi, Nevada, New Mexico, North Carolina, Oklahoma, and Pennsylvania were excluded as health providers in these states are not required to report cases of Babesia to state health departments. The time period studied was 2011 to 2020. A multiple regression study was also conducted using the number of Babesia cases as the dependent variable; average precipitation (%) and temperature (˚F) for all months for the years 2011 through 2020, served as the independent variables. Temperature and precipitation data were accessed from the Northeast Regional Climate Center and converted to overall averages by state. SPSS (v29) was used for all analyses. The number of deaths from Babesia were accessed from the CDC and state health departments. The level of significance was set at P<.05.
Results
Data analysed in the study are presented in Table 1. Logistic regression analysis showed statistical significance with the number of deaths (P=0.005) and an odds ratio of 14. The beta coefficient was positive indicating a direct relationship. This can be interpreted as the probability of a state required to test prospective blood donors for Babesia increases by a factor of 14 with a one unit increase in the number of deaths. The Hosmer and Leme show test were also done by SPSS indicating an acceptable goodness of fit (P>0.05).
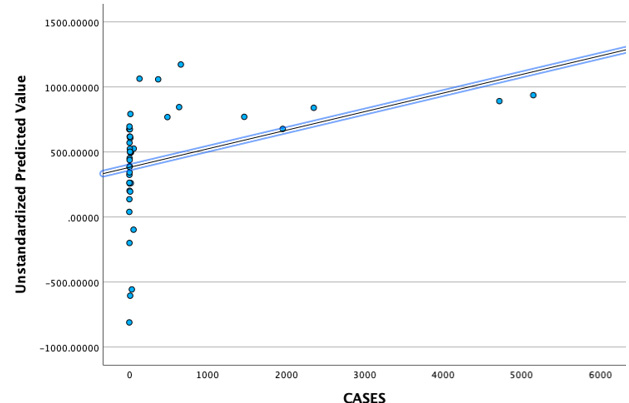
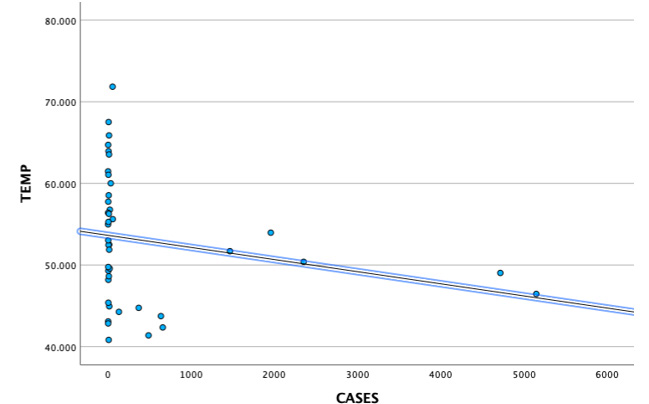
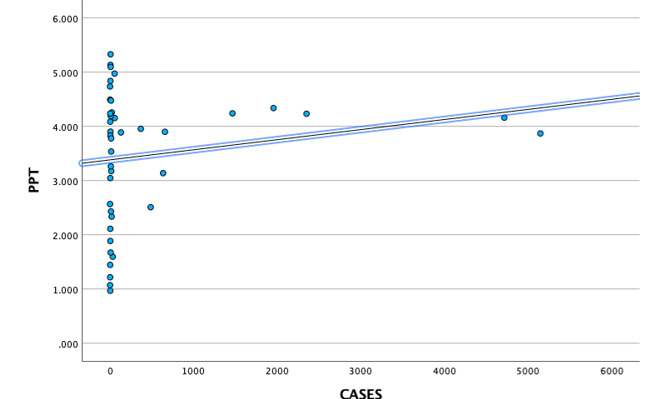
The multiple regression analysis revealed that both temperature and precipitation were statistically significant (P<.05). The Cooks Distance parameter yielded a range of 0.000 to 0.3 negating the presence of outliers. Figure 1 depicts the unstandardized predictor values parameter from the multiple regression analysis versus the number of cases revealing a correlation coefficient of 0.37 which was statistically significant (P<.05). The VIF (variance inflation factor) was 1.26 for both predictor variables indicating temperature and precipitation were not collinear. The beta coefficient was negative (-55.0) for temperature aligning to an inverse relationship Figure 2, for the precipitation variable the beta coefficient was positive (328) indicating a direct relationship Figure 3.
| State | Cases | Deaths | Temp˚ F | PPT (%) | Donor Testing for Babesia |
|---|---|---|---|---|---|
| AL | 5 | 0 | 63.9 | 5.1 | NO |
| AZ | 0 | 0 | 61.4 | 1 | NO |
| AR | 4 | 1 | 61 | 4.8 | NO |
| CA | 32 | 0 | 60 | 1.5 | NO |
| CT | 2351 | 1 | 50.3 | 4.2 | YES |
| DE | 21 | 1 | 56.7 | 4.2 | YES |
| FL | 54 | 0 | 71.8 | 4.9 | NO |
| GA | 1 | 0 | 64.7 | 4.4 | NO |
| IL | 13 | 0 | 52.4 | 3.5 | NO |
| IN | 5 | 0 | 52.4 | 3.9 | NO |
| IA | 3 | 0 | 48.1 | 3 | NO |
| KS | 0 | 0 | 54.9 | 2.5 | NO |
| KY | 0 | 0 | 56.4 | 4.7 | NO |
| LA | 6 | 0 | 67.5 | 5.3 | NO |
| ME | 657 | 1 | 42.3 | 3.8 | YES |
| MD | 56 | 1 | 55.6 | 4.1 | YES |
| MA | 4716 | 2 | 49 | 4.1 | YES |
| MI | 14 | 0 | 44.9 | 3.1 | NO |
| MN | 486 | 6 | 41.3 | 2.5 | YES |
| MO | 4 | 1 | 55.2 | 3.8 | NO |
| MT | 1 | 0 | 43 | 1.4 | NO |
| NE | 3 | 0 | 49.2 | 2.1 | NO |
| NH | 368 | 0 | 44.7 | 3.9 | YES |
| NJ | 1956 | 2 | 53.9 | 4.3 | YES |
| NY | 5148 | 5 | 46.4 | 3.8 | YES |
| ND | 7 | 0 | 40.8 | 1.6 | NO |
| OH | 13 | 0 | 51.8 | 3.7 | NO |
| OR | 19 | 0 | 49.5 | 2.3 | NO |
| RI | 1465 | 4 | 51.6 | 4.2 | YES |
| SC | 11 | 0 | 63.5 | 4.4 | NO |
| SD | 3 | 0 | 45.3 | 1.8 | NO |
| TN | 7 | 0 | 58.5 | 5 | NO |
| TX | 11 | 0 | 65.8 | 2.4 | NO |
| UT | 2 | 0 | 49.7 | 0.9 | NO |
| VT | 130 | 0 | 44.2 | 3.8 | YES |
| VA | 9 | 0 | 56.2 | 4.1 | YES |
| WA | 9 | 0 | 48.6 | 3.2 | NO |
| WV | 2 | 0 | 53 | 4.2 | NO |
| WI | 635 | 3 | 43.7 | 3.1 | YES |
| WY | 1 | 0 | 42.8 | 1.2 | NO |
| DC* | 2 | 0 | 57.7 | 4 | YES |
Table: Data *The District of Columbia was included as testing blood donors for Babesia is required.
Discussion
This study found that the number of Babesia deaths was statistically significant in ascertaining what factors could have influenced the selection of states in regard to required donor testing for Babesia. Minnesota had the highest number of deaths followed by New York, Rhode Island, Wisconsin, Massachusetts, and New Jersey. Tonnetti et al conducted a study on blood donors in Minnesota across 31 counties during the summer months to ascertain B. microtisero prevalence. Between 2010 and 2011, 2,150 donors were tested by immunofluorescence assay (IFA) and real-time PCR. Two percent of donors were found to be positive [10]. Johnson et al conducted a similar study on prospective blood donors in Connecticut and Massachusetts during the time period of 2000 to 2007. In this study, testing was limited to IFA and seropositivity for the state of Connecticut was 112.4 per 10,000 donors and for the state of Massachusetts 140.4 per 10,000 donors. Testing was done year-round and in assessing seasonality the positive results were significantly higher in the summer months [11]. These findingshighlighted the salient concern Babesia seropositivity in blood donors presents; the asymptomatic nature of Babesia means that blood in inventory of a transfusion service could be contaminated without a licensed screening test in place to detect Babesia infection. A year before the FDA published its recommendations for blood centers they approved the Immugen Babesia microti/Arrayed IFA test and the Immugen Babesia microti NAT [12] setting the stage for use of licensed tests in select states.
No studies could be identified pinpointing factors in a statistical design that were associated with required testing on blood donors in northeastern and midwestern states. However, Bloch et al offered a rationale on the delay in implementing testing for Babesia articulating that manufacturers may have been reticent to produce a licensed screening test due to the experience with Chagas disease. Universal screening for Chagas disease changed from testing all donors to only testing first-time donors based on low transmission, greatly curtailing the need for assays [13]. Once assays for Babesia were finally available and licensed, implementation of the FDA recommendations proceeded resulting in a decrease in TTB [14].
A multiple regression analysis identified average temperature and precipitation as significant factors affecting the number of Babesia cases. The average temperature across all months in the period of 2011-2020 ranged from 41.3˚F to 57.7˚F in states where donor screening for Babesia is required, compared to 40.8˚F to 71.8˚F in states where donor screening is not required. Looking at states with the highest number of cases such as Connecticut, Massachusetts, and New York the average temperatures were 50.3˚F, 49˚F, and
46.4˚F, respectfully. In contrast, higher average temperatures (63.9˚F, 64.7˚F, 67.5˚F) aligned to states with considerably lower numbers of cases such as Alabama, Georgia, and Louisiana, respectively. While this comparison elucidates and helps to explain the inverse relationship found with regard to the predictor variable temperature in this study, it is prudent to emphasize that the average temperatures were reflective of all twelve months for the years 2011-2020; as Babesia transmission is known to occur more frequently in the summer months, states with the highest number of cases such as those listed above are known to have higher temperatures in months May thru August falling within the range of 59˚F and 86˚F.Researchers have posited Ixodes ticks are most active within this range [15, 16].
Precipitation was also a significant factor in this study exhibiting a direct relationship. Jones and Kitron conducted a study from 1990 to 1997 to ascertain if drought had an effect on Ixodes scapularis activity in northern Illinois. They found that cumulative rainfall was positively correlated with tick abundance, compared to drought years where tick densities were significantly depressed [17]. Berger et al conducted a study in Rhode Island analysing relative humidity at three different sites (Scituate Reservoir, Arcadia, and Burlingame). The study period was 2009 to 2010. Researchers found a higher number of ticks [Ixodes scapularis] in 2009 in which there was greater precipitation than 2010, with a comparison of 825 ticks to 649 ticks, respectively [18]. Leal et al articulated precipitation contributes to higher levels of tick questing by providing optimal humidity and lower saturation deficit; questing can be described asticks climbing onto vegetation or rocks, extending their legs, and waiting for a blood-host to come into close proximity facilitating attachment to the host [19]. Schultz et al conducted a study in New Jersey at the Naval Weapons Station Earle, an area where Ixodes scapularis activity is abundant. Tick sampling was done from 1998 to 2005 yielding 3,416 ticks across twenty sites and stratified by two collection periods (May thru June and July thru September). Precipitation levels varied during the time period studied; 19.9 cm in 1999 to 33.5cm in 2001. Spearman rank correlation analyses revealed positive correlations comparing cumulative precipitation and ticks collected (0.242 for spring months and 0.335 for summer months) however, results were not statistically significant [20].
Limitations of this study include unavailability of Babesia cases in states not required to report cases, and case data representative of all twelve months of the year as opposed to cases pinpointing the month infection most likely occurred. Future studies should be conducted pinpointing Babesia cases to month of infection to glean more information surrounding climate changes effect on Babesia transmission, which will enhance continued surveillance of this parasite and effect on the blood supply.
Conclusion
This study ascertained that the number of deaths from Babesia was a significant factor in investigating state delineation of testing blood donors for Babesia in the US. In addition, temperature and precipitation were found to be significant factors toward cases of Babesia in the study period 2011-2020. These findings add to the body of knowledge regarding Babesia transmission characteristics and factors prompting changes to donor testing across multiple states. Babesia microti is the most common transfusion transmitted parasite prompting continued surveillance of variables affecting transmission and evaluation of testing requirements.
References
-
Herwaldt BL, Linden JV, Bosserman L, Carolyn Y, Danuta O, et al. (2011) Transfusion associated babesiosis in the United States: a description of cases. Ann Intern Med 8: 509-519.
-
Tang TTM, Tran MH (2020) Transfusion transmitted babesiosis: a systematic review of reported cases. Transfus Apher Sci 59(5): 102843.
-
Levin AE, Krause PJ (2016) Transfusion-transmitted babesiosis: is it time to screen the blood supply? Curr Opin Hematol 23(6): 573-580.
-
Grabowski EF, Giardina PJ, Goldberg D, Henry MMd, Stanley ER et al. (1982) Babesiosis transmitted by a transfusion of frozen-thawed blood. Ann Int Med 96: 466-477.
-
(2024) Signs and Symptoms of Babesiosis.
-
Karshima SN, Karshima MN, Ahmed MI (2021) Global meta-analysis on Babesia infections in human population: prevalence, distribution, and species diversity. Pathog Glob Health 116(4):220-235.
-
Paddy S, Natasha V, Yue Z, Vernon MC, Djibril MB (2024) Beyond human babesiosis: prevalence and association of Babesia coinfection with mortality in the United States, 2015-2022: a retrospective cohort study. Open Forum Inf Dis 11(10): ofae504.
-
(2019) FDA Recommendations for Reducing the Risk of Transfusion-Transmitted Babesiosis.
-
(2020) Surveillance for Babesiosis. United States.
-
Tonnetti L, Thorp AM, Deisting B, Gary B, Stephanie TJ et al. (2013) Babesia microti seroprevalence in Minnesota Blood Donors. Transfusion 53(8):1698-1705.
-
Johnson ST, Cable RG, Tonnetti L, Bryan S, Jorge R et al. (2009) Transfusion Complications: seroprevalence of Babesia microti in blood donors from Babesia-endemic areas of the northeastern United States: 2000 through 2007. Transfusion 49(12): 2574-2582.
-
(2018) FDA approves first tests to screen for tickborne parasite in whole blood and plasma to protect the US blood supply.
-
Bloch EM, Krause PJ, Tonnetti L (2021) Preventing Transfusion Transmitted Babesiosis. Pathogens 10(9): 1176.
-
Tonnetti L, Dodd R, Foster G, Susan LS (2021) Babesia blood testing: the first-year experience. Transfusion 62(1): 135-142.
-
Ogden NH, Lindsay LR, Beauchamp G, Charron D, Maarouf A, et al. (2004) Investigation of relationships between temperature and developmental rates of tick Ixodes scapularis in the laboratory and field. J Med Entomol 41(4): 622-633.
-
Clark DD (1995) Lower temperature limits for activity of several Ixodid ticks: effects of body size and rate of temperature change. J Med Entomology 32(4): 449-452.
-
Jones C, Kitron UD (2000) Populations of Ixodes scapularis are modulated by drought at a Lyme disease focus in Illinois. J Med Entomol 37: 408-415.
-
Berger KA, Ginsberg HS, Gonzalez L, Mather TN(2014) Relative humidity and activity patterns of Ixodes scapularis. J Med Entomol 51(4): 769-776.
-
Leal B, Emily Z, Austin F, Donald BT, Robert KD (2020) Questing by tick larvae: a review of influences that affect off-host survival. Ann Entomol Soc Amer 113(6):425-38.
-
Schulze TL, Jordan RL, Schulze CJ, Robert WH (2009) Precipitation and temperature as predictors of the local abundance of Ixodes scapularis nymphs. J Med Entomology 46(5):1025-1029.
- Epidemiological and Clinical Aspects of Intestinal Parasitoses Among Students in the City of Bocaranga, Central African Republic
- Artificial Intelligence Empowers Global Infectious Disease Prevention and Control: Opportunities and Challenges
- Neuro-TB: The Battle between Tuberculosis and the Nervous System
- The Biological and Health Implications of Cat Fleas (Ctenocephalides felis): Assessing Zoonotic Risks and Hygiene Strategies
- Biostatistical Analysis of Medicinal Plants for Treating Schizophrenia
- Atraumatic Splenic Rupture Secondary to the Use of Anticonvulsants: A Case Report from Libya