P Wave Dispersion is Associated with Catheter Induced Atrial Fibrillation during Electrophysiological Study
<p>Introduction: If we can predict which patients will develop atrial fibrillation during electrophysiological study (EPS), we can be more careful during catheter placement and reduce the probability of development of atrial fibrillation. In our study, we compared P wave changes in patients who were and were not found to have catheter related atrial fibrillation during EPS.</p> <p>Material and Methods: One hundred forty five patients who had normal EPS findings and who were found to have catheter related atrial fibrillation were included in our study. ECG was performed in all patients and the pulse rate, maximum p wave time (Pmax), minimum P wave time Pmin) and the difference between (p wave dispersion, Pd) were recorded. Echocardiography was performed in all patients. The patients were transferred into arrhythmia laboratory for EPS and tachycardia was attempted to be induced by way of programmed atrial and ventricular beats. The patients with normal EPS findings were recorded as the first group and the patients who developed atrial fibrillation were recorded as the second group.</p> <p>Results: In the second group, the time of the procedure was significantly long [median value 20 (11-35) vs. 14 (9-17)]. Again, in the second group, P max [median time 120 ms (70-160) vs. 110 ms (80-160), p<0.001] and Pd [median time 45 ms (10-80) vs. 25 ms (10-80), p<0.001] were found to be significantly higher, while Pmin [median time 75 ms (40-95) vs. 80 ms (45-120), p<0.001] was found to be significantly lower. In the multiple logistic regression analysis, Pmax(OR:1.077, %95CI:1.043-1.112, p<0.001), Pmin (OR:0.889,%95CI:0.853-926, p<0.001) and Pd (OR:1.125, %95CI:1.080-1.173, p<0.001) were all found to be independent markers for atrial fibrillation.</p> <p>Conclusion: Patients with longer Pd and Pmax and shorter Pmin develop atrial fibrillation more frequently during EPS and the procedure time lasts longer.</p>
Yahya Kemal I* and Mevlut K
dryahyakemalicen@gmail.com during EPS.
the second group.
p<0.001) were all found to be independent markers for atrial fibrillation.
and the procedure time lasts longer.
Abbreviations: EPS: Electrophysiological Study; Afib: Atrial Fibrillation; LAV: Left Atrial Volume; LAD: Left Atrial Diameter; EF: Ejection Fraction; Pmax: Maximum P Wave Duration; Pmin: Min P Wave Duration; Pd: P Wave Dispersion.
Introduction
Currently, electrophysiological study (EPS) is a commonly used invasive method which is used in the diagnosis and treatment of arrhythmic patients as recommended by guidelines [1]. Although the time of EPS changes from patient to patient, it lasts shorter in patients who have not undergone diagnostic ablation compared to the ones who have undergone diagnostic ablation. In some patients, arrhythmias including dual pathway, accessory pathway or atrial tachycardia are not found and only catheter related short-term atrial fibrillation (Afib) episodes occur; these prolong the procedure time. In recent studies, P wave dispersion (Pd; the difference between maximum p wave and minimum p wave) have been indicated as a marker in some arrhythmias [2, 3, 4]. If we can predict which patients will develop Afib, we can be more careful while placing catheter and reduce the probability of catheter related Afib. In this study, we compared Pd values between the patients who were and were not found to have catheter related Afib during EPS.
Method
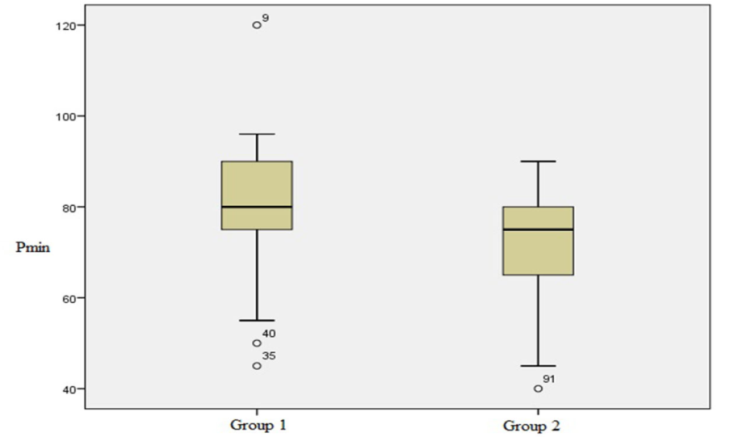
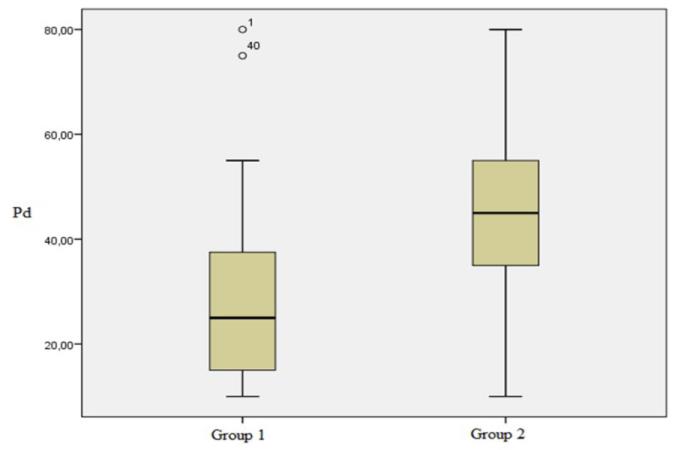
A total of 145 patients who had normal EPS findings in the last two years and who were observed to have catheter related Afib during the procedure were included in this study. The patients who had coronary artery disease, structural heart disease and another chronic disease as well as another arrhythmia in association with Afib were excluded from the study. ECG was performed in all patients (Nihon Kohden 1150k EKG Machine, 25mm/s and 10 mm/mV). The pulse rate, maximum p wave time (Pmax), minimum P wave time (Pmin) and the difference between these two values (p wave dispersion, Pd) were recorded. Echocardiogram was performed in all patients (Vivid-7, GE Wingmed sound Horten, Norway). On echocardiogram, the left atrial volume (LAV), left atrial diameter (LAD) and ejection fraction were recorded. The patients were subsequently transferred into arrhythmia laboratory for EPS. EP Tracer device was used for the procedure (Medtronic Inc., USA). A four pole diagnostic catheter (6F, 110 cm, Mariner® SC Series, Medtronic, and Sixty eight of 145 patients were in the first group [median age 48 years (18-70)] and 77 years were in the second group median age 43 years (18-70)]. The procedure time was significantly longer in the second group [median value 20 minute (11-35) vs. 14 minute (9- 17)]. Again, in the second group, Pmax [median time 120 ms (70-160) vs. 110 ms (80-160), p<0.001] and Pd [median time 45 ms (10-80) vs. 25 ms (10-80), p<0.001] were found to be significantly higher, while Pmin [median time 75 ms (40-95) vs. 80 ms (45-120), p<0.001] was found to be significantly lower (Table 1). In the multiple logistic regression analysis, it was found that Pmax (OR:1.077, %95CI:1.043-1.112, p<0.001), Pmin (OR:0.889,%95CI:0.853-926,p<0.001) and Pd (OR:1.125, %95CI:1.080-1.173, p<0.001) were all independent markers for Afib (Table 2). Differences of Pmax, Pmin and Pd in both groups were shown with boxplot graphics (Figures 1-3).
Minneapolis, MN, USA) was placed in the right atrial appendix. A four pole radiofrequency ablation catheter (7F, 110 cm, RF Mariner® MC, Medtronic, USA) was placed in the region where sensory recording was made in the right ventricle. Tachycardia was attempted to be induced with programmed atrial and ventricular beats in all patients. The patients who had normal EPS findings were specified as the first group and the patients who developed short-term Afib were specified as the second group. The procedure time was recorded in both groups. Informed consent was obtained from the patients and ethics committee approval was obtained from the local ethics committee for the study.
Statistical Analysis
The variables were divided into two groups as continuous and categorical variables. Normal distribution was tested using the Kolmogorov–Smirnovile test for the continuous variables. The continuous variables which did not show a normal distribution were expressed as median, maximum and minimum values in the table. Mann-Whitney U test was used for comparison. The categorical variables were compared using chi-square test. A p value of <0.05 was considered significant in the comparison. Multiple logistic regression analysis was performed with the values with a p value of <0.05 and the independent markers for Afib were specified.
Results
| 11. Group | 22. Group | p | |
| (68) | (77) | p | |
| Age, years | 48 (18-80) | 43 (17-80) | 0.283 |
| Male gender, (%) | 28 (41.2) | 30 (39.0) | 0.786 |
| Pulse, beat/minute | 75 (115-55) | 75 (45-150) | 0.82 |
| LAD (mm) | 35 (30-41) | 35 (30-39) | 0.325 |
| LAV (ml) | 48 (45-54) | 48 (38-54) | 0.481 |
| EF (%) | 60 (53-65) | 60 (55-65) | 0.606 |
| Pmax (msec) | 110 (80-160) | 120 (70-160) | 0.002 |
| Pmin(msec) | 80 (45-120) | 75 (40-95) | <0.001 |
| Pd(msec) | 25 (10-80) | 45 (10-80) | <0.001 |
| Study time (minute) | 14 (9-17) | 20 (11-35) | <0.001 |
Table 1: Comparison of Findings between Groups Demographic Characteristic of Patients.
| Oddsratio | 95% CI | p | |
| Pmax | 1.077 | 1.043-1.112 | <0.001 |
| Pmin | 0.889 | 0.853-926 | <0.001 |
| Pd | 1.125 | 1.080-1.173 | <0.001 |
Table 2: İndependent Predictors for Afib.
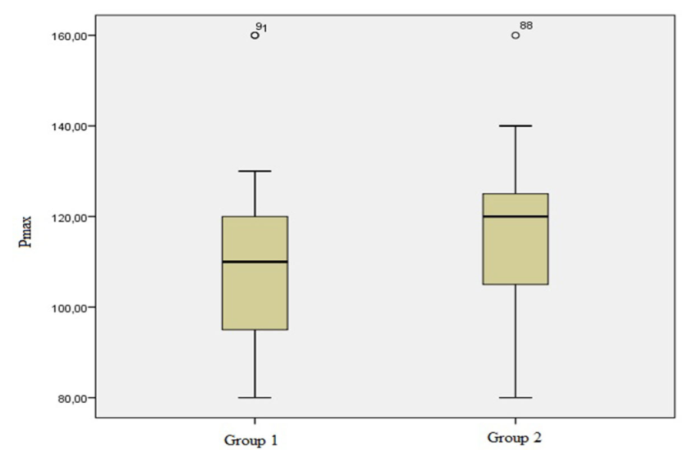
Figure1: Showing Pmax duration between group 1 and group 2 with boxplot graphic.
Discussion
Pd reflects electrical heterogeneity in the atrium. The longer the Pd value, the higher the frequency of Afib [5]. Since we waited for the patients who developed Afib to enter normal sinus rhythm in our study, the procedure time was longer compared to the other group and the difference was statistically significant. Again, the Pmax and Pd values in the Afib group were significantly longer and Pmin values were significantly shorter. These parameters were found to be independent markers for Afib. In one study, the normal value of Pd was reported to be 29±9 ms6. In an update related with PD, it was reported that the probability of atrial tachycardia increased above a value of 40 ms [6]. In the literature, it was reported that Pd especially in the D2 and V1 derivations was an independent marker in development of Afib in an observational study conducted with a high number of patients [7]. In another study, the persistent Afib group was compared with the control group and Pd was found to be shorter in the control group [8]. In a study conducted with patients with lone Afib, Pd was found to be longer and Pmin was found to be shorter compared to the control group [9]. In another study, Pd and Pmax were found to be longer in patients with paroxysmal atrial fibrillation [10]. In a study conducted with relapsing atrial fibrillation, it was reported that Pd was not an independent predictor of relapse and only prolonged P wave was an independent predictor of relapse [11]. In another relapse study, it was reported that prolonged Pd was a predictor for relapse in patients with atrioventricular nodal reentrant tachycardia who were treated with radiofrequency [12]. Besides, PD was shown to be significantly correlated with epicardial adipose tissue, prolonged in cryptogenic stroke and an independent predictor of atrial fibrillation in hypertensive patients in some studies [13, 14, 15]. In our study, prolonged Pd and Pmax and shorter Pmin were found to be independent markers for Afib. We can predict these patients with a simple superficial ECG before EPS [16].
Conclusion
Patients with longer Pd and Pmax and shorter Pmin more frequently develop Afib during EPS and their procedure times are longer. One should be careful when placing catheter in these patients.
Limitations of the Study
The radiation dose received by the patients whose EPS lasted longer was not recorded. The patients who developed Afib during the procedure were not followed up later. The CHA₂DS₂-VASc score was not calculated after the procedure in the patients with Afib. No anticoagulant treatment was initiated.
References
-
Page RL, Joglar JA, Caldwell MA, Calkins H, Conti JB, et al. (2016) 2015 ACC/AHA/HRS guideline for the management of adult patients with supraventricular tachycardia: Executive summary: A Report of the American College of Cardiology/American Heart Association Task Force on Clinical Practice Guidelines and the Heart Rhythm Society. Heart Rhythm 13(4): e136-e221.
-
Villani GQ, Piepoli M, Rosi A, Capucci A (1996) P-wave dispersion index: a marker of patients with paroxysmal atrial fibrillation. Int J Cardiol 55(2): 169- 175.
-
Lazzeroni D, Parati G, Bini M, Piazza P, Ugolotti PT, et al. (2016) P-wave dispersion predicts atrial fibrillation following cardiac surgery. Int J Cardiol 203: 131-e133.
-
Kawamura M, Scheinman MM, Lee RJ, Badhwar N (2015) Left atrial appendage ligation in patients with atrial fibrillation leads to a decrease in atrial dispersion. J Am Heart Assoc 4(5): e001581.
-
Kumagai K, Akimitsu S, Kawahira K, Kawanami F, Yamanouchi Y, et al. (1991) Electrophysiological properties in chronic lone atrial fibrillation. Circulation 84(4): 1662-1668.
-
Andres Ricardo Perez-Riera, Luiz Carlos de Abreu, Raimundo Barbosa-Barros, Jose Grindler, Acacio Fernandes-Cardoso, et al. (2016) P-wave dispersion: an update. Indian Pacing and Electrophysiology. Journal 16(4): 126-133.
-
Yoshizawa T, Niwano S, Niwano H, Igarashi T, Fujiishi T, et al. (2014) Prediction of new onset atrial fibrillation through P wave analysis in 12 lead ECG. Int Heart J 55(5): 422-427.
-
Censi F, Corazza I, Reggiani E, Calcagnini G, Mattei E, et al. (2016) P-wave Variability and Atrial Fibrillation. Sci Rep 6: 26799.
-
Chang IC, Austin E, Krishnan B, Benditt DG, Quay CN, et al. (2014) Shorter minimum p-wave duration is associated with paroxysmal lone atrial fibrillation. Electrocardiol 47(1): 106-112.
-
Dilaveris PE, Gialafos EJ, Sideris SK, Theopistou AM, Andrikopoulos GK, et al. (1998) Simple electrocardiographic markers for the prediction of paroxysmal idiopathic atrial fibrillation. Am Heart J 135(5): 733-738.
-
Dilaveris PE, Gialafos EJ, Andrikopoulos GK, Richter DJ, Papanikolaou V, et al. (2000) Clinical and electrocardiographic predictors of recurrent atrial fibrillation. Pacing Clin Electrophysiol 23(3): 352- 358.
-
Amasyali B, Kose S, Aytemir K, Kilic A, Turhan H, et al. (2006) P wave dispersion predicts recurrence of paroxysmal atrial fibrillation in patients with atrioventricular nodal reentrant tachycardia treated with radiofrequency catheter ablation. Ann Noninvasive Electrocardiol 11(3): 263-270.
-
Çiçek Y, Doğan S, Durakoğlugil ME, Balcıoğlu AS, Erdoğan T, et al. (2015) The relationship between epicardial adipose tissue and P wave and QT dispersions. Turk Kardiyol Dern Ars 43(7): 621-629.
-
Vural MG, Cetin S, Yilmaz M, Akdemir R, Gunduz H (2015) Relation between Left Atrial Remodeling in Young Patients with Cryptogenic Stroke and Normal Inter-atrial Anatomy. J Stroke 17(3): 312-319.
-
Tsioufis C, Syrseloudis D, Hatziyianni A, Tzamou V, Andrikou I, et al. (2010) Relationships of CRP and P wave dispersion with atrial fibrillation in hypertensive subjects. Am J Hypertens 23(2): 202- 207.
-
Aytemir K, Ozer N, Atalar E, Sade E, Aksöyek S, et al. (2000) P wave dispersion on 12-lead electrocardiography in patients with paroxysmal atrial fibrillation. Pacing Clin Electrophysiol 23(7): 1109-1112.
- Psychogenic Erectile Dysfunction in Late Adulthood: A Case Report on Clinical Intervention and Intimacy Restoration
- Clinical Trials on COVID-19 in 2025: A New Chapter in Global Health Research
- Innovations and Challenges in Contemporary Medical Clinical Trials: An Editorial Perspective
- Innovations and Challenges in Contemporary Medical Clinical Trials: A Critical Perspective
- Reimagining Clinical Trials: The Power of Continuous Feedback from Medical Reports
- Factors Influencing Brain Drain: Perspectives from a Medical School in Turkey