Sickle Cell Gene Frequency Analysis in Visapur, District Chandrapur: A Case Study of Single Village from Central India
Sickle cell anemia burden is generally studied by calculating how many sickle cell carriers are found in specific diagnostic camps based on combination of screening test and confirmatory tests i.e. sickle cell carrier prevalence method. Where as actual total numbers of alleles can be estimated by combining data of how many carriers and homozygous patients are found in the confirmatory testing camps, which is a gene frequency calculation method. Aim of this study is to compare prevalence and gene frequency calculations for one village data, for study conducted in year 2005 at Visapur village, Chandrapur district, Central India. Sampling was done in village school followed by screening and confirmatory testing at field work laboratory at Ballarpur city which included solubility test, hemoglobin estimation, hemoglobin electrophoresis using cellulose acetate membrane method followed by pedigree analysis after parent studies. This is a sickle cell anaemia study of single village data point. Out of total population of the village, 6.68% population were randomly studied. Total registrations done for 755 individuals and out of that total 628 individuals were tested (N = 628, 293 were females and 335 were males) for solubility tests followed by haemoglobin electrophoresis. For socioeconomically disadvantages groups, it was noted that out of 628 individuals, tribals were 111 and non-tribals, 517. Out of total tested, N=628, SCD homozygous status were found in 7 cases (Hb S+S electrophoresis pattern). In 87 cases sickle cell carrier status (Hb A+S electrophoresis pattern) were observed and in remaining 534 individuals, non-sickle cell status observed i.e. Hb A+A electrophoresis pattern. Based on this sickle cell prevalence observed for total tribal and non-tribal is 13.85% After classifying tribal Vs non-tribal population, 7 homozygous patients were found in non-tribal communities, 5 in Schedule caste, 1 in OBC and 1 in open category, there is no SCD patient found in tribal community. Out of 50 sickle cell carriers, 7 were found from tribal community and remaining all 80 belongs to non-tribal community. Out of which, 49 are from scheduled cast and 31 from OBC community. After studying sickle cell prevalence and gene frequency pattern, it is found that gene frequency gives more accurate status of sickle cell anaemia even in small population size, i.e. independent study of single village, as compared to estimation sickle cell anemia using sickle cell carrier prevalence method.
Abbreviations
NT: Nomadic Tribe; OBC: Other Backward Caste; SC: Scheduled Caste.
Introduction
Sickle cell anemia, one of the most common inherited genetic disorders in Indian tribes, is highly prevalent in Central India along with Western and Southern Indian states. Sickle cell anemia Obeagu E, et al. [1, 2] a single base substitution on beta globin chain, i.e. presence of valine instead of glutamic acid in human hemoglobin facilitating hydrophobic interaction of this valine side chain to other amino acids of other hemoglobin molecules leading to polymerization of hemoglobin is the hallmark of this hematological disorder. Gene frequency and genotype studies reported from: Chhattisgarh suggested about variabilities of tribal population from state to state Singh G, et al. [3], Madhya Pradesh Nigam R, et al. [4], Wayanad district, Kerela Feroze M, et al. [5], Yavatmal Chede S, et al. [6], Jammu and Kashmir Fareed M, et al. [7], and a general view all over India [8]. In the state of Maharashtra various studies were designed and camps were conducted for understanding the prevalence pattern at state level district levels Kate, et al. [9]. Prevalence of sickle cell gene in Yemen was also done [10]. We designed study in one specific block and 50% of that block was studied with up to 15% of the total population of each village. One of the villages is Visapur belongs to block Ballarpur district Chandrapur where random sampling was done for screening and confirmatory tests for the final lab testing of sickle cell anemia. Objective of the present study is to compare sickle cell carrier prevalence verses gene frequency in a small population size, of various socio-economic groups of single villages to asses which one gives more correctness of sickle cell status. Some gene frequency and prevalence studies were even done abroad, in Gabon, Central Africa Delicat- Loembet M, et al. [11], Saudi Arabia, Alzahrani YA, et al. [12].
Methodology
In India, marriages are done within a specific caste and category of the community, and it is well-known and majority of marriages now also within a community. Sickle cell anemia is prevalent in two major subtypes, which can be divided into tribal population Vs non tribal population. History of sickle cell anemia is trace back to civilization era around five thousand years before tribal population are early settlers in India. After that various migration waves happened resulting in displacement of tribal communities towards geographic boundaries such as banks of rivers, high mountains, and deep forests etc. Sickle Cell Hemoglobin (Hb S gene) might have introduced from tribal community group to non-tribal community group, as an occasionally or accidently while retaining majority of the matings within community, i.e. conserved gene pool for every community. To understand how far sickle cell anemia is spreading or progressing in the communities, any of the both an indicators of estimating disease burden can be used, i.e. the “prevalence of sickle cell carriers” or “presence of Hb S gene frequency”, Mostly, sickle cell status is generally studied using sickle cell carrier prevalence. Objective of the present study is to compare sickle cell carrier prevalence verses HbS gene frequency in a small population size, of various socio-economic groups within a single village to asses which one gives more correctness of sickle cell presence in the community. As mentioned above, tribal population are generally not mixing with the general population, so both the broadly defined communities, tribal Vs non tribals, are not marrying in between communities. So, even though it’s a genetic analysis, classification of the subjects needs to do, and here we did as tribal Vs non tribal communities.
Total registrations were done for 5195 individuals 17 geographic locations including mostly villages and few towns. This was the largest project during that time period, where 10% to15% sampling were covered from most of the villages except towns. Total solubility tests were done for 4008 samples. All solubility test positive samples were processed for Hemoglobin electrophoresis alongwith large number of solubility test negative and solubility test doubtful cases also tested for confirmatory tests. Out of 4008 total screening samples, 3408 samples were processed for Hemoglobin electrophoresis in this random population study, where total males were 1773, average age 14.42 years (1 to 90 years, except one SS patient) and total females were 1635, average age 15.23 years (1 to 80 years). From the confirmed analyzed data (N=3408, AA= 2829, AS= 526 and SCD=53), community-wise and village-wise prevalence was reported based on percent of sickle cell carriers in this region. From the confirmed analyzed data, [N=3408, AA=2829, AS=526 and SCD = 53], Community wise prevalence in the studied block of Chandrapur district were found to be, in non tribal population groups, SC (Hb AS 234/ Total tested SC community = 853) = Sickle Cell carriers prevalence 27.43% in year 2005), OBC (HbAS 185 /1512 = Sickle Cell carriers prevalence 12.23%), other Non tribal general population (other than SC and OBC) (Hb AS 4/48 = Sickle Cell carrier prevalence 8.33%). And in tribal population, in ST (HbAS 91/722 = Sickle Cell prevalence = 12.6%) and in NT (HbAS 7/ 263 = Sickle Cell carriers prevalence 2.66%). Whereas, overall sickle cell HbAS carriers prevalence of this study from 110 Sq km area of Ballarpur block from 17 villages in district Chandrapur in Central India found to be 15.43% (HbAS 526 from total N= 3408 confirmed tested). In this research paper, we are reporting one of the villages for assessing Prevalence Vs Gene Frequency, which one better expresses how much sickle cell anaemia is spreading in one specific village".
Type of Study
This report is a single village data point study with an analytical element that includes patients from Visapur, a small village in Maharashtra, Central India. Registration in schools were done with permission from the school authorities and sampling were done using 2 ml whole blood in EDTA tubes along with informed consent forms in local language. Haemoglobin testing was done using Sahli’s method followed by solubility test as a screening test and haemoglobin electrophoresis at alkaline pH by cellulose acetate membrane method as a confirmatory test [13]. Hemoglobin electrophoresis is a versatile technique using different supporting media such as cellulose acetate membrane, citrate agar as well as agarose gel [14]. Pedigree analysis also done for patients, i.e. homozygous SCD cases after matching results of parents and siblings for specific family for index patient as well as for sickle cell carrier index cases. Pre-Marriage counselling done for unmarried youths and genetic counselling done for those who got married recently or in the recent past with both life partners sickle cell carriers. Gene frequency calculations as well as sickle cell carrier prevalence analysis were done within specific groups to compare and analyse which one provide correct status of presence of sickle cell anemia in the community among the tested individuals within specific communities i.e. tribal Vs non tribals. Inclusion criteria: We included all patients who had registered and undergone the given tests (N=627, female =292 and male=353). Exclusion criteria: Patients that had undergone registration but hadn’t undergone the given tests (i.e. Sahli’s method, solubility and hemoglobin electrophoresis) were excluded from the study. Fetal hemoglobin (F) was excluded from gene frequency and prevalence calculations.
Solubility Test
Solubility tests were conducted to identify the presence of HbS, an abnormal hemoglobin that arises from a point mutation in the HBB gene which encodes the beta-globin chain of the hemoglobin. This mutation leads to a single nucleotide change leading to the substitution of the amino acid glutamic acid with valine on the 6th amino acid position on the β-globin chain [15]. Solubility testing is primarily based on the insoluble nature of HbS (abnormally low solubility) in the presence of a concentrated phosphate buffer, a hemolyzing agent and sodium dithionite. The presence of these agents crystallizes the HbS and precipitates the cells (precipitate deforms red cells and gives them their sickle shape), these cells refract the light and cause solution turbidity [16]. In contrast to this, other forms of hemoglobin are completely soluble hence giving a clear solution [9]. But this test can’t differentiate between sickle cell trait and sickle cell disease and is sensitive to the detection of HbAS Arishi, et al. [16] hence it was used in conjunction with other methods like Hb electrophoresis. Solubility test is a most cost-effective screening test reported by various workers in early phase of sickle cell screening test [17]. Hemoglobin Electrophoresis By using Cellulose acetate membrane electrophoresis various abnormal hemoglobins have been reported in India. Most prominent abnormal hemoglobins present in India are HbD, HbE and HbS [17, 18]. This technique was used in conjunction with solubility testing, it allows for the separation of the hemoglobin based on the charge that its globin proteins carry [19]. Clinician use it across the globe for assessment of sickle cell anemia [20]. Each of the different types of hemoglobin has an electrical charge that varies by a degree from the others, this charge is determined by the polypeptide chains that constitute the make-up of the protein [19]. This process involves the facilitation of the migration of electrically charged particles (hemoglobin) by applying an electrical field to the hemoglobin components from red blood cells. Based on their charge the components separate and move away from each other at different rates hence forming a series of distinctly pigmented bands. The bands are subsequently compared with control samples on the same membrane strip. The quantification of the different types of hemoglobin can be used to denote the severity of any abnormality [9].
Hemoglobin Estimation
To gain an insight on the status of anemia in Visapur Sahli’s method was used to estimate the concentration of hemoglobin in the blood. Blood samples were collected using finger prick method and were mixed with an acidic solution (HCl) to convert the hemoglobin present in the blood cells to a brownish compound called acid hematin. The concentration of hemoglobin in the blood is proportional to the intensity of the color of acid hematin. Distilled water was then used to dilute the acid hematin solution until its color was of a similar nature to that of a standard reference solution. Using Sahli’s haemoglobinometer (comparator with brown glass) the solution was then compared with the set of color standards which correspond to various known concentrations of hemoglobin. Results were interpreted in gms/dl as given on the hemoglobin tube [19].
Statistical Analysis
A database was designed with the categories village, age, gender, tribal and non-tribal population groups, hemoglobin levels, WHO anemia scale, solubility and electrophoresis. Gene frequency (allele frequency) as well as sickle cell carrier prevalence calculations. Gene frequency can be defined as the percentage of a population that carries a type of gene variant at a specific locus [21]. For sickle cell anemia, gene frequency is widely studied in India and elsewhere [22].
Prevalence = Total number of carriers*100/ Total number tested.
Results
In population genetics, the Hardy-Weinberg equation, p2+2pq+q2 is used to represent allele frequency and how alleles are categorized into genotypes within a population. In this equation, p and q represent allele frequencies in a population, and because there are only two possibilities and they have to add upto 100 %, p + q = 1.
Gene exists in dominant and recessive forms; these are individually referred as alleles. In where p = dominant allele frequency and q = recessive allele frequency.
| Tribal V.S. Non-Tribal | |||||||||
|---|---|---|---|---|---|---|---|---|---|
| Individuals | Alleles | Gene Frequency | Prevalence | ||||||
| Total | AA | AS | SS | A | S | A | S | ||
| Tribal | 111 | 104 | 7 | 0 | 215 | 7 | 0.968 | 0.031 | 6.306 |
| Non-Tribal | 517 | 430 | 80 | 7 | 940 | 94 | 0.909 | 0.09 | 15.473 |
| 628 | 534 | 87 | 7 | ||||||
| Tribal | |||||||||
| Individuals | Alleles | Gene Frequency | Prevalence | ||||||
| Total | AA | AS | SS | A | S | A | S | ||
| Nomadic Tribe | 36 | 36 | 0 | 0 | 72 | 0 | 1 | 0 | 0 |
| Scheduled Tribe | 75 | 68 | 7 | 0 | 143 | 7 | 0.953 | 0.0466 | 9.333 |
| 111 | 144 | 7 | 0 | ||||||
| Non-Tribal | |||||||||
| Individuals | Alleles | Gene Frequency | Prevalence | ||||||
| Total | AA | AS | SS | A | S | A | S | ||
| Open | 16 | 15 | 0 | 1 | 30 | 2 | 0.937 | 0.062 | 0 |
| Other Backward caste | 293 | 261 | 31 | 1 | 553 | 33 | 0.094 | 0.056 | 10.58 |
| Scheduled caste | 208 | 154 | 49 | 5 | 357 | 59 | 0.858 | 0.141 | 23.557 |
| 364 | 282 | 76 | 7 | ||||||
| Total Data | |||||||||
| Individuals | Alleles | Gene Frequency | Prevalence | ||||||
| AA | AS | SS | A | S | A | S | |||
| Total (N = 628) | 534 | 87 | 7 | 1155 | 101 | 0.919 | 0.08 | 13.853 |
Table 1: Sickle Cell Anemia Carrier Prevalence and Gene Frequency Studies in Various Socio-economic Groups. Total data set = 628.
Discussion
Table 1 shows the gene frequency and prevalence of sickle cell disease among a total sample size of 628 individuals which is also indicated in fig. 3 for overall prevalence of sickle cell anaemia in tribal and non-tribal population groups. The Hb A gene frequency in the total data is higher than the gene frequency of Hb S indicating a higher number of normal (HbAA) as well as carrier patients (HbAS) when compared to affected patients (HbSS). It can also be seen that the prevalence of SCD in Visapur is approximately 13.85%. These results align with the hardy Weinberg principle indicating a higher proportion of normal and carrier individuals as compared to individuals affected with SCD. Table also shows a comparison of the gene frequency and prevalence of SCD among the tribal and non-tribal communities in Visapur with a total sample size of 628. The tribal sample included 111 individuals with a SCD prevalence of approximately 6%. It can also be seen that Hb A had a higher gene frequency than Hb S indicating a higher number of normal as well as carrier patients compared to affected patients. The non-tribal sample included 517 individuals with a SCD prevalence of approximately 15%. It can also be seen that the gene frequency of both Hb A and Hb S are almost equal with negligible difference. Based on the higher prevalence of SCD in non-tribal communities we can infer that there could be a change or difference in the genetic dynamics among the non- tribal population.
Table 1 indicates a comparison of the gene frequency and prevalence of SCD among nomadic and scheduled tribes in Visapur with a total sample size of 111 individuals. The nomadic tribe included 36 individuals with a SCD prevalence of 0%. It can also be seen that the gene frequency of Hb A is 1 in the absence of Hb S. These results could be due to the small sample size and may differ in a larger sample. The scheduled tribe included 75 individuals with a SCD prevalence of approximately 9.3%. It can also be seen that the gene frequency of Hb A is significantly higher than the gene frequency of Hb S. Based on the comparison of the collected data we can infer that SCD is more prevalent among scheduled tribes than nomadic tribes. Table also indicates a comparison of the gene frequency and prevalence of SCD among open, OBC and scheduled castes in Visapur with a total sample size of 517 individuals. Open consisted of 16 individuals with a SCD prevalence of 0%. It can also be seen that HbA had a higher gene frequency than HbS by 0.875. OBC has a sickle cell prevalence of approximately 10.58% and the gene frequency of HbA is higher than the gene frequency of HbS. With 23.57% scheduled caste has the highest prevalence amongst the 3 groups. It also has a higher HbA gene frequency than HbS. Due to the higher prevalence in scheduled castes, we can interpret that they have a higher genetic risk for SCD compared to OBC and open.
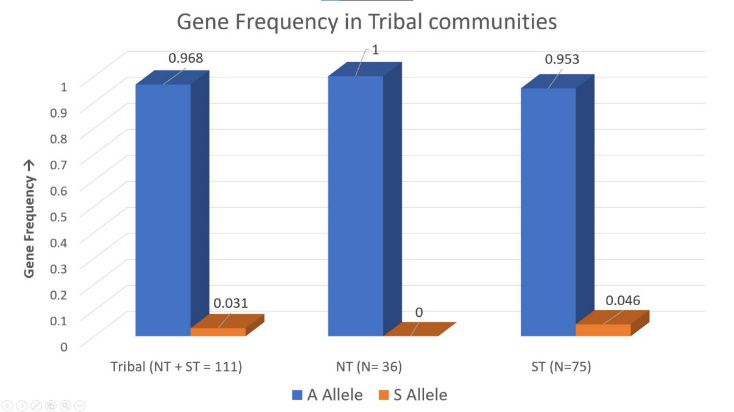
Figure 1 indicates Gene Frequency in Tribal communities. The figure shows differentiating gene frequency between Nomadic Tribe (NT) (N = 36) and Scheduled Tribe (N = 75)
along with the total tribal gene frequency (NT + ST = 111). First bar represents the ‘A’ Allele and Second bar represents ‘S’ Allele.
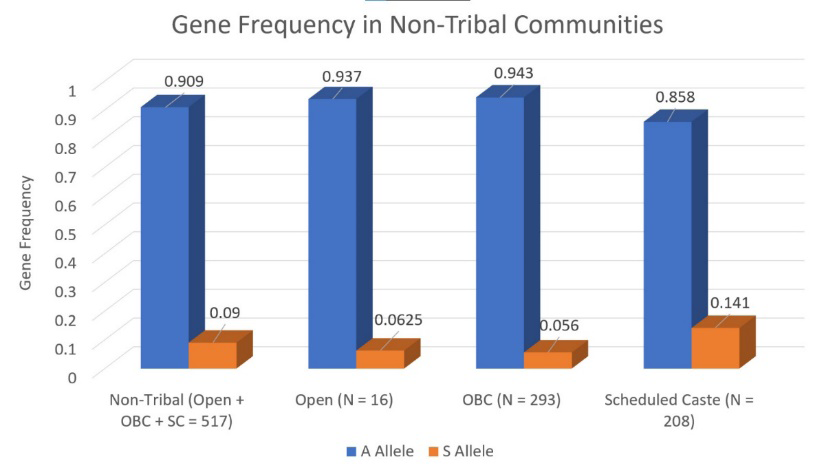
Figure 2 Indicates Gene Frequency in Non-Tribal communities. The figure shows differentiating gene frequency between Open caste (N = 16), Other Backward Caste (OBC) (N = 293) and Scheduled Caste (SC) (N = 208). First bar represents the ‘A’ Allele and Second bar represents ‘S’ Allele.
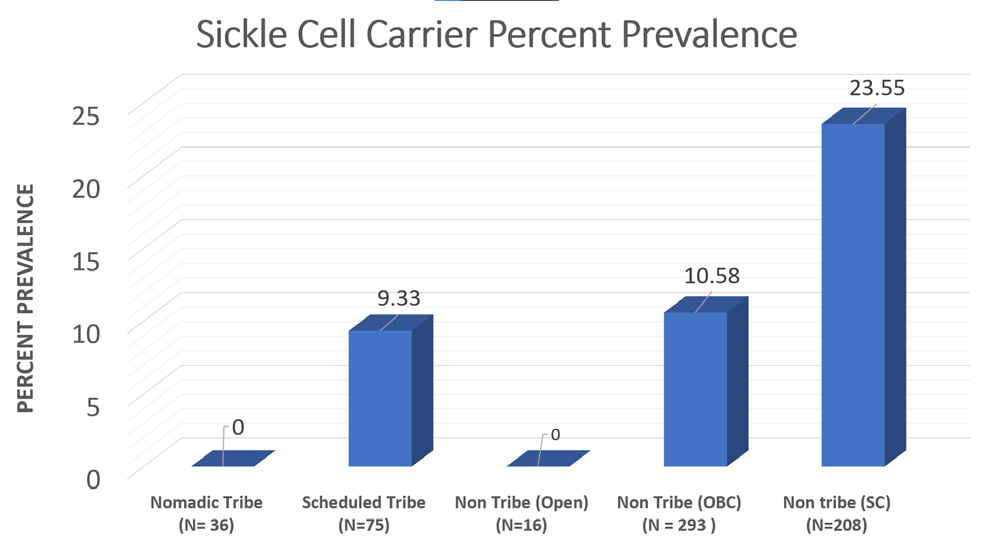
Figure 3 Indicates Graphical representation of Sickle Cell carrier (HbAS) percent prevalence across all the socio- economic groups. The figure shows differentiating precent prevalence between Nomadic Tribe (NT) (N = 36), Scheduled Tribe (N = 75), Open caste (N = 16), Other Backward Caste (OBC) (N = 293) and Scheduled Caste (SC) (N = 208). Prevalence calculations showed that the population has a notable prevalence of individuals affected with SCD (HbSS) as well as sickle cell carriers (HbAS). The data also shows that the population deviates from Hardy-Weinberg equilibrium which indicates the presence of evolutionary pressures like non-random mating and natural selection which could be due to the heterozygote advantage in malaria-endemic regions. We can also infer from the prevalence and gene frequency calculations that scheduled tribes, scheduled castes and non- tribal communities are at a higher risk for SCD as compared with their counterparts. Hence more public initiatives focusing on genetic screening, marriage counseling and for providing free or affordable healthcare are necessary for the management and reduction of SCD in the population.
Since in open category, where sample size was very small, i.e. N=16, so out of 16, 15 were normal individual, 1 was found to be sickle cell patient, in such case, since sickle cell carrier prevalence is zero, became there is no sickle cell carrier in this community from a small sample size. However, one homozygous patient clearly suggests that sickle cell exists in the community. So, although sickle cell prevalence is zero, gene frequency is 0.062. This suggests for a very small sample size also, gene frequency gives accurate result than sickle cell carrier prevalence studies.
Conclusion
Given the variation in sample sizes between Tribal and Non-Tribal groups, prevalence calculations based solely on sickle cell carriers may not accurately reflect the presence of the HbS gene. This is because gene frequency calculations consider sum of all alleles (i.e. addition of all genotypes HbAA, HbAS, and HbSS), while prevalence studies focus only on sickle cell carriers (HbAS) (calculation of only HbAS, while not considering genotype HbSS) resulting in missing data of homozygous patients (HbSS) who attend screening camps. Consequently, if carriers are absent from these camps for that particular community, the presence of the HbS gene may be underestimated. In contrast, gene frequency calculations provide a more comprehensive measure of the gene’s prevalence in specific communities and villages, including both Tribal and Non-Tribal groups. With a sample size of 628 being adequate for a single village, gene frequency may be prioritized for monitoring sickle cell gene trends over generations, rather than sickle cell carrier prevalence.
Future Directions
The data collected in 2005, when individuals identified as sickle cell carriers might have married partners who are carriers or normal individuals, is particularly valuable. A follow-up study in 2024-25 will be crucial for understanding how reproductive choices have influenced the gene’s prevalence and frequency. This long-term data will enhance insights into the gene’s distribution and the effectiveness of public health interventions, and can be further analyzed using advanced AI technologies to predict future trends.
Author Contributions
Devendra Lingojwar (DL) contributed to the conception and design of the project, prepared the manuscript and revised it critically for intellectual content. SL contributed to the conception and design of the field work in tribal areas including all tests in the field, entered demography data and make data maintenance, contributed in manuscript preparation intellectually. NH analyzed data and prepared initial structure of the manuscript. AL has contributed in all graphic work and contributed in data analysis. AL and DL contributed for discussion to make out logical conclusion. All authors approved the final version of the article.
References
-
Obeagu E, Ochei K, Nwachukwu B (2015) Sickle Cell Anaemia: A Review. Scholars Journal of Applied Medical Sciences (SJAMS) 3(6B): 2244-2252
-
Dangi C, Kaur M (2013) An overview on Sickle Cell Disease Profile. Asian Journal of Pharmaceutical and Clinical Research 6(8).
-
Singh G, Ghai N, Shad N (2015) Genotype and Sickle Cell Allele Frequency Distribution in a Tribal Population of India. Frontiers of Biological and Life Sciences 3(1): 25- 28.
-
Nigam R, Sharda B, and Varma A (2024) Comparative study of sickling test, solubility test, and hemoglobin electrophoresis in sickle cell anemia. MGM Journal of Medical Sciences 11(1): 31-37.
-
Feroze M, Aravindan KP (2001) Sickle cell disease in Wayanad, Kerala: Gene frequencies and disease characteristics. National Medical Journal of India 14(5): 267-270.
-
Chede S, Zade V, Tayade D, Sontakke K (2018) The prevalence of sickle cell disease phenotypes and sickle cell gene frequency in some tribal groups of Umarkhed taluka region of Yavatmal district, Maharashtra (India).
-
Fareed M, Anwar M, Ahmad M, Afzal M (2016) Gene frequency reports of sickle cell trait among six human populations of Jammu and Kashmir, India. Gene Reports 4: 1-5.
-
Colah R, Mukharjee M, Martin S, Ghosh K (2015) Sickle cell disease in tribal populations in India. Indian J Med Res 141(5): 509-515.
-
Kate SL, Lingojwar DP (2002) Epidemiology of Sickle Cell Disorder in the State of Maharashtra. International Journal of Human Genetics 2(3): 161-167.
-
Nood A, Hamid H (2004) Prevalence of sickle cell gene in Yemen: a pilot of study. Hemoglobin 28(4): 305-315.
-
Delicat-Loembet M, Elguero E, Arnathau C, Durand P (2014) Prevalence of the Sickle Cell Trait in Gabon: A nationwide study. Infect Genet Evol 25: 52-56.
-
Alzahrani YA, Algarni MA, Alnashri MM, AlSayyad HM, Aljahdali KM, et al. (2020) Prevalence and Risk Factors for Microalbuminuria in Children with Sickle Cell Disease at King Abdulaziz University Hospital: A Retrospective Cross-sectional Study. Cureus 12(1): e6638.
-
Okinyi F, Mwanda WO (2018) Assessment of a Rapid Diagnostic Tool for Sickle Cell Hemoglobin S. Elixir Haematology 116: 50095-50098.
-
Geraldine M, Gnanou J, Sheila U, Thuppil V (2001) Haemoglobin Electrophoresis in Diagnosing a Case of Sickle Cell Anaemia Associated with β-Thalassemia. Indian Journal of Clinical Biochemistry 16(2): 211-212.
-
Ashorobi D, Ramsey A, Killeen RB, Bhatt R (2024) Sickle Cell Trait. Stat Pearls.
-
Arishi, Wjdan A, Zourob M (2021) Techniques for the Detection of Sickle Cell Disease: A Review. Micromachines 12(5): 519.
-
Huntsman RG, Barclay GPT, Canning DM, Yawson GI (1970) A Rapid Whole Blood Solubility Test to Differentiate the Sickle-Cell Trait from Sickle-Cell Anaemia. Journal of Clinical Pathology 23(9): 781-783.
-
Lingojwar D, Gupta P (2016) Variation of Abnormal Hemoglobins Concentrated in Durg, Chhattisgarh: A Brief Note Based on Cross-Sectional Study. Journal of Genetic Disorders & Genetic Reports 5(2).
-
Patil, Prashant J (2013) Variability and Accuracy of Sahli’s Method in Estimation of Haemoglobin Concentration. National Journal of Integrated Research in Medicine 4(1): 38.
-
Shridhar A, Idowu M (2021) Hemoglobin Electrophoresis in Sickle Cell Disease: A Primer for the Clinician. Hematopoiesis.
-
Ranjan S, Gautam A (2018) Gene frequency. In: Vonk J, Shackelford T (Eds.), Encyclopedia of Animal Cognition and Behavior. Springer pp: 1-3.
-
Hassan K (2021) Gene Frequency and Genotype Frequency Calculation. Genetics, Population.
- Psychogenic Erectile Dysfunction in Late Adulthood: A Case Report on Clinical Intervention and Intimacy Restoration
- Clinical Trials on COVID-19 in 2025: A New Chapter in Global Health Research
- Innovations and Challenges in Contemporary Medical Clinical Trials: An Editorial Perspective
- Innovations and Challenges in Contemporary Medical Clinical Trials: A Critical Perspective
- Reimagining Clinical Trials: The Power of Continuous Feedback from Medical Reports
- Factors Influencing Brain Drain: Perspectives from a Medical School in Turkey