Hypertrophic Obstructive Cardiomyopathy of Right Ventricle without Involvement of Left Ventricle
Hypertrophic obstructive cardiomyopathy localized to right ventricle is rare. There are no diagnostic clinical or electrocardiographic findings. Echocardiography is diagnostic. A case of isolated right ventricular hypertrophic obstructive cardiomyopathy is reported and literature is reviewed.
Introduction
Hypertrophic obstructive cardiomyopathy localized to right ventricle is rare. There are no diagnostic clinical or electrocardiographic findings. Echocardiography is diagnostic.
Case Report
A 35 years female presented with complaint of breathlessness on effort. Pulse was regular at a rate of 90/ minute. Systemic blood pressure was 116/86 mm of Hg. Jugular venous pressure and pulse wave from were normal. Apical impulse was normal. There was no right ventricular impulse. No other pulsations were felt. First and second sound sounds were normal. There was no click. There was a grade 2-3/6 ejection systolic murmur over left second and third intercostal space in parasternal region. It showed no selective radiation. There was no respiratory variation. There was no family history of hypertrophic cardiomyopathy or sudden cardiac death.
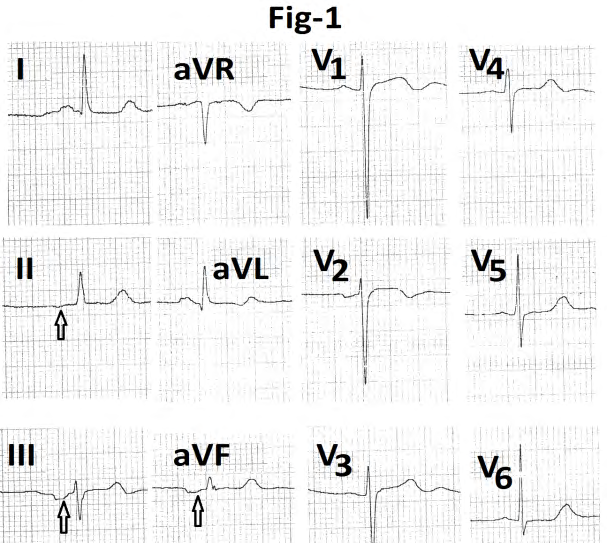
Electrocardiogram (Figure 1) showed sinus rhythm. P wave negative in leads II, III, aVR, aVF and was positive in leads V1,V5,V6. P-R interval was 160ms. Ventricular rate was 60/min. QRS duration was 80 ms. Mean frontal plane QRS axis was around +1500. Lead aVR showed QS pattern. Lead V1 showed rs pattern (6mm/25mm). Lead V6 showed Rs configuration (14/3mm). Amplitude of R wave was 11mm and 7.5 mm in leads I and aVL respectively. T wave was inverted in leads V1 ,V2. QTc interval was 432 ms. U wave was positive in leads V1 to V5 .
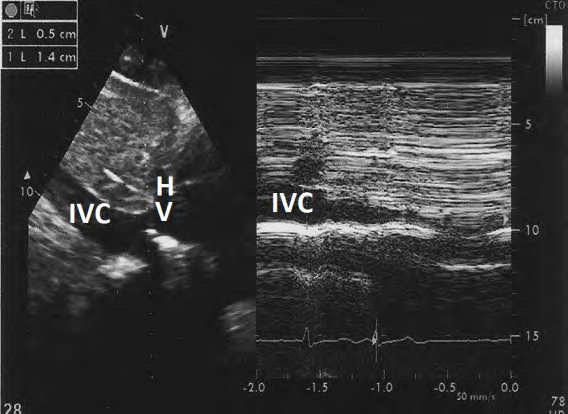
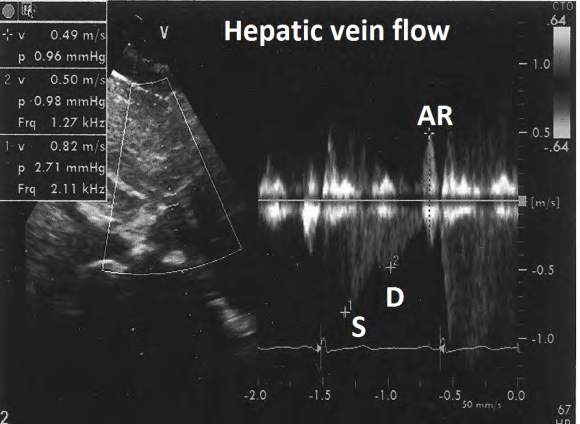
On echocardiography, inferior vena cava was normal (1.5 cm) with normal inspiratory collapse (Figure 2). Hepatic
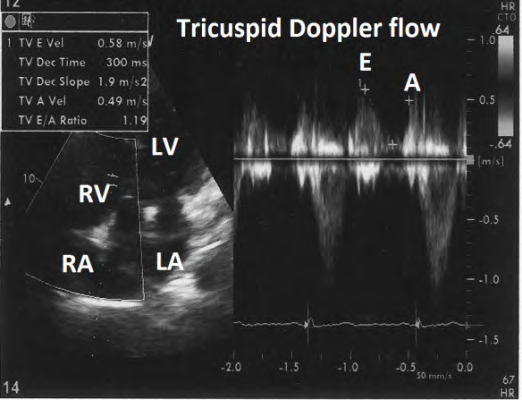
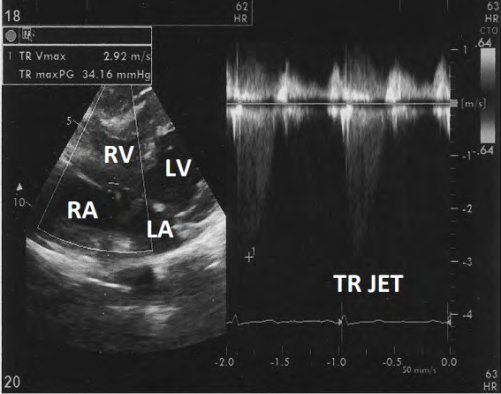
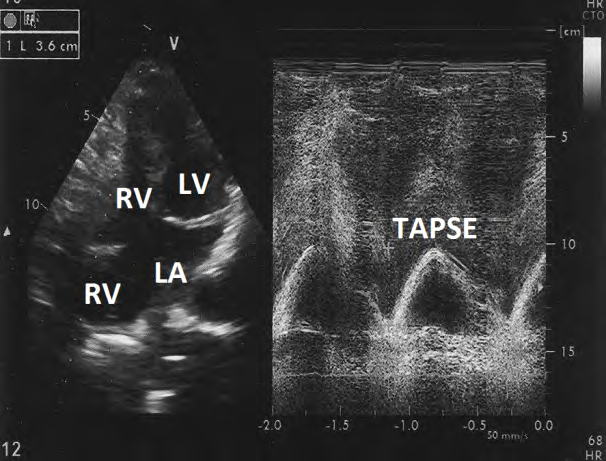
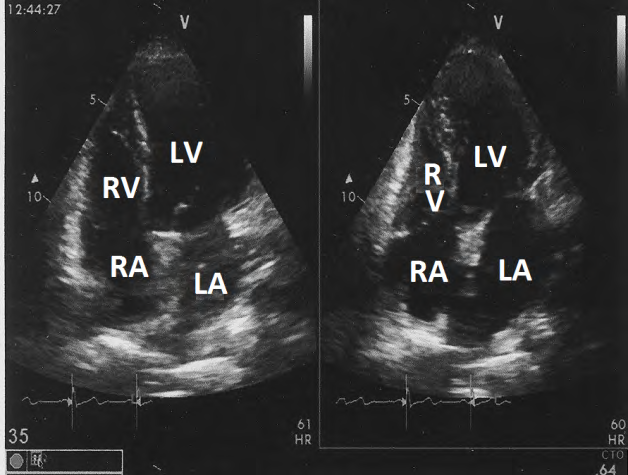
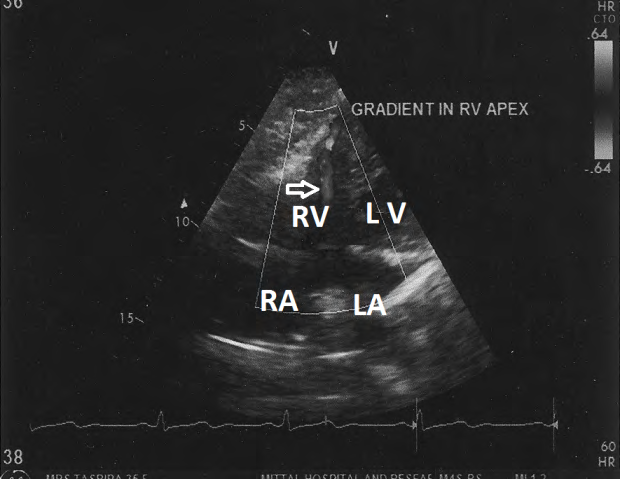
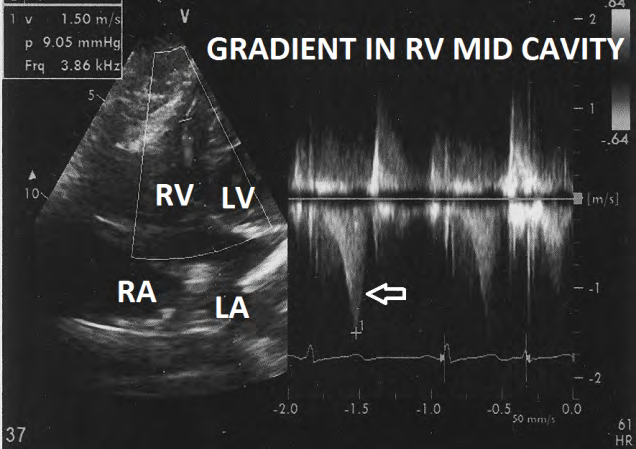
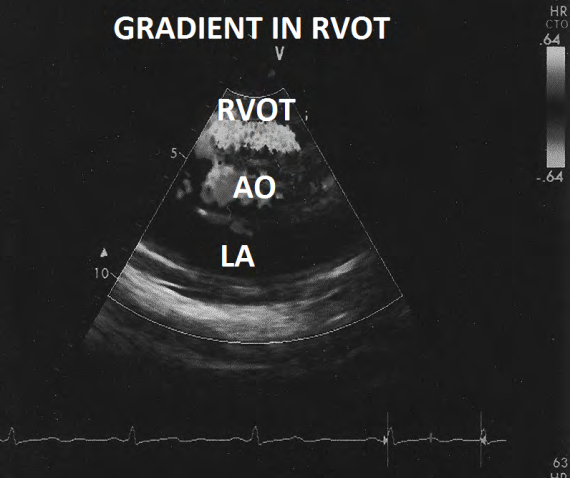
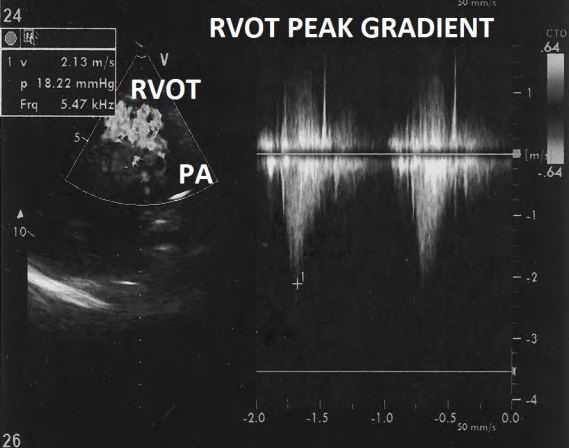
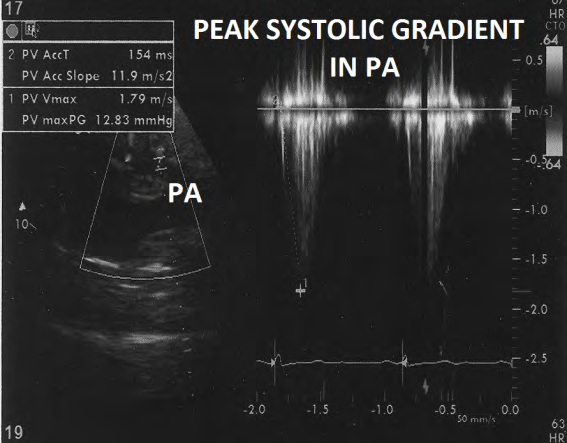
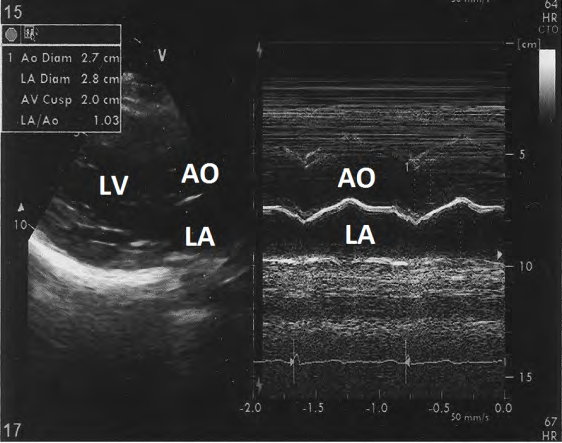
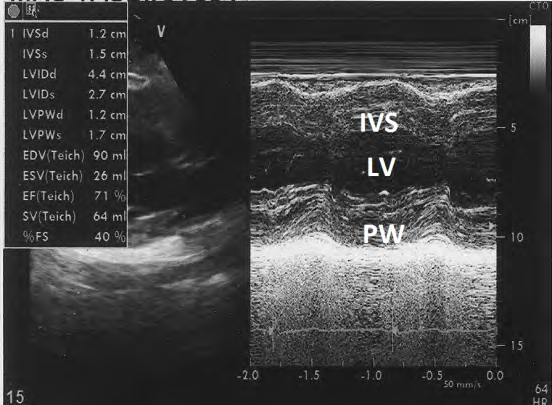
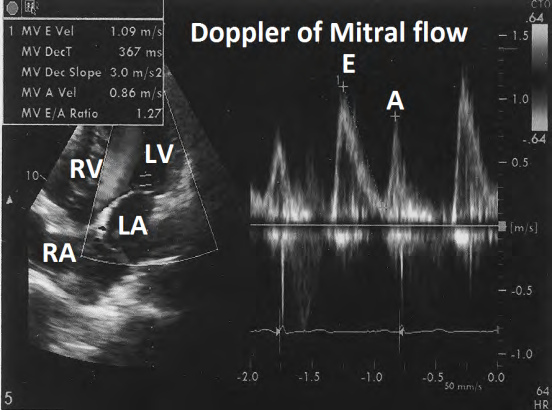
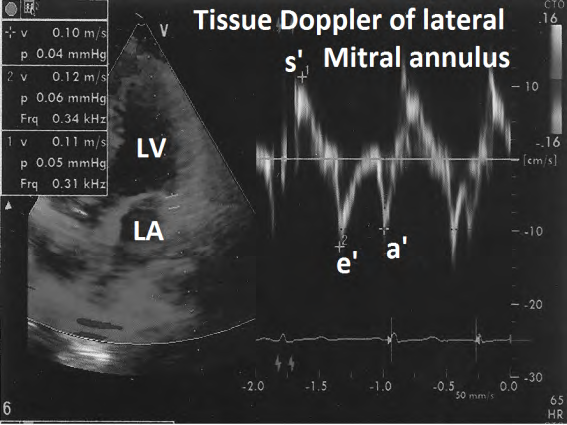
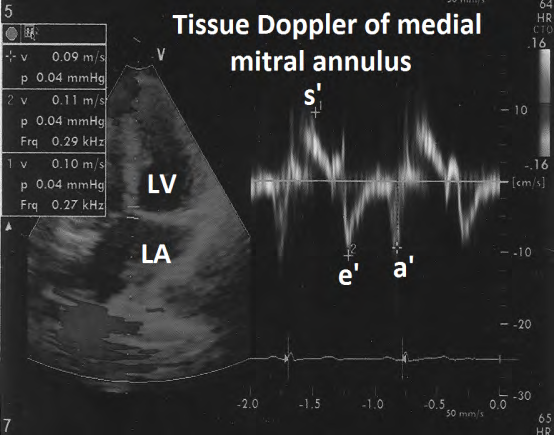
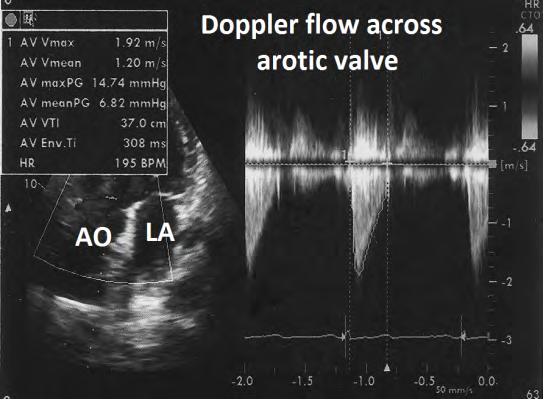
vein flow pattern was normal (Figure 3). Tricuspid flow was normal (E- 0.58m/s, A- 0.49 m/s. Deacceleration time 300ms) (Figure 4). There was minimal TR with peak systolic gradient of 34+5mm Hg) (Figure 5). Tricuspid annulus peak systolic excursion was 3.6 cm (Figure 6). Apical four chamber view revealed increased thickness and systolic obliteration of apex of right ventricle (Figure 7). Colour Doppler evaluation revealed mid cavity turbulence in apical part of right ventricle (Figure 8). Doppler evaluation revealed characteristic late peaking dogger-shaped appearance with right ventricular mid cavity gradient of a 9 mm Hg (Figure 9). Short axis view revealed turbulence in right ventricular outflow (Figure 10) with a peak systolic gradient of 18.2 mm Hg (Figure 11). Pulmonary valve was normal with no additional gradient (Figure 12). Evaluation of left side of heart was within normal limits. M- Mode dimension of left atrium was 2.8cm (Figure 13). End diastolic and end-systolic M-mode dimensions of left ventricle were 4.4 cms and 2-7 cms respectively. There was no left ventricular hypertrophy (Figure 14). Doppler evaluation of mitral valve flow was normal (Figure 15). Tissue Doppler evaluation of lateral mitral annulus (Figure 16) and medial mitral annulus (Figure 17) were normal. Flow across aortic valve was normal (Figure 18).
Discussion
Right ventricle can be involved in some cases of left ventricular hypertrophic cardiomyopathy [1, 2, 3, 4, 5]. Isolated right ventricular hypertrophic obstructive cardiomyopathy is, however, rare. There are isolated case reports in literature [6, 7, 8, 9, 10]. Most of the reported cases are those who are symptomatic because of severe hypertrophy. Knowledge about this entity is, therefore, incomplete.
Exact prevalence is not known as there is no prospective population based or autopsy study focusing on this field. There is no information about genetic basis because of report of small number of cases and back of genetic studies in these reported cases. There is only one case report of history of hypertrophic obstructive cardiomyopathy in two brothers of a case of hypertrophic cardiomyopathy of the right ventricle [3]. One brother of another patient had none Compaction of left ventricle [9].
Patients with isolated mild or moderate hypertrophy with or without mild to moderate obstruction may not have any specific symptoms. Those with severe obstruction are likely to have angina or breathlessness on effort similar to any other significant right ventricular outflow tract obstruction.6-9 Arterial pulse is likely to be normal. There are no reports of techy arrhythmias. One patient had junctional rhythm. Jugular venous pulse pressure is likely to be normal except in cases with severe hypertrophy of right ventricle. Such cases may show prominent ‘a’ wave in jugular venous pulse. Clinically detectable systemic venous congestion is not seen.
Apical impulse is normal. Left parasternal heave is uncommon unless outflow obstruction is severe [6, 7, 9]. There are no other abnormal pulsations. Commonest finding is grade 2-3/6 ejection systolic murmur over left 3rd intercostal space [6, 7, 8, 9]. Murmur may or may not show clear inspiratory increase in intensity. Systolic thrill is unusual [3, 4]. First and second sounds are normal [3,7,8,]. There is no click. Right sided fourth heart sound is rare.6 its right ventricular origin may be difficult to appreciate.
Skiagram of chest is unremarkable. Electrocardiogram may be unremarkable with mild to moderate hypertrophy. Right axis deviation and right ventricular hypertrophy suggest severe right ventricular hypertrophy. Unexplained turbulence in right ventricular outflow tract is the commonest echocardiographic finding that raises suspicion to the presence of this entity. Right ventricular outflow tract lies perpendicular to cursor in short axis view. Turbulent flow is, therefore, likely to be recorded on either side of base line. Therefore, calculation of exact gradient, by echocardiography, may be difficult. Exclusion of any additional gradient across pulmonary valve or in main or branch pulmonary arteries is necessary to exclude any secondary cause for right ventricular hypertrophy. Cardiac catheterization is usually not indicated.
Most of the echocardiographers focus on left ventricle. Isolated right ventricular hypertrophic cardiomyopathy is, therefore, likely to be missed unless specifically looked for. Isolated right ventricular hypertrophic cardiomyopathy without obstruction is more likely to be missed as it does not produce any turbulent flow that may attract attentions of echocardiographer exact incidence, clinical profile, electrocardiographic findings and natural history will be clear only on study of larger number of cases. Like classical hypertrophic obstructive cardiomyopathy, patients may have partial relief of symptoms with betablockers. Non responders may need surgical intervention [4, 5].
References
-
Recupero A, Dibella G, Patone S, Pietro P, Tripodo E, et al. (2010) Right ventricular outflow tract obstruction in hypertrophic cardiomyopathy. Int J Cardiol 144(3): e56- 57.
-
Lockhart A, Carpentier A, Bourdarias JP, Ismil MB, Ourbaic P, et al. (1966) Right ventricular involvement in obstructive cardiomyopathies: Hemedynamic studies in 13 cases. Br Heart J 28(1): 122-133.
-
Reyes LC, Vazquez C, Bobadilla A, Garrido M, Osnaya H (2005) Hypertrophic cardiomyopathy of the right ventricle . Presentation of three cases. Acta Pediatr Mes 26: 281-288.
-
Braunwald E, Lombrew CT, Rockoff SD, Ross J, Morrow AG (1964) Idiopathic hypertrophic subaortic stenosis. A description of the disease based upon an analysis of 64 patients. Circulation 30(S4): 3-119.
-
Cardiel EA, Alonso M, Delean JL, Menarguez L (1978) Echocardiographic sign of right sided hypertrophic obstructive cardiomyopathy. Brit Heart J 40(11): 1321- 1324.
-
Mittal SR (2018) Isolated right ventricular hypertrophic cardiomyopathy. Cardiology Today 22: 26-29.
-
Mittal SR, Jain S (1998) Isolated right ventricular hypertrophic obstructive cardiomyopathy. J Assoc Physicians India 46(11): 970-971.
-
Mittal SR (2010) Isolated right ventricular hypertrophic obstructive cardiomyopathy. J Assoc Physicians India 58: 249-250.
-
George AS (2017) Isolated Right Ventricular Hypertrophic Obstructive Cardiomyopathy-A Case report. University Journal of Medicine and Medical Sciences 3(2): 1-4.
-
Marrow AG, Fisher RD, Fogarty TJ (1969) Isolated hypertrophic obstruction to right ventricular outflow. Clinical, hemodynamic, and angiographic findings before and after operative treatment. Am Heart J 77(6): 814- 817.
- Anomalous Origin of the Left Coronary System from the Right Coronary Cusp: A Rare Coronary Anomaly in a Patient Undergoing Aortic Stenosis Workup
- Optimizing the Therapeutic Potential of Sacubitril/Valsartan: The Promise of Co-Crystal Engineering
- Association between Mortality and Topography of Peripheral Arterial Disease due to Atherosclerosis Obliterans
- Mitral Valve Replacement vs Mitral Valve Repair
- Characteristics and Evolution of Patients with Heart Failure Hospitalized in the Cardiology Department of Dalal Jamm Hospital
- Distribution of Association between Basic Knowledge of Chest Pain and Myocardial Infarction (Heart Attack) and Demographic Variables: A Survey-Based Study