Epidemiology of Neuroendocrine Tumors (Nets) and Socio- Clinical Profile of Patients According to Data from the National Cancer Registry and the Federal Patient Registry of the MOLNEO Medical Society for Treatment of Neuroendocrine Tumors
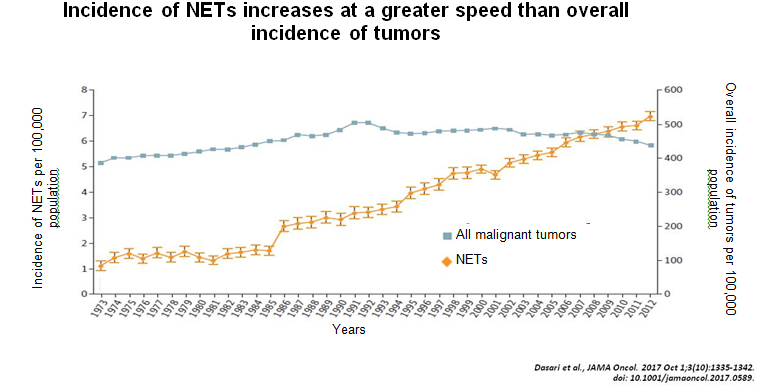
The Incidence of NETs has increased 6,4 - fold over the last 40 years. This growth is noted by statistics from most countries of the world. This is due to both improved diagnosis and the actual increase in this type of disease. Russia according to 2017 data had the largest population and largest number of registered NET patients among the incomplete list of European countries as well as the second place regarding the prevalence of NETs. From 2017 to 2019 the number of NET patients included in the National Cancer Registry of the Russian Federation has increased from 21 668 NET patients (prevalence - 14.75 per 100,000 population) to 25,782. In 2019, the prevalence of NETs was 17.54 per 100,000 population. If over a 10- year period (2010 -2019) the number of patients with malignant tumors followed-up in oncology dispensaries has increased by 40.6%, the number of patients with confirmed diagnosis of neuroendocrine tumors increased by 83.9%. The number of newly identified cases of NETs increased much more intensively than number of all malignant tumor during the same period also: in 2019, the number of newly identified cases was 1.8-fold larger than it had been in 2010 - respectively 7,623 and 4,198 cases. The increase in the incidence of NETs has been 3.5-fold larger than the increase in the total number of cases of malignant tumors. The article presents the results of the analysis of the data of the state cancer registry and separately shows the results of the register of the medical society for the treatment of neuroendocrine tumors (MOLNEO).
Introduction
Incidence of NETs is on the steady rise globally. This is partly due to improved diagnosis and the fact that oncologists and other specialists are becoming better informed about specific features of diagnosis and clinical manifestations of these tumors previously considered to be rare; undoubtedly, however, there is also a real rise in the incidence of NETs. Globally, the incidence of NETs has increased 6.4-fold over the last 40 years (Figure 1). In Europe, the most prevalent NETs are those of the pancreas and of the small intestine; also, an increase in the incidence of NETs in the appendix has been noted in recent years. In China, the most prevalent NETs are those of the trachea, bronchi and lungs. The incidence NET in China was 4.10/100000. In the USA, improvements in diagnosis have resulted in increased incidence of G1 NETs. However, initial diagnosis remains difficult: 91% of elderly patients make, on an average, 9 visits to physicians in the course of one year before they are diagnosed with a NET [1]. Leondini F. with co-authors reported of interesting investigation from 11 studies involving 72,048 cases; neuroendocrine neoplasm incidence rates increased over time in all countries for all sites, except for appendix at that time. In Surveillance Epidemiology and End Results low- grade neuroendocrine neoplasm incidence rate increased from 1.09 in 1973 to 3.51 per 100,000 in 2012. During this interval, high-grade neuroendocrine neoplasm incidence rate increased from 2.54 to 10.52 per 100,000. African Americans had the highest rates of digestive neuroendocrine neoplasms with male prevalence in high-grade.
At the same time as noted Huguest J, et al. [2] significant differences can be found between geographic regions and races, suggesting that environmental or genetic factors may contribute to the clinical and biological behavior of these tumors. So, in the 2021 year review Das S, et al. [3]. show fluctuations in the incidence range only for GEP NETs from 2,5/100000 in Germany to 8,35/100000 in Norway
Comparative data on the prevalence of NETs in Russia and countries included in the ENETS European NET Registry (the ENETS site) are presented below in Table 1.
In 2017, according to data from the National Cancer Registry of the RF, there were 21 668 NET patients (prevalence-14.75 per 100,000 population). This Registry does not contain all the necessary information, but enables to quite accurately describe the NET epidemiology in the Russian Federation and compare it with the European data from the ENETS European NET Registry.
In 2017, among the countries included in Table 1, Russia had the largest population and the largest number of registered NET patients, as well as occupied the second place as regards the prevalence of NETs. In the last 2 years, a quite large number of new cases of NET have been revealed, and, by the end of 2019, the number of NET patients included in the National Cancer Registry of the Russian Federation has increased to 25,782. In 2019, the prevalence of NETs was
17.54 per 100,000 populations. During the last 10 years, average yearly increase in the number of patients with malignant tumors followed-up in oncology dispensaries has been 3.9%. In total, during the period from 2010 to 2019, this patient population has increased by 40.6%.
| Population, N | NET patients, n | Prevalence of NETs, per 100,000 population (2017) | |
|---|---|---|---|
| Russia | 146,888,432 | 21,668 | 14.75 |
| Germany | 82,800,000 | 2,415 | 2.92 |
| Spain | 46,700,000 | 3,385 | 7.25 |
| Poland | 38,422,346 | 443 | 1.15 |
| Belgium | 11,358,952 | 773 | 6.81 |
| Greece | 10,749,943 | 261 | 2.43 |
| Czechia | 10,578,820 | 1,704 | 16.11 |
| Switzerland | 8,560,988 | 1,121 | 13.09 |
Table 1: Epidemiological parameters of NETs in European countries as compared to Russia according to data from the ENETS European
During the same period, average yearly increase in the number of patients with confirmed diagnosis of neuroendocrine tumor followed-up in oncology dispensaries has been 7.0%. Thus, the increase in the number of NET patients was twice the increase in the total number of patients with malignant tumor. On the whole, this patient population increased by 83.9% during the period from 2010 to 2019.
In Russia, according to data from the National Cancer Registry, the incidence of NETs in the general population has been increasing rapidly in the recent years. During the last decades, the number of newly identified cases of NET increased from 0.03 cases per 100,000 populations registered in 2001 to 5.19 cases per 100,000 populations registered in 2019. However, the incidence of NETs in Russia is lower than that in the USA according to data presented by Yao J [4] (Table 2).
| Year | Incidence of NETs in the USA | |
|---|---|---|
| Incidence per 100,000 population | Predicted number of people developing the disease | |
| 2004 | 5.25 | 103,312 |
| 2012 | 6.98 | |
| 2014 | 171,321 | |
| 2016 | 8.4 |
Table 2: Incidence of NETs in the USA.
The number of newly identified cases of malignant tumor increased, on an average, by 2.4% every year: in 2019, total number of newly identified cases of oncologic disease was 23.9% larger than the total number of newly identified cases of malignant tumor that had been identified in 2010. The number of newly identified cases of NETs increased much more intensively during the same period: in 2019, the number of newly identified cases was 1.8-fold larger than it had been in 2010 - respectively 7,623 and 4,198 cases. The increase in the incidence of NETs has been 3.5-fold larger than the increase in the total number of cases of malignant tumor.
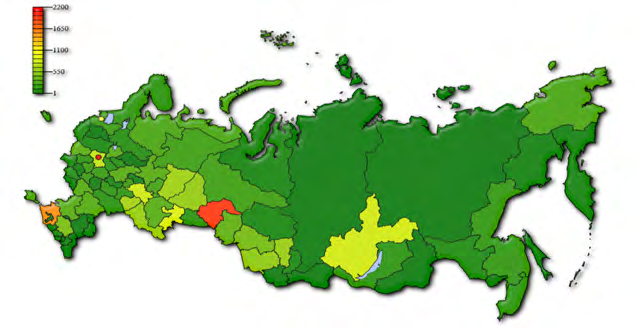
The prevalence of NETs is especially high in Moscow, Moscow Region, Krasnodar Territory, Tyumen Region, Chelyabinsk Region, Orenburg Region, Kemerovo Region, Sverdlovsk Region and Altai Republic (Figure 2).
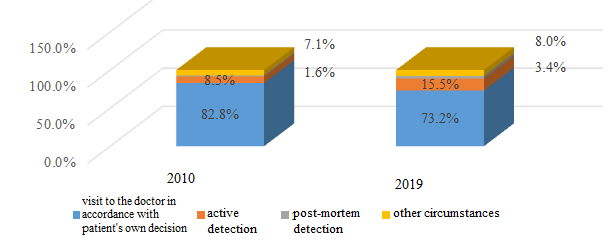
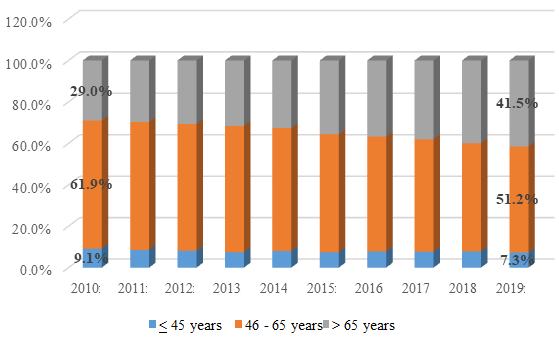
Percentage of actively detected cases of NET increased 2-fold over the last 10 years, from 8.5% in 2010 to 15.5% in 2019 (Figure 3).
decreased by 20%, from 9.1% to 7.3%, and the percentage of patients aged 46 to 65 years decreased by 17.2%, from 61.9% to 51.2% (Figure 4).
NET patient distribution by sex and location of the disease is shown in Figure 5.
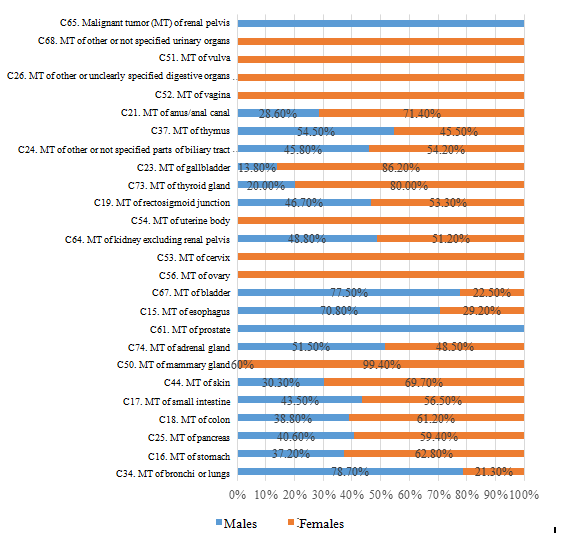
| Location | Percentage of all NETs |
| C15. MT of esophagus | 1.90% |
| C16. MT of stomach | 23.20% |
| C17. MT of small intestine | 10.30% |
| C18. MT of colon | 12.00% |
| C19. MT of rectosigmoid junction | 0.50% |
| C21. MT of anus/anal canal | 0.10% |
| C23. MT of gallbladder | 0.50% |
| C24. MT of other or not specified parts of biliary tract | 0.40% |
| C25. MT of pancreas | 16.90% |
| C26. MT of other or unclearly specified digestive organs | 0.10% |
| C34. MT of bronchi/lung* | 15,5% |
| C37. MT of thymus | 0,2% |
| C44. MT of skin | 3,2% |
| C50. MT of mammary gland | 3,1% |
| C51. MT of vulva | 0,04% |
| C52. MT of vagina | 0,1% |
| C53. MT of cervix | 1,2% |
| C54. MT of uterine body | 0,7% |
| C56. MT of ovary | 1,2% |
| C61. MT of prostate | 2,8% |
| C64. MT of kidney excluding renal pelvis | 0,7% |
| C65. MT of renal pelvis | 0,02% |
| C67. MT of bladder | 1,5% |
| C68. MT of other or not specified urinary organs | 0,04% |
| C73. MT of thyroid gland | 0,5% |
| C74. MT of adrenal gland | 3,1% |
Table 3: Patients newly diagnosed with a NET during the period from 2016 to 2019: distribution by disease location. *The item “NE
Table 3: Patients newly diagnosed with a NET during the period from 2016 to 2019: distribution by disease location. *The item “NETs of bronchi/lung” covers only highly differentiated NETs (ICD-O Codes: С34, 8240/3 and 8249/3). In view of significant difficulty of diagnosing large cell neuroendocrine carcinoma of the lung whose characteristics often correspond to those of a non-neuroendocrine large-cell cancer (in such cases it becomes classified as non-small cell lung cancer), the item “C34. MT of bronchi/lung” includes only highly differentiated NETs (typical or atypical carcinoids), thus excluding poorly differentiated neuroendocrine carcinomas, to avoid overestimation.
Percentages of different NET locations were analyzed on the basis of data from the National Cancer Registry, with the calculations being carried out in accordance with the WHO 2010 classification using ICD-O morphology codes. Results of this analysis are shown in Table 3. It follows from Table 3 that gastroenteropancreatic neuroendocrine tumors (GEP NETs) (enclosed in red lines in the table) are the most common tumors among NETs accounting for 65.9% of these tumors. The most common tumors among GEP NETs are gastric NETs (23.2%), pancreatic NETs (16.9%), colonic NETs (12.0%) and small intestinal NETs (10.3%). They are followed by bronchial/pulmonary NETs (typical or atypical carcinoids) accounting for 15.5% of these tumors. NETs of skin, mammary gland, adrenal gland, prostate and cervix accounted for 3.2%, 3.1%, 3.1%, 2.8% and 1.2% of these tumors respectively.
Most patients (80.2%) obtained treatment. The majority of patients (36.2%) obtained radical treatment - either complete or incomplete (24.0% and 12.2% respectively); 17.8% of patients received symptomatic therapy, and 26.1% of patients received palliative therapy (Figure 6).
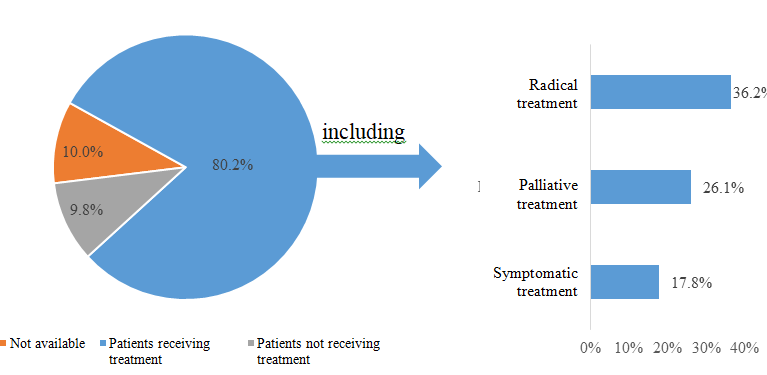
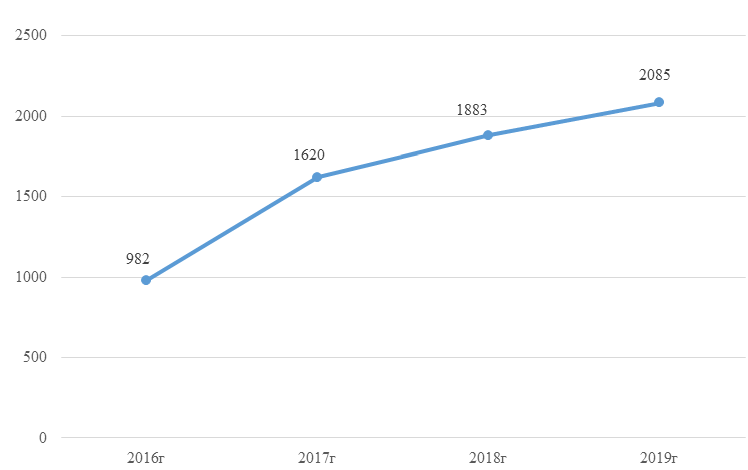
Treatment was not obtained due to somatic contraindications, contraindications for special treatment and refusal to obtain treatment by respectively 5.1%, 3.3% and 1.6% of patients. An important step in accumulation of knowledge about NETs in the Russian Federation was the establishment, on October 2, 2009, of the Medical Society for Treatment of Neuroendocrine Tumors (MOLNEO) at the premises of the federal state budgetary institution “N.N. Blokhin National Medical Research Center of Oncology” of the Ministry of Health of the Russian Federation (the FSBI N.N. Blokhin NMRC of Oncology); MOLNEO established with aim to improve the diagnosis and treatment of NETs in Russia is carrying out systematic recording of these patients in its NET patient registry (hereinafter referred to as “MOLNET Registry”). As of the end of 2019, the database of the MOLNEO Registry in the RF contains 2,085 records of NET cases (including records of 152 patients who died) that include detailed information about the disease, with specified Ki-67 proliferative index, degree of differentiation and NET functional status.
The MOLNEO Registry is based on the hospital registry of the FSBI N.N. Blokhin NMRC of Oncology of the Ministry of Health of Russia, the registry of the MR SBHI “M.F.
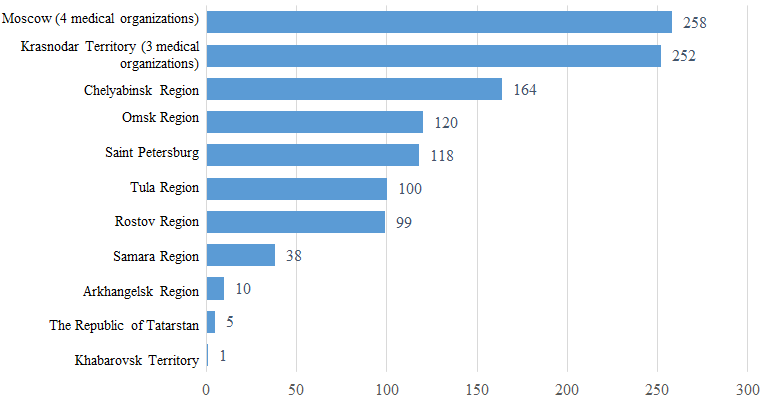
Vladimirskiy Scientific Research Clinical Institute of the Moscow Region” and the NETs registries of several subjects of the Russian Federation, including Omsk Region, Irkutsk Region, Republic of Tatarstan, Altai Territory, etc. On the whole, by end 2019, the number of unique records contained in the MOLNEO Registry after data transfers was 920 - i.e., 44% of the total number of records contained in the MOLNEO Registry. An additional 1165 (56%) NET patient records were entered by specialists during the period from 2016 to 2019. A total of 15 specialists from 11 subjects of the Russian Federation took part in establishing the MOLNEO Registry. The main information was obtained from the state budgetary healthcare institution (SBHI) “Chelyabinsk Region Clinical Center of Oncology and Nuclear Medicine”, Chelyabinsk (Pshichenko SV); the SBHI “Scientific Research Institute - Professor Ochapovskiy SV Territorial Clinical Hospital No. 1 of the Ministry of Health of the Krasnodar Territory, Krasnodar (Ponkina ON); the state healthcare institution (SHI) “Tula Region Oncology Dispensary” (Mamedov BB); the budgetary healthcare facility of the Omsk Region (BHF OR) “Clinical Oncology Dispensary”, Omsk (Pshevlotskiy EM); the SBHI “Saint Petersburg City Clinical Oncology Dispensary”, Saint Petersburg (Ivanova AK); the FSBI “Vishnevskiy AV NMRC of Surgery”, Moscow (Kaldarov AR); the Moscow Region SBHI “Vladimirskiy MF Scientific Research Clinical Institute of the Moscow Region”, Moscow (Byakhova MM); the SBHI “Clinical Oncology Dispensary No. 1 of the Ministry of Health of the Krasnodar Territory”, Krasnodar (Chukhrai ON); the FSBI “NMRC of Oncology of the Ministry of Health of Russia”, Rostov-on-Don (Trifanov VS); the SBHI “Samara Region Clinical Oncology Dispensary”, Samara (Zolotaryova TG); the SBHI “Loginov Moscow AS Clinical Research Center of the Department of Public Health of Moscow”, Moscow (Feydorov IY); the state autonomous healthcare facility “Republic Clinical Oncology Dispensary of the Ministry of Health of the Republic of Bashkortostan”, Ufa (Panova NH); and the territorial SBHI “Territorial Clinical Center of Oncology”, Khabarovsk (Novikova OY).
Temporal course of patient inclusion in the MOLNEO Registry is shown in Figures 7 & 8 shows patient distribution by subjects of the RF where the data was entered.
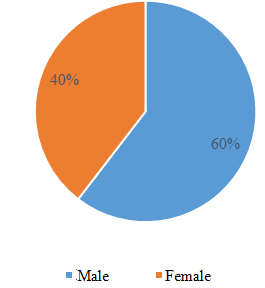
Among the patients whose data are included in the Registry, there are more females (60%) 3 than males (Figure 9); average age - 60 years (Table 3).
More than 80% of patients are older than 45 years (Table 4).
| Age | Number of patients |
| Under 25 years old | 22 (1.1%) |
| 26 to 45 years | 317 (15.2%) |
| 46 to 65 years | 965 (46.3%) |
| Over 65 years old | 775 (37.2%) |
| Age not specified | 6 (0.3%) |
| Average age | 60 |
| Median age | 61 |
Table 4: Patient distribution by age according to data from the MOLNEO Registry.
As of the end of 2019, average survival time calculated for 1777 patients whose diagnosis date had been specified accurately has been 6.3 years:
- In 53 patients, disease duration has been less than one year, and
- In the other 1724 patients, disease duration has been 6.5 years.
Race was specified for 1086 patients (52%), of them
- 1076 patients belong to the Caucasian race,
- 5 patients belong to the Mongoloid race, and
- 5 patients belong to the Negroid race.
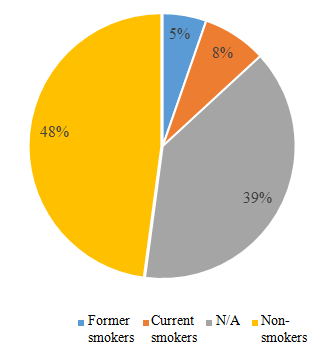
The majority of NET patients (53%) are not current or former smokers (Figure10).
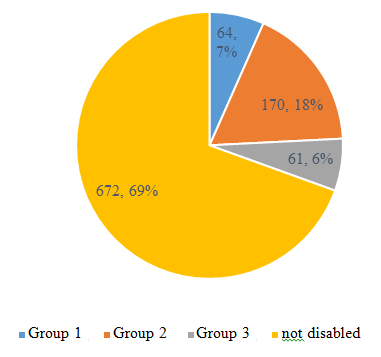
Records for 977 patients (47%) contain information on disability. The majority of these patients (69%) were not recognized as disabled on the grounds of having NET. Patient distribution by disability category is shown in Figure 11.
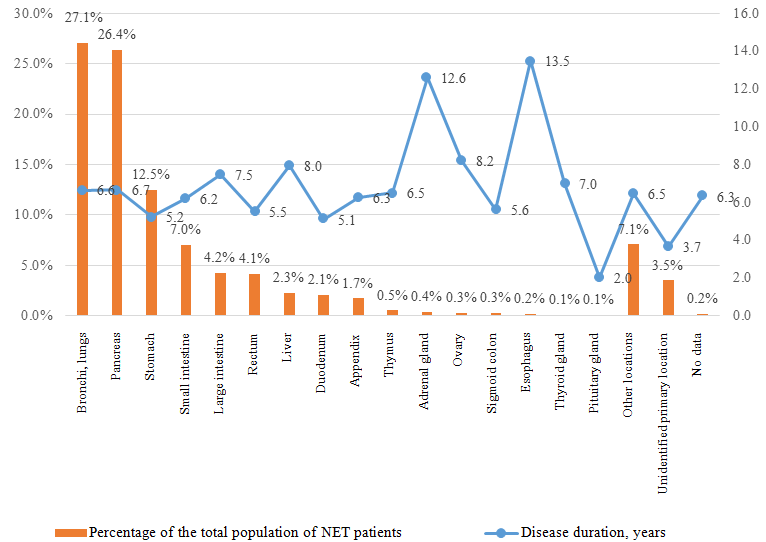
The most frequently reported NET locations are bronchi/lungs (26.4% of patients) and pancreas (26.3% of patients). These two locations account for more than half of the reported cases (Fig. 12). The majority of patients (60.8%) have GEP NETs.
Taking into account that the category “Unidentified primary location of NETs” (3.5% according to MOLNEO Registry data) is dominated by unidentified pancreatic and/ or small intestinal NETs, the percentage of GEP NETs may be approximately 64.3%, thus being practically similar to NETs data from the National Cancer Registry and reflecting the real situation in both Russia and the majority of other countries.
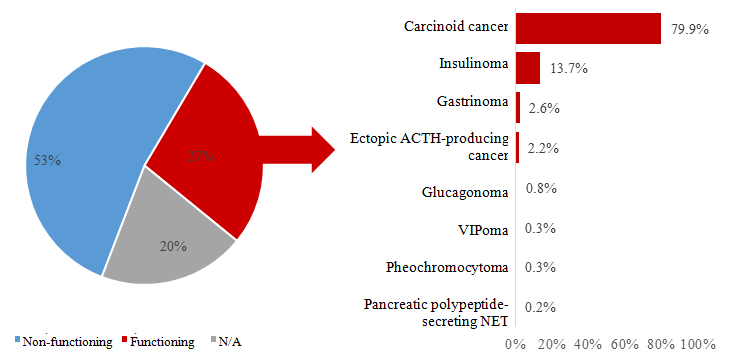
In 27% of all NET patients, the tumor is functioning, and 80% of these functioning tumors are manifested by carcinoid syndrome (Figure 13).
The majority of NET patients have highly differentiated or moderately differentiated NET (Figures 14 & 15).
according to data from the MOLNEO Registry.
Conclusion
In conclusion, it should be noted that, according to data from the MOLNEO Registry, highly differentiated NETs are more frequently diagnosed in patients aged 46 to 65 years, and an increasing percentage of patients over 65 years old has been noted in the last years. The disease rate is higher in women than men.
Gastroenteropancreatic neuroendocrine tumors (GEP NETs) are the most common tumors among NETs accounting for 60.8% of these tumors; of them, the most common tumors are pancreatic NETs accounting for 43.5% of all GEP NETs or 26.4% of all NETs. The percentage of bronchial/pulmonary NETs is 27.1%; these tumors occupy the second place after gastrointestinal/pancreatic tumors. The percentage of tumors whose primary location was not identified is 3.5%; this category is dominated by small intestinal NETs and pancreatic NETs.
The longest disease duration was revealed in patients with adrenal NETs (12.6 years; the percentage of the whole patient population - 0.4%) and in patients with esophageal NETs (13.5 years; the percentage of the whole patient population - 0.2%). Data on tumor functional status were not collected from 20% of respondents. Most often, the absence of this data is an evidence of the absence of symptoms of a carcinoid syndrome. According to data from the Registry, the percentage of functioning tumors is 27%; of them, carcinoid syndrome was identified in 79.9% of patients, and insulinoma was diagnosed in 13.7% of patients.
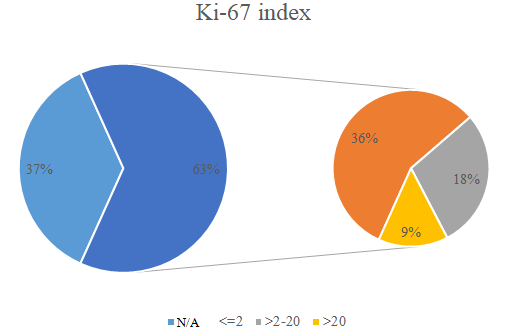
Information about Ki-67 proliferative index was provided for 63% of tumors; the majority of these tumors (57.14%) are G1 tumors (Ki-67 ≤2%); the percentage of NET patients with a Ki-67 index value ranging from >2 to 20% is 28.57%, and the percentage of NET patients with a Ki-67 index value exceeding 20% is 14.28%. The majority of NETs were categorized as G1 or G2 tumors in accordance with current classification of GEP NETs.
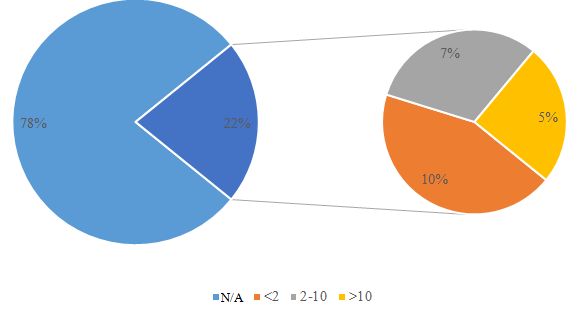
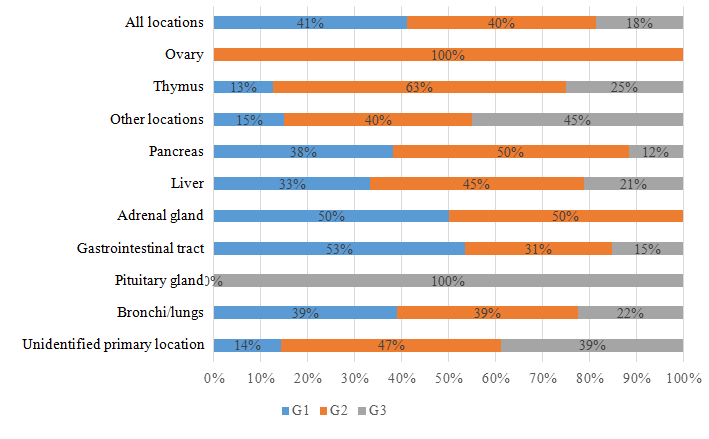
Mitotic index (MI) was specified for only 22% of respondents; of them, 45% of patients had MI <2%, 32% of patients had MI ranging from 2 to 10%, and 23% of patients had MI exceeding 10%. Thus, this data shows that 81% of NETs of any location are G1 or G2 tumors: percentages of highly differentiated pancreatic, gastrointestinal, adrenal and ovarian G1/G2 NETs are respectively 88%, 85%, 100% and 100%.
Analysis of data from the MOLNEO Registry has shown that our data corresponds to the international data obtained in the European countries and the USA and differs from the epidemiological data obtained in China where bronchial/ pulmonary NETs prevail (Table 5).
| Organs | Total | |
|---|---|---|
| Cases | Percentage | |
| Trachea, bronchi, lungs | 8 345 | 68.01 |
| Pancreas | 1 028 | 8.38 |
| Stomach | 709 | 5.78 |
| Cecum and rectum | 595 | 4.85 |
Table 5: Incidence of NETs in China according to data from 339 oncology registries (2014) Zhao H, et al. [5].
In 2019, incidence of NETs in the RF was 5.19 per 100,000 population. In 2017, prevalence of NETs in the RF was 14.75 cases per 100,000 population, which corresponds to that in countries with the highest prevalence of NETs - i.e., Switzerland with 13.09 cases per 100,000 population and Czechia with 16.11 cases per 100,000 population [6, 7].
Taking into consideration the temporal course of the incidence of NETs in the RF and other countries - in particular, the USA where the incidence increased from 5.25 cases per 100,000 population in 2004 to 6.98 cases per 100,000 population in 2012 and to 8.4 cases per 100,000 population in 2016 - one can agree with Professor James Zhao’s statement made at the European Neuroendocrine Tumor Society (ENET) Congress (2020) that NETs are unlikely to be categorized as rare diseases in the near future.
References
-
Pape UF (2020) Epidemiology in Austria. Presented on ENETS Virtual Conference 11-13 of March 2020.
-
Huguet I, Grossman AB, Otoole D (2017) Changes in the Epidemiology of Neuroendocrine Tumours. Neuroendocrinology 104(2): 105-111.
-
Das S, Dasari A (2021) Epidemiology, Incidence, and Prevalence of Neuroendocrine Neoplasms: Are There Global Differences? Current Oncology Reports 23(4): 43.
-
Yao JC (2020) Epidemiology of NET: An US perspective. Presented on ENETS Virtual Conference 11-13 of March 2020.
-
Hong Zhao VD (2020) Neuroendocrine tumors in China. Presented on ENETS Virtual Conference 11-13 of March 2020.
-
Dasari A, Chan S, Halperin D, Zhao B, Zhou S, et al. (2017) Trends in the Incidence, Prevalence, and Survival Outcomes in Patients with Neuroendocrine Tumors in the United States. JAMA Oncology 3(10): 1335-1342.
-
Leoncini E, Boffetta P, Shafir M, Aleksovska K, Boccia S, et al. (2017) Increased incidence trend of low-grade and high-grade neuroendocrine neoplasms. Endocrine 58(2): 368-379.
- Shaping Healthy Futures: Pediatric Endocrine Breakthroughs of 2025
- Precision Medicine in Obesity: Customizing Treatment for 2025
- The Thyroid Revolution: How 2025 is Redefining Hormone Health
- Editorial- Targeting Immunometabolism for Generating Innovative Therapies for Cancer
- Current Knowledge of Chickenpox
- Correlation of Preinjection Values of Gonadotropins and Estradiol Level with Clinical and Radiologic Evidence of Sufficient Pubertal Suppression in Girls with Central Precocious Puberty