Analysis of Different Data Sets of the Same Clinical Trial May Yield Different Results
In a randomized clinical trial (RCT), analysis of different data sets of the same clinical trial may change the meaningfulness of the difference between the study groups depending on which data sets are compared. Possible data sets are intention to treat (ITT), per protocol or on treatment (PP), as treated (AT).The specific conditions that may cause the greatest likelihood of affecting the outcome, depending on the choice of data sets compared should be further investigated.
Choice of Data Set, another Bias?
The data set used in the analysis, as well as the analytical method may also be compromising agents, less Conceptual Paper recognized forms of bias, in the investigator’s quest to reach a realistic estimate.
Data Sets
Depending on the course and / or design of the randomized clinical trial (RCT), the analysis can be performed on one of possibly three data sets: intention to treat (ITT), per protocol or on treatment (PP), as treated (AT) These are merely ways to arrange the data to be compared. ITT: All randomized volunteers in their original randomized groups. PP: Only the volunteers completing the study as described in the study protocol, necessarily in their original randomized groups. AT: Only the volunteers completing the study, not necessarily in their original randomized groups, but in their final treatment groups at the end of the trial. To choose the right way may not be easy.
Example
Let us have a brief look at how these data sets may be formed and what their structure may suggest.
In a parallel double blind RCT, like the example provided by the NIH, there can be a number of changes during the course of the trial [2].
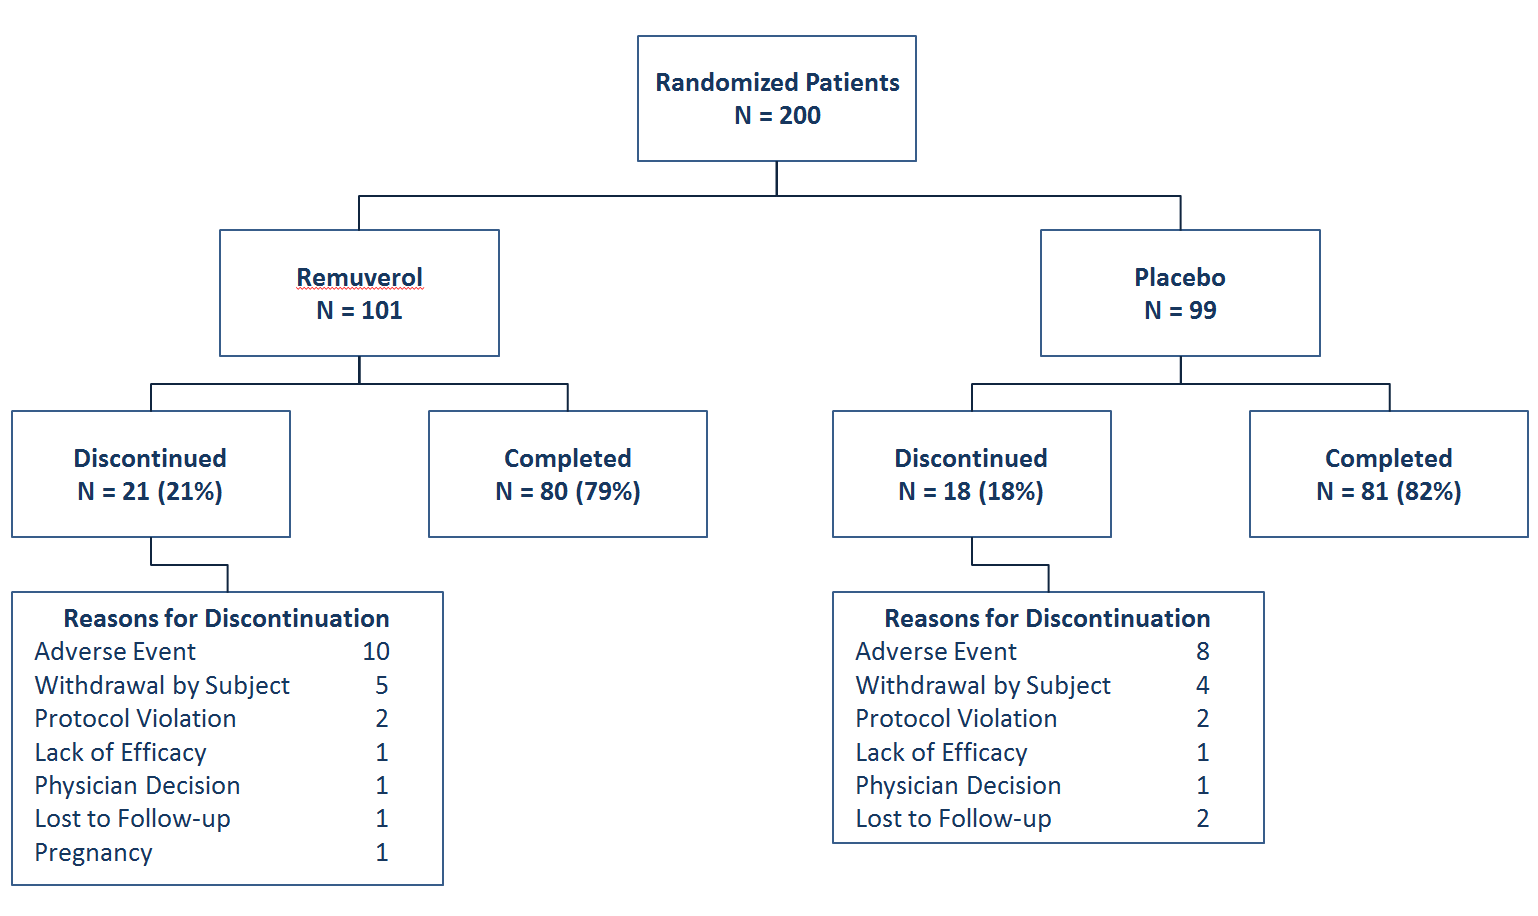
We may have expected cross-overs as well. For example, some volunteers not benefiting from one treatment could have been switched to the other treatment, if the protocol specified the conditions for such a switch. Had this been the case, we would also have a number of volunteers who were randomized to the Placebo arm but completed the study in the Remuverol arm and vice versa. These numbers would also be reported in the summary chart above. Let us, for the sake of the argument assume 20 volunteers in the Placebo arm were switched to Remuverol and 10 volunteers from the Remuverol arm were switched to placebo.
Compare which Data
This brings us to the question of this article. Assuming we already agreed on which analysis to do, which data sets should we compare?
Our options: 1. We may compare the 80 Remuverol cases with the 81
Placebo cases, who completed the study with conditions specified in the protocol, discounting all the withdrawals and the cross-overs as if they did not exist (PP). 2. We may compare all 101 cases starting out as Remuverol and all 99 cases starting out as Placebo, disregarding all the withdrawals and the cross-overs, as if they did not happen (ITT). 3. We may compare the 90 cases (80 proceeding as Remuverol– 10 switching to Placebo + 20 switching to Remuverol) ending up as Remuverol cases against the 71 cases (81 proceeding as Placebo – 20 switching to Remuverol + 10 switching to Placebo) (AT).
Please note it is not only numbers in all these scenarios but also the data of the relevant volunteers that change positions or are discounted from study arms.
An additional cause for concern is, as simple as these scenarios may appear, there is debate and disagreement on many issues, especially about cases with incomplete data [3]. As it happens data may be compiled differently by different investigators, even when they agree on principles.
If the analyst choses the frequentist approach, he/she will be trying to see if the groups are significantly different, if the resultant p is less than the chosen α value (usually chosen to be 0.5; p < 0.5) by the investigator.
Conclusion
There will very likely be specific combinations of withdrawals and cross-overs that will result in a change in the meaningfulness of the difference between the groups, depending on which data sets are compared. It may even be possible that the meaning in the difference may be reversed.
For instance, in a specific withdrawal and cross-over combination, the analyst may find that the PP data set analysis reveals a meaningful difference favoring the Remuverol arm, whereas the ITT datasets are not meaningfully different. In a placebo trial it would be unlikely to find a dataset producing a meaningful difference favoring placebo, but in a drug vs. drug trial, that kind of change may also be possible.
There are rules of thumb about when to choose which data sets to compare. Analysis by ITT means that a trial’s results include the totality of patient follow-up for all randomized patients [4]. ITT analysis is usually preferred as the data set to work with as it generally provides bias-free analysis. Caution is still advised because the data set as well as method of analysis should match the intention of the RCT. Rules of thumb are only generally helpful. It is up to the investigator and the analyst to assure them that their estimation is indeed bias-free.
It may be prudent to run the analyses on each data set separately and see if they agree, and think about how it may be explained, it if they do not. Nevertheless this is a relatively grey area and it is the opinion of this author that the specific conditions like the percentage of cross- overs patients, losses to follow up etc. that appear to cause the greatest likelihood of affecting the outcome, depending on the choice of data sets compared, should be further studied and elucidated, probably with the aid of carefully constructed simulations. Having this knowledge would alert the investigator and the analyst when they are likely to be on shaky ground.
References
-
Friedman LM, Furberg CD, DeMets D, Reboussin DM, Granger CB (2015) Fundamentals of Clinical Trials, 5th (Edn.), Chapter 18, Issues in Data Analysis, Springer International Publishing, Switzerland, pp: 403-462.
-
ClinicalTrials.gov (a service of the National Institutes of Health) (2014) Parallel_Study_Design_Example: Figures and Table.
-
Kristin L Sainani (2010) Making Sense of Intention- to-Treat. PM R 2(3): 209-213.
-
Pocock SJ, McMurray JJV, Collier TJ (2015) Statistical Controversies in Reporting of Clinical Trials: Part 2 of a 4-Part Series on Statistics for Clinical Trials. J Am Coll Cardiol 66(23): 2648-2661.
- Origin, Evolution, and Functional Impact of Short Insertion- Deletion Variants in Human Genomes: A Review
- Harnessing Molecular Glues for Next-Generation Vaccine, Cancer and Cardiovascular Disease Drug Development: A Comprehensive Review
- Lateral Cervical Epidermal Inclusion Cyst in a Paediatric Patient: A Rare Case Report
- Malarial Plasmodium Falciparum with Hepatitis B and C Virus Infections among Blood Donors in Ife Central Local Government Area, Ile Ife, Osun State, Nigeria
- Withanolides and Withaferin A- What’s next in Ashwagandha Research
- Designing of Dual Pulse Photoacoustic Tomography for Imaging of Drug-Response and Tumor Growth