Isolation and Characterization of New Compound and its Antibacterial Activities from Stem-Bark Extract of Barringtonia Asiatica
Objective: This investigation involves the extraction, isolation, and characterization of chemical constituents from a Barringtonia family plant, Barringtonia asiatica followed by Antibacterial, cytotoxicity and evaluation of its antioxidant principles. Methods: The dried stem-bark powders were subjected to sequential soaking with polar and nonpolar solvents and extraction using rota-vap. Dichloromethane extract reveals the presence of significant amount of phytochemicals. The dichloromethane extract was subjected to isolation using column chromatographic analysis with solvents such as, dichloromethane, chloroform, hexane, ethyl acetate and methanol. Further, the isolated compound was subjected to thin layer chromatography technique and spectral analysis such as infrared, 1H-NMR, 13C-NMR, FT-IR, and mass spectroscopy. The antibacterial using agar disc method. Results: The compound was isolated in hexane: ethyl acetate (9:1) and dichloromethane: ethyl acetate in the solvent system in the ratio of 9:1 and 7:3, respectively using column chromatographic technique. On the basis of phytochemical, chromatographic, and spectral analysis, the isolated compounds were identified as Nerolidiol and Heneicosane. Conclusion: This compound was isolated for the first time from the stem-bark of Barringtonia asiatica. The in vitro antioxidant assay of isolated compounds has shown a dose-dependent increase in free radical scavenging activity using DPPH, the antibacterial and artemia salina cytotoxicity testing showed a significant result. The chromatographic separation led to the isolation of Nerolidiol (1) and Heneicosane (2). Their structures were determined by 1H-NMR, 13CNMR, IR and MS data analysis as well as by comparison of their data with the published values.
Isaac John Umaru1,2*, Hauwa A Umaru3 and Kerenhappuch I Umaru4
Sarawak, Kota Samarahan Malaysia. Email: umaruisaac@gmail.com principles.
The antibacterial using agar disc method.
NMR, IR and MS data analysis as well as by comparison of their data with the published values.
Isolation and Characterization of New Compound and its Antibacterial Activities from Stem-Bark Extract of Barringtonia Asiatica Ann Adv Biomed Sci
Keywords: Isolation; Characterization; Phytochemicals; Stem-bark; Barringtonia asiatica; Antioxidant; Cytotoxicity;
Antibacterial
Introduction
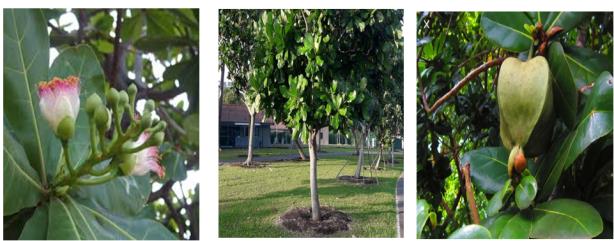
Focus on medicinal plant research has increased worldwide and evidence abounds in the immense potentials of medicinal plants such as Barringtonia asiatica used in various traditional systems. Various medicinal plants have been studied using different scientific approaches and results from these studies have revealed the potentials of medicinal plants in pharmacology [1]. This medicinal plant Barringtonia asiatica is of great importance to the health of the individuals and communities to larger extend, and nutritional benefits are derived from these plants since they are commonly used as vegetables.
The search for new drugs worldwide has become a necessary tool due to so many health challenges arising from resistant species of diseases causative agents and discovery of different species and trends of bacteria and viruses. These have therefore turned researchers to plant sources for the active phytochemicals that could combat these new trends in health challenges; thus, plants hold the key to the discovery and development of new pharmaceutical and biological resources that will champion the course of health and well-being of human. These various plants on which human and animal’s life depend on for food contains thousands of phytochemicals and allelochemicals [2] which constitute anti-nutritional or beneficial factors to the consumer. It was therefore observed from outcome of research works that the medicinal value of these plants and medicinal plants lies in some chemical substances that produces a definite physiological action on human body.
Thus, the use of medicinal plants in the world traditional medicine has been in practice for a long time, and the practice is now becoming increasingly popular, especially as an alternative or as a compliment to modern medicines [3]. They have been used in various traditional medicinal practices especially for the treatment of cancer, cardiovascular diseases, hypertension, ulcer, rheumatic disease, asthma and other health problems [4]. The medicinal activities of the plants have long been associated with the production of secondary metabolites which includes tannins, terpenoids.
Also searching for new lead compounds to be developed as drugs or as templates for analogue synthesis and the evaluation of traditional medicine and herbal medicinal products, are the two basic reasons for the advancement of work on medicinal plants. This could also be partly justified by the fact that natural product inspired molecules represented about 80% of drugs that had been put into the market [5, 6].
The Aim of this study was in order to isolate chemical compounds and to test the biological activity of the isolated compounds. Thus, the vast medicinal potentials of Barringtonia asiatica have not been explored as seen from literature survey. Not much work has been reported on the isolation of chemical compounds as well as biological activity of the isolated compound from the stem-bark of Barringtonia asiatica.
Material and Methods
Plant Material
Sample Collection: Fresh plant material was collected from Merenak river bank at Kota-Samarahan, Sarawak Malaysia. The plant was authenticated by a Botanist in the Faculty of Resource Science and Technology, Universiti Malaysia Sarawak. The identified and certified plant materials were given a voucher number as IJU15010238 (Barringtonia asiatica stem-bark. The fresh stem-bark from the plant was carefully pealed and washed under running tap water. It was then air dried to be free of water and cut into smaller pieces, then spread in the laboratory and allow to dry at room temperature until they were fully dried. Sample Preparation: Dried plant materials (stem-bark) were ground into fine powder form using laboratory pestle and mortar and electric grinder. The finely ground powdered samples (mesh 30) were packed into clean, dry sample containers and were labelled appropriately and kept for further use. Extraction was carried out by the conventional solvent extraction method described by Fasihuddin et al. [7]. This was achieved by soaking the ground plant material in solvents in the order of increasing polarity. A total of 2 kg of the dried and ground powdered sample was extracted using cold soaking method with hexane. The sample were soaked in the hexane with the ratio of 1:3 (sample: hexane) in a 5 liters Erlenmeyer flasks at room temperature for 5-7 days. The resulting hexane solution was then filtered using Whatman filter paper No 4 and the residue was then re- extracted with fresh hexane for another 72 hrs and filtered. Both extracts were combined and evaporated to dryness with a rotary evaporator (Heidolph Laborota 4000 efficient) under reduced pressure below 50oC to obtain the hexane crude extract. The residue was re- extracted using similar procedure with dichloromethane, followed by chloroform, ethyl acetate and methanol to obtain respective crude extracts. The dry weight and percentage yield of each crude extract were determined (simple percentage) [8].
Isolation and Identification of Secondary Metabolites
Isolation and Purification Column chromatography: The basic principle of column chromatography is to separate a mixture of metabolites based on their molecular weight and polarity. A glass column of size 40/34 (large) was used for chromatography, and the sorbent used was silica gel 60 (Merck 70-230 Mesh ASTM 0.063 0.200 mm). Silica gel slurry was prepared by dissolving silica gel (150 g) with suitable solvent, usually hexane. The column was prepared by pouring a slurry mixture of silica gel and solvent, into a glass column and allows it to settle down [9]. The packed column was left overnight before 4-10 g of sample was introduced onto the top of the packed column via wet-packing method or dry-packing method. The column was eluted with suitable solvent systems with increasing polarity [7]. The column's valve was then opened and about 10-30 mL fraction of the solvent coming out from the column was collected in test tubes [10]. The procedure was repeated by using different solvent systems, based on increasing polarity (Table 3.1). Samples from the column fractions were examined by using TLC plates in few suitable solvent systems to obtain the retention factor (Rf) of any components that appeared as spots. Fractions with similar Rf values were combined [10]. Fractions which contain more than one component were further isolated and purified by using smaller glass column of sizes 24/29 (medium) or 14/23 (small) with suitable solvent systems.
Fraction with single component (one spot) that appeared in TLC plate was treated as possible pure secondary metabolite. The combined fractions which contained the same single component was then allowed to air-dried or evaporated to dryness to obtain a pure secondary metabolite.
| S/n | Solvent | Volume to volume ratio (v/v) | Volume (mL) | ||||||||
|---|---|---|---|---|---|---|---|---|---|---|---|
| 1 | Hexane | 1 | 400 | ||||||||
| 2 | Hexane: DCM | 19:1 | 400 | ||||||||
| 3 | Hexane: DCM | 15:1 | 400 | ||||||||
| 4 | Hexane: DCM | 9:1 | 400 | ||||||||
| 5 | Hexane: DCM | 5:1 | 400 | ||||||||
| 6 | Hexane: DCM | 1:1 | 400 | ||||||||
| 7 | DCM | 1 | 400 | ||||||||
| 8 | DCM: CHCl 3 | 19:1 | 400 | ||||||||
| 9 | DCM: CHCl 3 | 15:1 | 400 | ||||||||
| 10 | DCM: CHCl 3 | 9:1 | 400 | ||||||||
| 11 | DCM: CHCl 3 | 5:1 | 400 | ||||||||
| 12 | DCM: CHCl 3 | 1:1 | 400 | ||||||||
| 13 | CHCl 3 | 1 | 400 | ||||||||
| 14 | CHCl : EA 3 | 19:1 | 400 | ||||||||
| 15 | CHCl : EA 3 | 15:1 | 400 | ||||||||
| 16 | CHCl :EA 3 | 9:1 | 400 | ||||||||
| 17 | CHCl : EA 3 | 5:1 | 400 | ||||||||
| 17 | CHCl :EA 3 | 1:1 | 400 |
Table 1: Organic solvent systems used as eluting solvents for column chromatography. DCM: dichloromethane, CHCl3: chloroform, EA:
| 18 | EA | 1 | 400 |
|---|---|---|---|
| 20 | EA: MeOH | 19:1 | 400 |
| 21 | EA: MeOH | 15:1 | 400 |
| 22 | EA: MeOH | 9:1 | 400 |
| 23 | EA: MeOH | 5:1 | 400 |
| 24 | EA: MeOH | 1:1 | 400 |
| 25 | MeOH | 1 | 400 |
Table 2: Organic solvent systems used as eluting solvents for column chromatography. DCM: dichloromethane, CHCl3: chloroform, EA:
Table 1: Organic solvent systems used as eluting solvents for column chromatography. DCM: dichloromethane, CHCl3: chloroform, EA: ethyl acetate, MeOH: methanol. Thin Layer Chromatography (TLC): The eluents collected from column chromatography, were subjected to thin layer chromatography (TLC) analysis. TLC was carried out using the method described by Isaac et al. [11]. A glass capillary tube was used to apply samples on the TLC plates (size 6.6 x 20 cm, 5 x 20 cm) repeatedly with a spot of about 0.3 mm in diameter. The TLC plate was then placed in a rectangular glass developing chamber with its lower marked edge (1 cm from the base) dipped into a developing solvent below the mark where the samples were spotted. The plates were allowed to develop to the level of upper mark (4 cm from the base) and then removed and dried. The TLC plates were then viewed directly for colored compounds, it was also viewed under UV box for UV fluorescent compound and stained with vanillin for compound that are neither visible nor UV fluorescence. Fractions containing similar characteristics were combined and dried.
Chemical Structure Elucidation
Gas Chromatography–Mass spectrometry (GC-MS): Gas chromatography (GC) analysis of fractions that were obtained from TLC as single spot was performed using a Shimadzu GC-Mass Spectrometry model QP2010 plus, equipped with a BPX-5 column (5% phenyl polysylphenlenesiloxane) of 30 m in length, film thickness of 0.25 µm and internal diameter of 0.25 mm. The operating method was based on the method described by Kalaiselvan et al. (2012). Ionization energy of 70 eV was used in the electron ionization energy system of the GC- MS for detection and carrier gas, helium (99.999%) at a constant flow rate of 1 mL per min was used. Exactly 1 µL of purified sample was injected into the GC-MS using a syringe and sample was analyzed using split mode with ration of 25:1. Injection temperature was set at 260oC and the oven temperature was programmed from 60 oC with an increase of 10oC per min, isothermal for 5 min, to 280oC, ending with 10 min isothermal at 280 oC at 70 eV. A mass spectrum was taken at a scan interval of 0.5 sec and fragments from 45 to 450 Da. By matching its average peak area to the total areas, the relative percentage quantity of each component was acquired. Compound identification was obtained by matching the retention times of the compounds and the mass spectral obtained from the library data of the corresponding compound. Fourier Transform Infra-Red Spectrometry (FT-IR): Fourier Transform Infra-Red (FT-IR) was performed using FTIR spectroscopy (Thermos Scientific, Nicolet iS10 SMART iTR) to detect the chemical bonds (functional groups) of the compounds. The operating system was based on the method described by Shalini and Sampathkumar [12]. The liquid samples were introduced into the machine and scan range was set from 400 to 4000 cm-1 with a resolution of 4 cm-1. Characteristic of the chemical bonds was read by spectrum produced through transmittance of wavelength of light. The chemical bond in a molecule was detected by interpreting the infra-red transmittance spectrum and the functional groups of the compounds were identified based on the Table of Characteristic IR absorptions published in Organic Chemistry [3]. Nuclear Magnetic Resonance (NMR): Nuclear Magnetic Resonance (NMR) spectrometry was performed using JEOL JNM-ECA 500 Spectrometer. The operating system was based on the method described by Efdi, et al. [14]. Sample was dissolved in 0.8 mL chloroform D1 (CDCl3) or Acetone D6 and placed into NMR tube to a sample depth of 4 cm and the 1H (500 MHz) and 13C (125 MHz) spectra were measured. Chemical shifts were reported as δ units (ppm) with tetramethysilane (TMS) as internal standard and coupling constants (J) in Hz. Integration of the 1H- NMR and 13C-NMR data was performed by using DELTA version 5.0.4 software by JEOL. The identification of each 1H-NMR and 13C-NMR detected was based on the Table of Characteristic NMR absorptions published in Organic Chemistry [13] and with the guide of the possible proposed structure given by NIST library. Melting Point: The melting point of the compounds isolated was determined using a melting point apparatus (Stuat model SMP3). Small amount of the sample was put into a small capillary tube and was inserted into the machine melting point heating bath. The heating process was monitored and the temperature at which the sample begins to melt and completely melted was recorded.
Biological Activity
Brine shrimp (Artemia salina) Lethality Test: The LC50 of the plant extracts was determined using brine shrimp lethality test. The test was conducted using larvae of Artemia salina based on method developed by McLaughlin, et al. [15] and Isaac, et al. [16]. One spatula full of brine eggs was placed into a 250 mL beaker containing 150 mL of sea water placed under light environment. A source of O2 supply was connected to the beaker using water pump at reduced pressure and allowed for 72 hrs to hatch. The brine shrimp (nauplii) were then used for the test. Exactly 4 mg of each extract was dissolved in 200 µL of DMSO (RCI Labscan limited) and a lower series of chosen concentration was prepared by serial dilution with DMSO. The assay system was prepared with 5 mL of filtered seawater containing chosen concentration of extract and 1% yeast extract (for feeding) in a pre-marked 6-well microplate and 10 brine shrimps were carefully taken with micropipette and introduced into each microplate. This was done in triplicates making a total of 30 brine shrimps per concentration. Filtered seawater was added to DMSO and 10 brine shrimps in triplicates and this was used as the control groups. If the brine shrimp in these microplates shows a rapid mortality rate, then the test is considered invalid as the nauplii might have died due to some reasons other than the cytotoxicity of the extracts. The setup was allowed to remain for 24 hrs under constant illumination of fluorescent and number of survived nauplii were counted with a hand lens. Based on the data obtained, the average death of the brine shrimp at different concentrations of the extract and the LC50 of the extract was calculated using probit regression by statistical software SPSS 22 and the result was expressed as mean + SD at the 95% level of confidence (p < 0.05). DPPH (2,2-diphenyl-1-picryl-hydrazyl) Free Radical Scavenging Assay (Antioxidant): The free radical scavenging assay of compound 2,2-diphenyl-1-pycryl- hydrazyl (DPPH) was used to evaluate the antioxidant properties of the crude extract. The measurement was based on the method described by Wang, et al. [17]. The sample was prepared by diluting 6 mg of crude extract into 6 mL of methanol, producing a concentration of 1000 µg/mL. The stock solution was sonicated to ensure the homogeneity of the sample. Three other concentrations were prepared at 10, 50 and 100 µg/mL, diluted from the
1000 µg/mL stock solution. Sample of 5000 µg/mL was prepared separately by diluting 25 mg of crude extract into 5 mL of methanol.
Approximately 3 mL of 0.1 mM solution of 2,2- diphenyl-1-pycrylhydrazyl (DPPH) in methanol was each added into five series of prepared concentrations (10, 50, 100, 1000 and 5000 µg/mL) of sample solutions (1 mL). Analysis was done in triplicate. The solution was mixed vigorously and left to stand at room temperature for 30 minutes in the dark after which its absorbance was measured spectrophotometric ally at 517 nm using Jasco ultra violet spectrophotometer model V-630. Methanol was used as blank (only methanol) and negative control (1 mL methanol mixed with 3 mL DPPH), while ascorbic acid (vitamin C) as the standard. The concentration of the sample required to inhibit 50% of the DPPH free radical was calculated as IC50 and the value was determined using Log dose inhibition curve which performed by using PRISM version 3.02 software, based on the calculated values of the DPPH scavenging activity (%) of the sample [18]. Antimicrobial Activity Antibacterial Assay Test Microorganisms: Bacterial strains Escherichia coli (E. coli), Salmonella typhii (S. typhii) and Staphylococcus aureus (S. aureus) were selected for the study. The bacterial strains were obtained from the Microbiology Laboratory, Faculty of Resource Science and Technology, University Malaysia Sarawak, and were used for the antibacterial activities. The stock cultures were incubated at 37oC for 24 hrs on nutrient agar (Micro care Laboratory, Surat, India), and was stored at 4oC. Plates containing Mueller-Hinton Agar (MHA) were used to grow the bacterial strains at 37oC. The stock cultures were then kept at 4 oC until use. Antibacterial assay: Antibacterial activity of stem-bark was determined against three pathogenic bacterial strains E. coli, Salmonella typhi and Klebsiellia. pneumonia using disc diffusion method as reported by various authors [16, 19]. The extract was dissolved using methanol (MeOH) and sterilized by filtration and stored at 4oC until use. Standard antibiotics (tetracycline) were used for comparison of the zone of inhibition of the pure strains of the bacteria. The extracts were then screened for their antibacterial activity against the bacterial strains. Set of four dilutions for antibacterial activity (50, 100, 200, 400 μg/mL) of the stem bark of Barringtonia asiatica and standard drug tetracycline disc was used. Sterile plates containing Mueller-Hinton agar incubated with bacterial strains and control experiment using tetracyline as standard drug were kept for 3 hrs at 37oC. The set up was allowed for 18 to 24hrs at 37oC, and the zones of growth inhibition around the disks were measured in mm. The antibacterial activity of the test organisms on the plant extracts were determined by measuring the diameter of the inhibitory zones on the surface of the agar around the disk. The experiment was carried out in triplicate and the mean values of the diameter of zones of inhibition were calculated using statistical software SPSS 22.
Statistical Analysis
All results were expressed as Mean + SD. Data was analyzed statistically by one-way analysis of variance (ANOVA). The significance of the difference between the means of test and control studies was established and P values less than 0.05 were considered significant.
Physical Properties and Spectrometry Information of Pure Compounds
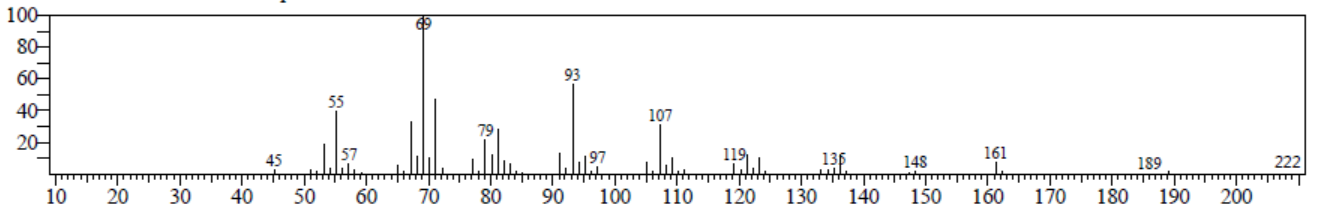
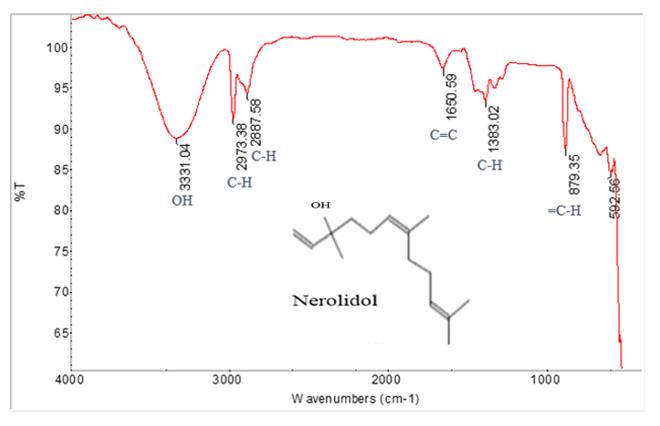
Compound 1 (Nerolidol): Nerolidol (1); Yellow; melting point 20-21 oC; IR Vmax cm-1: 3331, 1650, 1383, 879; MS m/z (% rel. int): 45(1), 55 (45), 57(5), 69(100), 79(18), 93(60), 97 (5), 107 (40), 119 (8), 136(10), 148 (2), 161 (5), 189 (1), 222 (1): 1H-NMR (500 MHz, CDCl3) δ (ppm): 5.13; 5.17, (H-1), 5.89 (H-2), 1.38;1.63 (H-4), 2.00 (H-5), 5.26 (H-6), 1.89 (H-8), 2.23 (H-9), 5.27 (H-10), 1.53 (H- 12), 1.54 (H-13), 1.61 (H-14), 1.38 (H-15). 13C-NMR (500 MHz, CDCl3): δ (ppm): 112.25(C-1), 139.33(C-2), 70.48(C- 3), 41.53(C-4),21.89(C-5), 124.10 (C-6), 133.79 (C-7), 38.66 (C-8), 26.41 (C-9), 124.12 (C-10), 130.69 (11), 24.97 (12), 17.26 (13), 15.73 (14), 28.05 (15). Compound 2 (Heneicosane): Heneicosane (2) yellow; melting point 40-41 oC; IR Vmax cm-1: 2973, 1650, 2882, 1458, 879; MS m/z (% rel. int): 40(5), 41 (12), 43 (65), 57 (100), 71 (70), 85 (55), 99 (30), 113 (15), 127 (10), 141 (10), 155(5), 169 (2), 183 (2), 197 (1), 211 (1), 225 (1), 239(1), 253 (1), 267(1), 281 (1), 296(1), 309 (1), 323 (1),
337(1), 350(1), 365(1), 379(1), 393(1), 407(1), 426(1), 440(1), 460(1), 479(1) 493(1): 1H-NMR (500 MHz, CDCl3) δ (ppm): 0.89 (7H, m, H-1/H-21), 1,26 (37H, s, H-2-H-20). 13C-NMR (500 MHz, CDCl3): δ (ppm): 14.22(C-1/C-21), 22.75(C-2/C-20), 31.89(C-3/C-19), 2938(C-4/C-18), 29.63(C-5-C-17).
Result and Discussion
Purification and Structural Elucidation of Secondary Metabolites
Purification of Compounds 1 and 2 from Dichloromethane Crude Stem-bark Extract of Barringtonia asiatica.
| Solvent | Volume to volume ratio (v/v) | ||||
|---|---|---|---|---|---|
| Hexane | 1 | ||||
| Hexane: DCM | 1:1 | ||||
| Hexane: DCM | 1:2 | ||||
| DCM | 1 | ||||
| DCM: CHCl 3 | 1:1 | ||||
| DCM: CHCl 3 | 1:2 | ||||
| CHCl 3 | 1 | ||||
| CHCl EA 3: | 1:1 | ||||
| CHCl EA 3: | 1:2 | ||||
| EA | 1 | ||||
| EA: MeOH | 1:1 | ||||
| EA: MeOH | 5:1 | ||||
| MeOH | 1 |
Table 3: Solvent systems used as eluting solvents for column chromatography (300 mL each solvent). DCM: dichloromethane, CHCl3: c
| Code of Fraction | Weight of Fraction (mg) | Colour of Fraction | ||||||
|---|---|---|---|---|---|---|---|---|
| BASB1 | 6.18 | Colourless | ||||||
| BASB2 | 12.39 | Colourless | ||||||
| BASB3 | 34.7 | Light yellow | ||||||
| BASB4 | 189.4 | Light yellow | ||||||
| BASB5 | 118.2 | Brown | ||||||
| BASB6 | 245.8 | Brown | ||||||
| BASB7 | 182.9 | Dark brown | ||||||
| BASB8 | 344.3 | Dark brown | ||||||
| BASB9 | 325.9 | Dark brown | ||||||
| BASB10 | 289.7 | Dark brown |
Table 4: Fractions collected from dichloromethane stem-bark extract of Barringtonia asiatica.
Purification and Structural Elucidation of Compound 1 Purification: Compound 1 was isolated from combined fraction BASB9 of 325.9 mg Dark brown color. The TLC analysis of the combined fraction BASB9 was carried out in different solvent system. It was observed under UV light and recorded as shown in Table 2.
| Solvent system (v/v) | Number of spot | s | R values f | |||
|---|---|---|---|---|---|---|
| Hexane: DCM (6:4) | 2 | 0.32 0.11 | ||||
| Hexane: CHCl (8:2) 3 | 2 | 0.42 0.51 | ||||
| Hexane: EA (5:1) | 2 | 0.50 0.28 |
Table 5: Rf values of combined fraction BASB9 in different solvent system under UV light.
The TLC subjected to UV a light yellow coloured spot with the same Rf value was observed and collected and combined from fraction BASB9-1 to BASB9-9. The combined fraction was labeled BASB9-D and subjected to a smaller column and combined fraction of BASB9-D2 was obtained. The TLC of BASB9-D2 was performed in the solvent system hexane: chloroform 8:2 which gave a good separation from the other spots present.
| Solvent system (v/v) | Number of spots | R values f | ||||
|---|---|---|---|---|---|---|
| Hexane: CHCl (8:2) 3 | 2 | 0.62 0.44 | ||||
| Hexane: EA (8:2) | 2 | 0.63 0.39 |
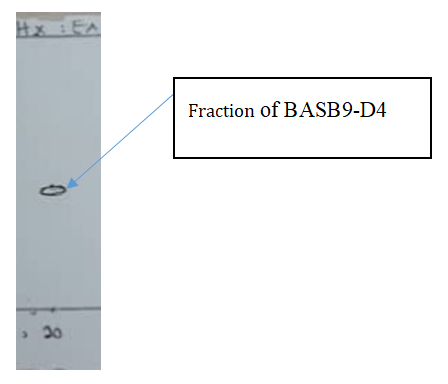
- The targeted spot combined and labeled as BASB9-D3 was again re-columned in smaller column using solvent system of Hexane: ethyl acetate (9:1) the TLC of BASB9-
- D3 observed single spot and renamed BASB9-D4.
- Solvent system (v/v) Number of spots
- Rf values
- Hexane: CHCl3 (9:1)
- 1
- 0.49
Table 6: Rf values of combined fraction BASB9-D4 in
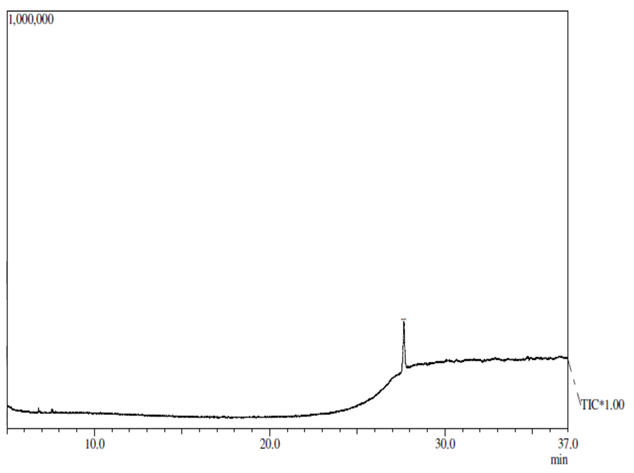
The Gas Chromatography (GC) analysis of the combined fraction BASB9-D4 was then carried out, and the result from the gas chromatogram Figure 2 showed a single peak at a retention time of 15.722 min. This confirmed that BASB9-D4 is a pure compound and it was renamed as Compound 1
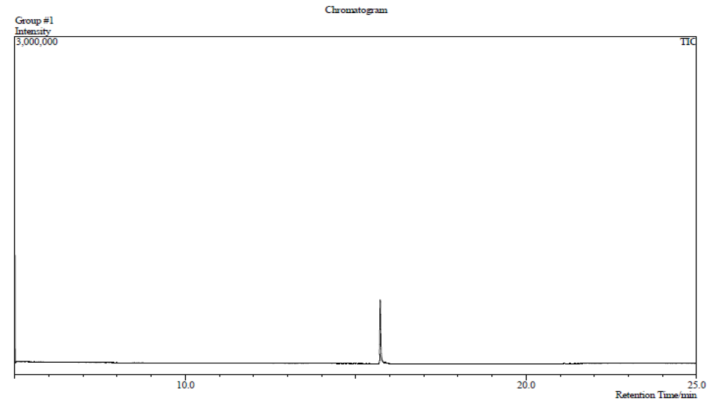
Figure 3: Gas chromatogram of Compound 1. Structural Elucidation: Compound 1 was isolated from the DCM stem-bark extract of Barringtonia asiatica, with its physical appearance as a white crystal and a melting point at 20-21oC. The mass spectrum of Compound 1 in Figure 4 shows a similarity index of 99.9% with the mass spectrum of the suggested structure of Compound 1 by the NIST library in Figure 4. On the mass spectrum of Compound 1 one of its molecular ion peaks was observed at m/z 222 which was found to correspond to the shows base peak for Compound 1 at m/z 69 which was observed in the mass spectrum of the suggested structure for Compound 1.
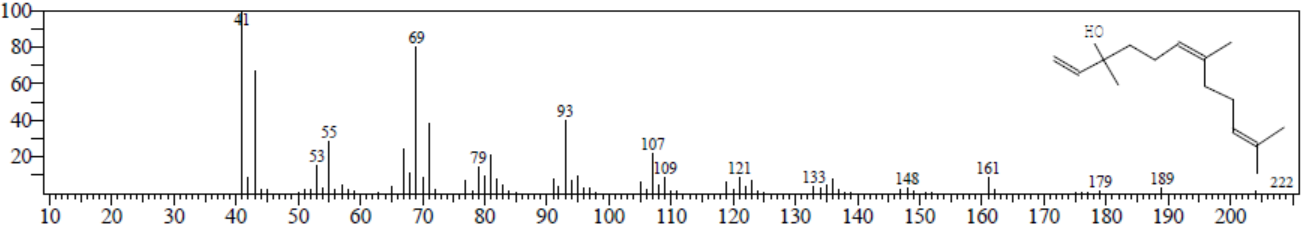
in the structure. A Single Bond C-H stretching was observed at 1383 cm-1, and single bond of =C-H stretching at 879 cm-1 were observed in the IR spectrum of Compound 1, Figure 5. IR spectrum of Compound 1 also showed similarity to IR of the same proposed compound reported by Ferreira Farias, et al. [20].
NMR analysis was further performed for the elucidation of the chemical structure of Compound 1, and the results are shown in Table 6 (1H-NMR) and Table 7 (13C-NMR). Based on the table of 1H-NMR characteristics absorption and 1H-NMR peaks splitting pattern as reported in Organic Chemistry by Janice [13], the proton signals were all integrated and were assigned to every proton NMR of Compound 1 as the proposed chemical structure.
The result showed that 1H-NMR spectrum of Compound 1 exhibited 12 proton resonates. The proton signals were observed at δ 5.13, δ 5.17 and δ 5.89 indicating the presence of ethylene proton in the structure, therefore assigned to H-1 and H-2 respectively, also observed are proton at δ 5.28 and δ 5.29 a trans methylene assigned to H-6 and H-10. Hydroxyl signal proton was observed at δ 4.76 which represent the alcohol group in the structure. Four methyl proton signal was observed at (δ 1.38, δ 1.63), δ 1.89 and δ 1.61 and assigned to H-4, H-8 and H-14. Another proton signal was observed at δ1.53, δ2.00, δ1.54 and δ 2.23 can be seen to indicate the existence of methylene group and were assigned to H-12, H-5, H-13 and H-9 respectively.
Table 7 shows the result of the 13C-NMR result of Compound 1. From the result every carbon was assigned to the proposed chemical structure of Compound 1 which is based on the table of 13C-NMR characteristics absorption report in organic chemistry by Janice [13].
Fifteen carbon resonances were observed in the spectrum. The down field region showed five signals at δ 112.25, δ134.33, δ124.10, δ133.79, δ 124.12 and δ 130.69 which were identified as ethylene carbons and were assigned to C-1, C-2, C-6, C-7, C-10 and C-11 respectively. Another signal observed at δ 70.48 was assigned to C-3 Proton assigned to Proton chemical shift (ppm) of Compound 1 compound 1 which was identified as OH group. Seven signals appeared at the up field region, two signals at δ 41.53, δ21.89, δ38.66, δ26.41, δ 24.97, δ17.26, δ 15.73 and δ 28.05 which indicated the presence of aliphatic carbons and were assigned to C-4, C-5, C-8, C-9, C-12, C-13, C-14 and C- 15, respectively.
The chemical shift of every proton and carbon NMR for Compound 1 is as shown in Table 6 and Table 7 and comparison with NMR data of similar compound reported by Ferreira Farias et al., (2019). Thus, from the data obtained, the GCMS analysis of Compound 1 gave similarity index of 99.9% with the mass spectrum of the proposed compound by the NIST library which matched the characteristic of Nerodiol (1), with chemical formula C15H26O. The melting point of Compound 1 is 20-21oc. Also, mass spectrum of Compound 1 is similar to the mass spectrum of the suggested structure by NIST library and is most probably identified as Nerodiol (1), IR data reported by Ferreira Farias, et al., [20] could be seen to match the IR data of Compound 1 which was reported as Nerodiol (1).
Based on mass spectrum, IR, 1H-NMR and 13C-NMR data and comparison with published literature [20], Compound 1 was therefore identified as Nerodiol (1).
Nerolidiol (1)
Proton assigned to
Proton chemical shift (ppm) of Nerolidol [20] H-1 5.13; 5.17 H-1 5.086; 5.017 H-2 5.89 H-2 5.86 H-3 - H-3 - H-4 1.38; 1.63 H-4 1.382; 1.623 H-5 2 H-5 2.034 H-6 5.26 H-6 5.277 H-7 - H-7 - H-8 1.89 H-8 1.894 H-9 2.23 H-9 2.229 H-10 5.27 H-10 5.287 H-11 - H-11 - H-12 1,53 H-12 1,530 Nerolidol [20]
| H-13 | 1.54 | H-13 | 1.53 |
|---|---|---|---|
| H-14 | 1.61 | H-14 | 1.604 |
| H-15 | 1.38 | H-15 | 1.382 |
Table 8: Carbon NMR signals of compound 1 and that reported by Nerolidol.
- Carbon assigned to
- Carbon chemical shift (ppm) of
- Carbon assigned to Nerolidol by
- Carbon chemical shift
- (ppm) of Nerolidol [20]
- C-1
- 112.25
- C-1
- 11.54
- C-2
- 139.33
- C-2
- 144.86
- C-3
- 70.48
- C-3
- 73.01
- C-4
- 41.53
- C-4
- 41.91
- C-5
- 21.89
- C-5
- 22.61
- C-6
- 124.1
- C-6
- 124.09
- C-7
- 133.79
- C-7
- 134.63
- C-8
- 38.66
- C-8
- 39.46
- C-9
- 26.41
- C-9
- 26.41
- C-10
- 124.12
- C-10
- 124.13
- C-11
- 130.69
- C-11
- 130.79
- C-12
- 24.97
- C-12
- 25.55
- C-13
- 17.26
- C-13
- 17.33
- C-14
- 15.73
- C-14
- 15.66
- C-15
- 28.05
- C-15
- 27.31
- Compound 1 compound 1
- Ferreira Farias, et al. [20].
Table 9: Carbon NMR signals of compound 1 and that reported by Nerolidol.
- Solvent system (v/v) Number of spots
- Rf values
- Hexane: CHCl3 (6:4)
- 3
- 0.59
- 0.56
- Hexane: EA (8:2)
- 3
- 0.61
- 0.64
Table 11: Rf values of combined fraction BASB7in different
The fractions containing a light yellowish spot were targeted and combined; it was labelled as BASB7-B.
- Solvent system (v/v)
- Number of spots Rf values
- Hexane: EA (8:2)
- 2
- 0.60
- 0.62
- DCM: EA (7:3)
- 2
- 0.57
- 0.69
Table 10: Rf values of combined fraction BASB7-B3 in
Combined fraction BASB7-B3 was further purified using small column and fractions containing the targeted spots from BASB7-B3 were then combined and labelled as BASB7-B3a. Combined fraction BASB7-B3a was further purified using the solvent system DCM: EA (7:3), which gives a better separation. TLC of the fractions collected was performed and examined under UV light. Fractions containing the target spots were combined and labelled as BASB7-B3a1. TLC of the combined fraction BASB7-
B3a1was performed in different solvent system and the result was again examined under UV light and vanillin staining. It showed a single sport as shown in Table 11.
| Combined | Solvent system | Numbe | r | ||||||||
|---|---|---|---|---|---|---|---|---|---|---|---|
| R value f | s | ||||||||||
| fraction | (v/v) | of spots | |||||||||
| BASB7-B3a1 | Hexane: EA (7:3) | 1 | 0.63 |
Table 12: Rf values of combined fraction BASB7-B3a1 in different solvent system under UV light.
Figure 5 shows the TLC profile for the combined fraction BASB7-B3a1 in DCM: EA (7:3) as a single spot which suggest that it is a pure compound.
The combined fraction BASB7-B3a1 as shown in Figure 5 is considered a pure compound. Gas chromatography (GC) analysis of the fraction BASB7-B3a1 was then carried out, and the result showed a single peak at a retention time of 27.657 min. This confirmed that BASB7-B3a1 is a pure compound and it was renamed as Compound 2. It is a light yellowish compound and 18 mg was obtained.
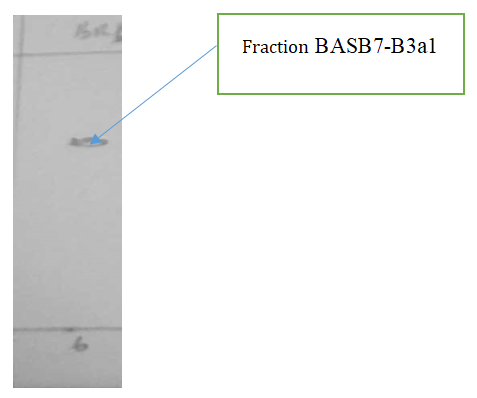
Figure 8: Gas chromatogram of Compound 2. Structural Elucidation: The isolated Compound physical appearance as a light yellow compound with a melting point 40-41 oc was observed. The mass spectrum of Compound 2 as shown in Figure 7 indicated a similarity index of 99.9 % with the mass spectrum of the compound suggested by the NIST library in Figure 8. The mass spectrum of Compound 2 showed an ion base peak which was observed at m/z 57 and a molecular ion peak of m/z 57 was also observed in the mass spectrum of the suggested structure of Compound 2. The mass spectrum of Compound 2 has one of its molecular ion peaks observed at m/z 296, this corresponded to the same molecular ion peak and molecular ion weight of the suggested structure of Compound 2 by NIST library with a chemical formula of C21H44.
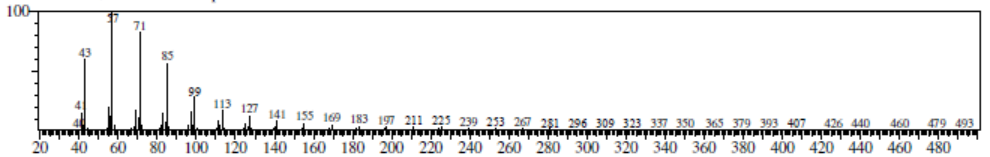
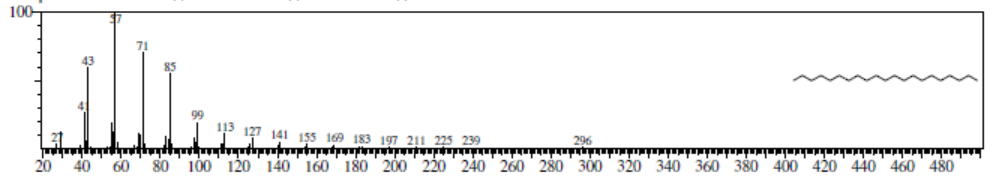
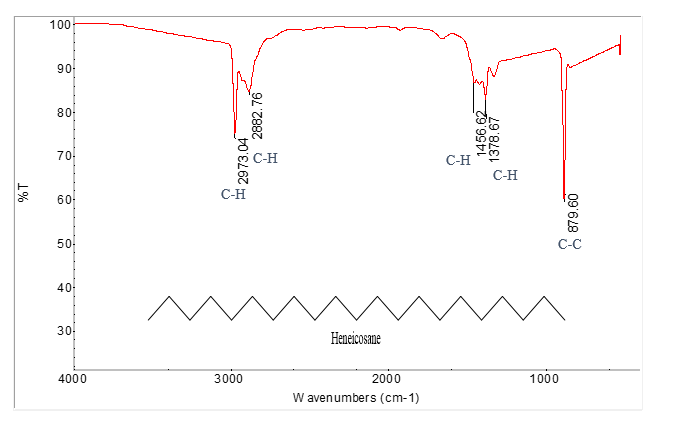
structure. Single bond C-C stretching was observed at 879 cm-1 in the IR spectrum of compound 2. The spectrum is transparent in the 1480 cm-1-1850 cm-1, and 4000-3000 cm-1 region indicating the absence of C=C. the compound suggested therefore indicated to be an alkane type [22].
NMR analysis was further performed for the elucidation of the chemical structure of Compound 2 and the results are shown in Table 11 (1H-NMR) and Table 12 (13C-NMR). Based on the table of 1H-NMR characteristics absorption and 1H-NMR peaks splitting pattern as reported in Organic Chemistry by Janice [13], the proton signals were all integrated and were assigned to every proton NMR of Compound 2 as the proposed chemical structure.
The 1H-NMR spectrum of Compound 2 exhibited 2 proton resonates. A singlet proton signal was observed at δ 1.26 (37H, s) indicating the presence of methylene broad signal centered at δ 1.26. Of the structure and was assigned to H-2-H-20. A singlet proton signal was observed at δ 0.89 (7H, m) indicating the presence of a methyl group and was assigned to H-1/H-21. A singlet proton signals observed corresponds with a methyl group of the suggested structure.
- The 13C-NMR spectrum of Compound 2 exhibited 21 carbon resonates, at the up field region, signals were observed at δ 22.75, δ 31.89, δ 29.38 and δ 29.63 are aliphatic carbon which indicated the presence of methine were assigned to C-1/21, C-2/20, C-3/19, C-4/18 and C-5-
- Proton assigned to
- Proton chemical shift
- (ppm) of compound 1
- Proton assigned to Heneicosane by
- Compound 1
- Suparna, et al. [22] of Heneicosane [22]
- H-1/H-21
- 0.89 (7H, m)
- H-1/H-21
- 0.88 (3H, m)
- H-2-20
- 1.26 (37H, s)
- H-2-20
- 1.26 (s)
Table 13: Proton NMR signals of compound 1 and that reported by Suparna, et al. [22].
- Carbon assigned to
- Carbon chemical shift
- (ppm) of compound 2
- Carbon assigned to Heneicosane by
- Compound 2
- Suparna, et al. [22] of Heneicosane [22]
- C-1/21
- 14.22
- C-1
- 14.12
- C-2/20
- 22.75
- C-2
- 22.71
- C-3/19
- 31.89
- C-3
- 31.96
- C-4/18
- 29.38
- C-4
- 29.39
- C-5-17
- 29.63
- C-5
- 29.73
Table 14: Carbon NMR signals of compound 1 and that reported by Suparna, et al. [22].
Based on mass spectrum, IR, 1H-NMR and 13C-NMR data and comparison with published literature [22] Compound 2 was identified as Heneicosane (2).
Heneicosane (2) Heneicosane (2) is a compound that found active against some resistance pathogens, it inhibited by all concentrations of heneicosane. The effect is much pronounced in Pseudomonas aeruginosa and Sarcina lutea, as well as Staphylococcus aureus, Pseudomonas aeruginosa, and Sarcina lutea [22]. Biological activity of Norolidol (1) and Heneicosane (2) The biological activity of the new compound from Barringtonia asiatica stem-back extract Norolidol (1) and Heneicosane (2) is as shown in Table 14 and Figure 10. The activity of Nerolidol and Heneicosane against this selected bacterial was significant when compared to the test control at all the concentration tested. Higher growth inhibition rate was observed at 100 ppm though significant inhibition was observed in all the test bacteria as shown in figure 10. The maximum inhibition of Nerolidol (1) on Escherichia coli, Klebsiella pneumonia, were found at 50 ppm of 5.15±0.08 mm, and 10.67±0.06 mm, while Salmonella typhi at 100 ppm of 11.04±0.06 mm. weaker inhibition was observed at 25 ppm of 3.89±0.14 mm, 2.87±0.12 mm and 8.00±0.07 mm when compared to the test control.
Heneicosane (2) activity was found to be more active on the bacterial when compared to Nerolidol with the highest rate of inhibition observed at 50 ppm and 100 ppm of 10.54±0.03 mm, 9.97±0.04 mm, 11.76±0.02 mm and 11.98±0.07 mm, 11.87±0.03 mm, 12.17±0.03 mm, respectively as shown in Table 13. Generally, the entire isolated pure compound showed a significant rate of inhibition growth on all the selected pathogen. Thus, these agents could be used as a remedy against resistance pathogens.
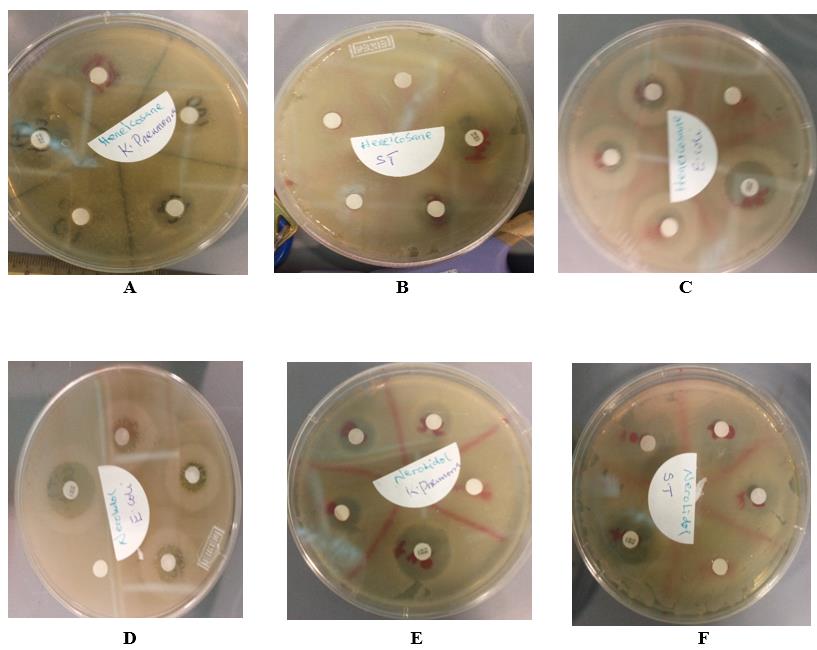
| Concentration (ppm) | |||||||
|---|---|---|---|---|---|---|---|
| Isolated Compound | Organism | Control (Tetracycline) | 25 ppm | 50 ppm | 100 ppm | ||
| (mm) | (mm) | (mm) | (mm) | ||||
| Nerolidiol (1) | Escherichia coli | 13.25±0.41 | 3.89±0.14 | 5.15±0.08 | 4.50±0.11 | ||
| Klebsiella pneumonia | 12.90±0.13 | 2.87±0.12 | 10.67±0.06 | 7.96±0.12 | |||
| Salmonella typhi | 13.20±0.05 | 8.00±0.07 | 9.89±0.05 | 11.04±0.06 | |||
| Heneicosane (2) | Escherichia coli | 13.08±0.06 | 10.09±0.03 | 10.54±0.03 | 9.97±0.04 | ||
| Klebsiella pneumonia | 12.89±0.17 | 6.85±0.04 | 11.76±0.02 | 11.98±0.07 | |||
| Salmonella typhi | 13.25±0.16 | 9.36±0.06 | 11.87±0.03 | 12.17±0.03 |
Table 15: The biological activity of the new compound from _Barringtonia asiatica_ stem-back extract Norolidol (1) and Heneicosane
Conclusion
In the following study, we obtained the following results, the chemical constituent from Stem-bark extract of Barringtonia asiatica isolate on the bases of spectral analysis it was confirmed that compound 1 and 2 are Nerolidol (1) and Heneicosne (2). The biological activity of these compounds was observed to possess interesting biological activity. They were found to be active against the bacterial tested and may have potential to be developed as antibacterial agents. However, these compounds were isolated for the first time of Stem-bark extract of Barringtonia asiatica.
Acknowledgement
The authors wish to acknowledge the research grant 07(ZRC05/1238/2015(2) provided by Universiti Malaysia Sarawak which has resulted to this article.
Conflict of Interest
The authors declare no competing of interest.
Funding
This work was supported by the Universiti Malaysia Sarawak (research grant; 07(ZRC05/1238/2015(2).
References
-
Wakawa H, Hauwa M (2013) Protective effect of Erythrina senegalensis (DC) leaf extract on carbon tetrachloride-induced liver injury in rats. Asian Journal of Biological Sciences 6(4): 234-238.
-
Rosenthal GA, Janzen DD (1979) Herbivores; their interaction with plant secondary metabolites. Academic Press, New York.
-
Soepadmo E (1999) Botanical study of Malaysian medicinal plants. In: Manaf FA, (Ed.), An appraisal: phytochemicals and biopharmaceutins from Malaysian rain forest, FRIM, Kuala Lumpur, pp: 1-14.
-
Khairana H, Nozaima MK, Jamia Azdini J, Juriyati J, Ibrahim J (2006) Ethnobotanical Survey on Malaysian Medicinal Plants used as Anticancer Agents. In: Fasihhudin BA, Zaini A, Laily B Din, Ikram MS, (Eds.), Malaysian medicinal plants. Chemistry and biological activity. Universiti Malaysia Sarawak, Lee Meng Press, Kuching, pp: 63-75.
-
Raphael EC (2011) Traditional medicine in Nigeria: current status and the future. Research Journal of Pharmacology 5(6): 90-94.
-
Ntie Kang F, Mbah JA, Mbaze LM, Lifongo LL, Scharfe M, et al. (2013) Cam Med NP: Building the Cameroonian 3D structural natural products database for virtual screening. BMC Complementary Alternative Medicine 13: 88-96.
-
Fasihuddin BA, Sallehuddin Nur Khairun NM, Assim Z (2010) Chemical constituents and antiviral study of Goniothalamus velutinus. Malaysian Journal of Fundamental and Applied Sciences 6(1): 73-76.
-
Isaac John Umaru, Fasihuddin A Badruddin, Hauwa A Umaru (2018) Antioxidant Properties and Antibacterial Activities of Leptadenia Hastata Leaves Extracts on Staphylococcus Aureus. Drug Designing & Intellectual Properties International Journal 1(5): 131-135.
-
Firdous AM, Fayaz AL, Mushtaq AS (2013) Isolation of active components derived from rhizome of Euphorbia wallichii Hook. International Journal of Ayurvedic and Herbal Medicine 3(3): 1173-1183.
-
Patra JK, Gouda S, Sahoo SK, Thatoi HN (2012) Chromatography separation, 1H NMR
-
Isaac John Umaru, Fasihuddin Badruddin Ahmad, Hauwa A Umaru (2019) Extraction, Elucidation, Characterization and Evaluation of Antibacterial Activity of Four Pure Compound from Barringtonia racemosa Leaf Extract. World Journal of Pharmacy and Pharmaceutical Sciences 8(8): 184-223
-
Shalini S, Sampathkumar P (2012) Phytochemical screening and antimicrobial activity of plant extracts for disease management. International Journal of Current Science 1(1): 209-218.
-
Janice GS (2008) Key concepts-Mass spectrometry, infrared spectroscopy and nuclear magnetic resonance spectroscopy. Organic Chemistry, McGraw- Hill, New York, pp: 485-525.
-
Efdi M, Fujita S, Inuzuka T, Koketsu M (2010) Chemical studies on Goniothalamus tapis Miq. Natural Product Research 24(7): 657-662.
-
McLaughlin JL, Rogers LL, Anderson JE (1998) The use of biological assays to evaluate botanicals. Drug Information Journal 32(2): 513-524.
-
Isaac John Umaru, Fasihuddin A Badruddin, Zaini B Assim, Hauwa A Umaru (2018) Cytotoxicity (Brine shrimp Lethality Bioassay) of Barringtonia racemosa Leaves, Stem-Bark and Root Extract. Journal of Biotechnology and Bioengineering 2(2): 1-6.
-
Wang HX, Liu CM, Liu Q, Gao K (2008) Three types of sesquiterpenes from rhizomes of Atractylodes lancea. Phytochemistry 69(10): 2088-2094.
-
Tailor CS, Goyal A (2014) Antioxidant activity by DPPH radical scavenging method of Ageratum conyzoides Linn. Leaves. American Journal of Ethno medicine 1(4): 244-249.
-
Prashanth VK, Chauhan NS, Padh H, Rajani M (2006) Search for antibacterial and antifungal agents from selected Indian medicinal plants. Journal of Ethno pharmacology 107(2): 182-188.
-
Ferreira Farias AL, Lobato Rodrigues AB, Lopes Martins R, de Menezes Rabelo É, Ferreira Farias CW, et al. (2019) Chemical Characterization, Antioxidant, Cytotoxic and Microbiological Activities of the Essential Oil of Leaf of Tithonia Diversifolia (Hemsl) A. Gray (Asteraceae). Pharmaceuticals 12(1): 34.
-
Chan WK, Tan L, Chan KG, Lee LH, Goh BH (2016) Nerolidol: a sesquiterpene alcohol with multi-faceted pharmacological and biological activities. Molecules 21(5): 529.
-
Suparna MB, Nabanita C, Prasanta CB (2017) Cutcular wax of Tectona grandis L. Leaves-AR Against plant pathogens. Biochemistry and Analytical Biochemistry 6(3): 1-6.
-
Siddiqui BS, Rasheed M, Ilyas F, Gulzar T, Tariq RM, et al. (2004) nalysis of insecticidal Azadirachta indica A. Juss. fractions. Zeitschrift für Naturforschung C 59(1- 2): 104-112.
- Origin, Evolution, and Functional Impact of Short Insertion- Deletion Variants in Human Genomes: A Review
- Harnessing Molecular Glues for Next-Generation Vaccine, Cancer and Cardiovascular Disease Drug Development: A Comprehensive Review
- Lateral Cervical Epidermal Inclusion Cyst in a Paediatric Patient: A Rare Case Report
- Malarial Plasmodium Falciparum with Hepatitis B and C Virus Infections among Blood Donors in Ife Central Local Government Area, Ile Ife, Osun State, Nigeria
- Withanolides and Withaferin A- What’s next in Ashwagandha Research
- Designing of Dual Pulse Photoacoustic Tomography for Imaging of Drug-Response and Tumor Growth