ELF1-Like Protein of Physarum Polycephalum ELF1 (PELF1) Act as a DNA Binding Protein, P14-3-3 Interacted Protein and Regulates DNA Structure
The function of transcription extension factor 1 (elf1) protein was mainly studied by Saccharomyces cerevisiae, but it was rarely reported in low eukaryotes. In addition, the role of Physarum ELF1 (PELF1) and PELF1/Physarum 14-3-3 (P14-3-3) protein interaction is poorly understood. Q-PCR analysis of the PELF1 mRNA levels indicates that it involved DNA structure formation. Further, confirmed that the DNA binding site of PELF1 is located within 1 to 22 amino acids from the N-terminus. The site of the interaction between PELF1 and P14-3-3 is located on the 40-RDAGI-44 aa peptide at the corner of the βA→βB of the C4 zinc finger domain. Key peptides and amino acids affecting PELF1 binds to DNA. Electrophoretic mobility shift analysis (EMSA) results showed that PELF is faster than P14-3-3/PELF1 complex when they binding to PardC. Atomic force microscopy (AFM) showed that both PELF1/DNA complex and P14-3-3/PELF1/DNA complex aggregated, but P14-3-3/PELF1/DNA complex aggregated most. ITC (Isothermal Titration Calorimetry) showed that P14-3-3/PELF1 complex binds PardC DNA 10 times higher than PELF1 binds to PardC DNA. Finally, our data not only represent the first report of PELF1 regulation of DNA structure formation, but also enhance our understanding of PELF1 as a DNA binding protein and PELF1/P14-3-3 interaction.
Introduction
Transcription elongation factors Spt4/Spt5 (DSIF),
Spt6, FACT, and the elongator regulates the transcriptional elongation of RNA polymerase II (P II) by modifying the chromatin and the nucleosome. Transcription elongation factor 1 (ELF1) has been reported to be involved in the protein complexes TFIIS, Spt4, Spt5, Spt6, Spt16 and Paf1. The main function of ELF1 may be to maintain the conformation of the transcribed DNA to ensure the right direction of the transcription complex [1]. The evolutionarily conserved, structurally similar ELF1 protein belongs to a family of transcriptional elongation factors and is a class of zinc finger proteins in eukaryotes [1].
The transcription elongation factors TFIIS, Spt4 and TTEFs Rpb9 (RNA polymerase II subunit B9) are similar to members of the ELF1 family and also contain a C4 zinc finger structure which contain four conserved cysteines [2]. ELF1 is a protein involved in the transcriptional elongation of genes. It was discovered when studying the function of the unknown gene YKL160W in S. cerevisiae and found that its encoded protein is related to the transcriptional extension of the gene, so it was named ELF1 [1]. A total of 46 ELF1 genes were found, 15 of which are located in archaea and 25 in eukaryotic cells. Most species have only one ELF1 gene, however, some eukaryotes such as human (Homo sapiens) and fruit flies (Drosophila Melanogaster) have two copies of ELF1. Three copies of the ELF1 were found in Phaeodactylum tricornutum [3]. Most eukaryotic ELF1 family consists of approximately 100 amino acids.
Nonetheless, the yeast ELF1 (yELF1) protein consists of 145 amino acids and contains four conserved sequences, four conserved cysteines and a highly conserved C4 zinc finger structure [4]. Members of the ELF1 family are not only conservative in composition but also structurally conservative. Since the function of the C4 zinc finger structure is unclear, it was named DUF701 (unknown functional domain 701) [2, 5]. Daniels, et al. [3] analyzed the function of Crenarchaeota ELF1 similar to the function of yELF1 through in Profile-Hidden Markov Model software_. So, the ELF1 protein is mainly concentrated on _S. cerevisiae, but is rarely reported in lower eukaryotes. Hence, the present study we used Physarum polycephalum as a model organism to study the PELF1 and PELF1/P14-3-3 protein interaction. P. polycephalum a single-cell eukaryotic organism which belongs to the Physaraceae family of Mycomycetes. This species exhibits both fungi and protozoa characteristics. Since it is easy to culture and maintain, P. polycephalum can be considered as a good model organism. Previously Liu, et al. [6] isolated a 565 bp ELF1 by truncated 14-3-3 protein of P. polycephalum (P14-3-3) using yeast two-hybrid. ELF codes a100 amino acids protein and named Physarum ELF1. It consists of with a theoretical molecular weight of 11 kDa and an isoelectric point of 5.16. Blast results show that PELF1 is associated with S.cerevisiae ELF1 (NCBI accession number EDN60012), Homo sapiens ELF1 (NCBI accession number NP_115753) and Dictyostelium discoideum ELF1 (NCBI accession no. XP_637365). The homologous sequences of S. cerevisiae, Homo sapiens and Dictyostelium discoideum were 48%, 55% and 64%, respectively (Appendix Figure A1). In this study show that PELF1 has similar tertiary structure as Homo sapiens ELF1, with a coil structure at both ends, α helix located in the 67-78 peptide, and three β tablets. The homologous sequences of PELF1 and other species ELF1 are mainly concentrated in the 1-14, 23-34, 45-53 and 58- 80 peptides. Similar to other species ELF1, PELF1 also contains a C4 zinc finger structure and four highly conserved cysteines Cys25, Cys28, Cys49 and Cys52. The 14-3-3 protein is a brain tissue protein discovered by Moore, et al. [7]. The 14-3-3 protein belongs to a highly conserved family of acidic proteins that are ubiquitous in eukaryotic cells. 14-3- 3 protein family members are widely involved in important life activities (e.g. cell cycle control, transcriptional control of gene expression and control of apoptosis, cellular and physiological processes) [8, 9, 10, 11]. The functional region is mainly located on the N-terminal and C-terminal structures [12, 13, 14] and also participates in the transcriptional regulation of genes through other transcription factors [15, 16, 17, 18]. The 14- 3-3 protein regulates transcriptional functions of various transcription factors, including Gal4, Gat1, Gcr2, Gln3, Gts1, Hot1, Mig1, Msn2, Msn4, Sfl1, Ume6 and Xbp1 [19] and plays a role in regulating the transcription and translation of some genes in S. cerevisiae [17, 20]. Previously, our lab isolated a 14-3-3 protein from P. polycephalum, named P14-3-3 (Physarum 14-3-3). P14-3-3 contains 261 amino acids and has a molecular weight of 30 kDa and can be found in the GenBank under the accession number EF140724. Spt4, Spt5, Spt6 and Spt16 regulate transcriptional elongation of genes, and Spt6 is not only involved in transcriptional elongation but also in the regulation of chromosome structure [21, 22, 23, 24]. This indicating that the function of ELF1 is not only involved in the transcriptional elongation of genes but also may be related to changes in chromosome structure. Daniels, et al. [3] speculated that the function of ELF1 is to maintain chromosome unfolding to promote transcriptional continuation. At present, there are few reports on ELF1, especially regarding the fungus (P. polycephalum) ELF1, and there have been no studies on the relationship between ELF1 and 14-3-3 proteins. Thus, the present study aimed to identify PELF1 as a DNA binding protein and the interaction between PELF1 and P14-3-3. At the same time, P14-3-3 interacted with PELF1 to facilitate the binding of PELF1 to DNA and regulate the folding of DNA structure. In order to understand the interaction between PELF1 and different types of DNA, the PELF1 genomic DNA and its upstream regulatory sequence were cloned using PCR and TAIL-PCR. The binding of PELF1 to DNA, as well as the key peptide segments and amino acids of PELF1 binding to DNA, were determined by EMSA. The key amino acids that PELF1 binds to DNA are measured using the yeast two-hybrid. The interaction between PELF1 and P14-3-3 was investigated by detecting the coexpression of PELF1 and P14-3-3 to activate the expression of the Gal4 protein regulatory gene LacZ in auxotrophic yeast Y187. AFM observed the effects of PELF1 binding with DNA and P14-3-3 on PELF1 binding to DNA. The thermodynamic reaction process of PELF1 titration DNA and P14-3-3/PELF1 complex titration DNA was detected by ITC.
Results
Physarum ELF1
The tertiary structures were analysed by the SWISS- MODEL. The result shows that the protein of PELF1 has similar tertiary structure as Homo sapiens ELF1 protein. Both the N-terminus and the C-terminus are Coil structures, all of which are composed of one α-Helix (located in the 67-78 peptide) and three β-Sheets (distributed in the 33- 60 peptide). Its α-Helix is located in the conserved 58-80 peptide segment, and the two β-Sheets are located in the 45- 53 aa and 58-80 aa conserved peptides, respectively. Further analysis revealed that the P. polycephalum ELF1 protein has at least two potential phosphorylation sites, 7SerSer8 and Thr82 (Appendix Figure A2).
Isolation and Identification of Genomic DNA of PELF1
The genomic DNA of PELF1 was isolated from P. polycephalum. Then, the isolated DNA sample was amplified by PCR. The amplified PELF1 genomic DNA band was shown in Figure 1a. According to Li, et al. [25] procedures, the PELF1 genomic DNA sequence was obtained and used as a template for the genomic DNA of Physarum polycephalum. The PELF1 regulatory sequence DNA was amplified upstream by TAIL- PCR technique (Figure 1b), and a 530 bp regulatory sequence was obtained upstream of the PELF1encoded gene.
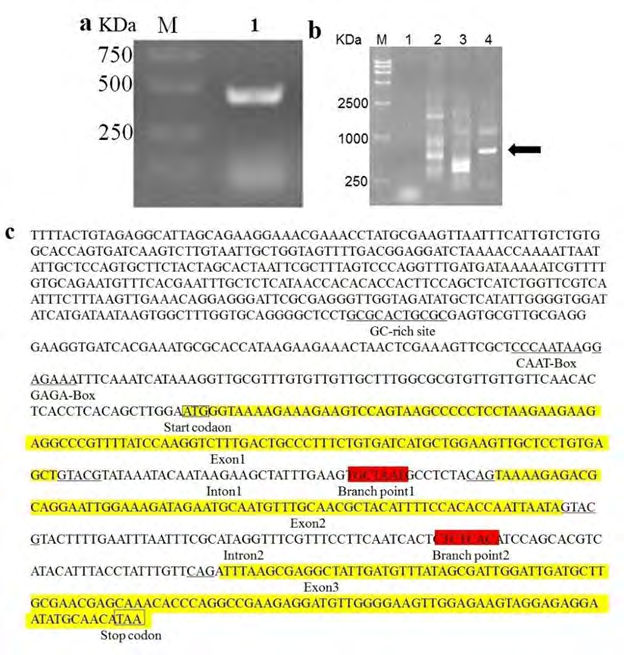
Figure 1: (a) PCR amplified PELF1 genomic DNA, M-Marker 2000, lane 1- PELF1 genomic DNA. (b): PELF1 genomic DNA of three rounds of TAIL-PCR. M – Marker, 1 –Physarum genus genomic DNA, 2_-1st PCR results, 3- 2nd PCR results, 4-_ 3rd PCR results. The arrow refers to the amplified sequence. (c): PELF1 DNA and it’s partial 5’ region sequence (GC rich site, CAAT-Box and GAGA-Box are marked by underline. Exons of the yellow colour highlighted the partial sequence of PELF1 in the graph, The background-free colour sequence between exons are intron, the start codon and stop codon are indicated by the box, the branch points are marked by red colour highlighted partial sequence, intron conserved sequences are marked by a single underscore).
The PELF1 DNA and its partial 5’ region sequence are showed in Figure 1c. We found that the partial 5’ region sequence of PELF1 DNA contains GC-rich site, CAAT-Box and branch points. PELF1 gene contains three exons and two introns with GTACG---CAG sequences conserved on either side of each intron. The branch-point sequence is usually upstream of intron 3’ by 8-40 bp. The YNCURAY sequence is conservative (Y: pyrimidine, R: purine, N: any base) characteristics judging [26], this study found 1 potential branch point sequence in each of the two intron sequences (red colour highlighted). The branch point sequence of intron 1 is TGCTAAT (10-17 nt upstream of the 3’end of intron 1) and the branch point sequence of intron 2 is CTCTCAC (34- 41 nt upstream of intron 2). There is a GAGA-Box structure in the first 40 nt of the starting codon, a CAAT-Box structure in the first 47 nt, and a GC enrichment region in the first 121 nt. There are 59 potential transcription factor binding sites in this sequence.
Changes of PELF1 Expression in Different Cell Cycles by Q-PCR
In order to understand the changes of PELF1 mRNA level with the cell cycle and sporulation of P. polycephalum. Taqman probe Q-PCR technique was used to detect the different phases of cell cycle for P. polycephalum. After synchronization, the total mRNA of P. polycephalum (S phase, G2 phase, M phase and spore phase) was isolated from the different stages. The expression level of PELF1 was detected by TaqMan probe Q-PCR.
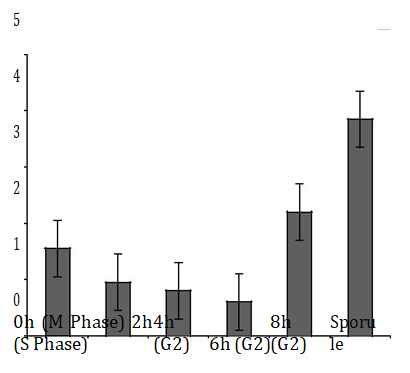
The results show that the mRNA level of PELF1 in the G2 phase was lower than that in the S phase after synchronization for 2~4 h (Figure 2). However, the mRNA level of PELF1 at the end of G2 was higher than that in the S phase (about 2 fold more than of S phase) at 8h. The mRNA level of PELF1 gene of P. polycephalum in M phase is slightly higher than that in S phase (about 1.7 fold), However, the mRNA level of PELF1 gene decreased slightly compared to the G2 phase (8 h after synchronized), suggesting that the expression of PELF1 might be closely related to the chromosomal status of the P. polycephalum. In addition, the mRNA level of PELF1 gene in the spore stage was 3.88 times higher than that in the S stage, suggesting that PELF1 played an important role in the spore stage. In the late stage of G2, P. polycephalum made final preparations for cell division, and the chromatin of M phase is converted into the chromosome. In the spore stage, the chromatin of the P.polycephalum is highly concentrated to form a chromosome. The PELF1 gene mRNA levels were elevated at these two stages, meaning that PELF1 was associated with chromosome folding.
Effect of Key Peptides and Key Amino Acids on the Binding of PELF1 to PardC
In order to understand the role of PELF1 and the gene promoter of P. polycephalum, we combined GST-tagged PELF1, ΔC1~4, ΔN4~6 (proteins had been pre-degested by DNase I and purified with Glutathione Sepharose 4B before mixed with PardC) with PardC and detected them using gel electrophoresis. The PardC, which was not mixed with PELF1 and its defective peptide, migrated significantly faster in the 8% polyacrylamide gel electrophoresis (lane 1 in Figure 3a). However, the migration rate of PardC mixed with GST- tagged PELF1 and ΔC1~4 for 1 hr was much slower (lane 2-6 in Figure 3a) and the migration rate of PardC mixed with GST-tagged ∆N4~6 for 1 hr was consistent (lane 7-9 in Figure 3a). This indicates that GST-tagged PELF and ∆C1~4 containing the N-terminal 1-30 peptide can bind to PardC in vitro, while the PELF1 residual peptide GST-tagged ∆N4~6 lacking the N-terminal 1-30 peptide could not bind to PardC. Thus, indicates that PELF1 and the DNA binding site are located within 1-22 peptide segment at the N-terminal. Figure 3b shows the patterns of purified GST fusion PELF1 and its truncated peptides bound with PardC DNA stained by Coomassie brilliant blue R-250. Further, we analysed the binding of GST-tagged ∆N1~3, and ∆M1 to PardC DNA by EMSA (Figure 3c & d). That the PardC DNA mixed with ∆N2 and ∆N3 was electrophoresed on PAGE gel. The migration rate of ∆N2 and ∆N3 are similar to the electrophoretic mobility of free PardC DNA (Figure 3c) indicating that ∆N2 and ∆N3 do not affect the electrophoretic mobility of PardC DNA, thus ∆N2 and ∆N3 do not bind to PardC DNA. On the other hand, the electrophoretic migration rate of PardC DNA mixed with ∆N1 and ∆M1 are less than the electrophoretic migration rate of free PardC DNA on PAGE gel. However, the electrophoretic migration rate of PardC DNA in the mixture of PELF1/PardC is larger, indicating that both ∆N1 and ∆M1 affect the electrophoretic migration rate of PardC DNA, but the degree of influence is not as large as PELF1. These results indicate that the N-terminal 6-KSSKPP-11 peptide is the key peptide that affects the binding of PELF1 to PardC DNA (Appendix Figure A3). The N-terminal 1-MGKRK-5 peptide and 12-PKKKRP-17 peptide have a minor effect on the binding of PELF1 to PardC DNA, while the 1-MGKRK-5 and 12-PKKKRP-17 peptides may play a complementary role in PELF1 binding DNA. The results of the Coomassie brilliant blue staining assay are shown in Figure 3d.
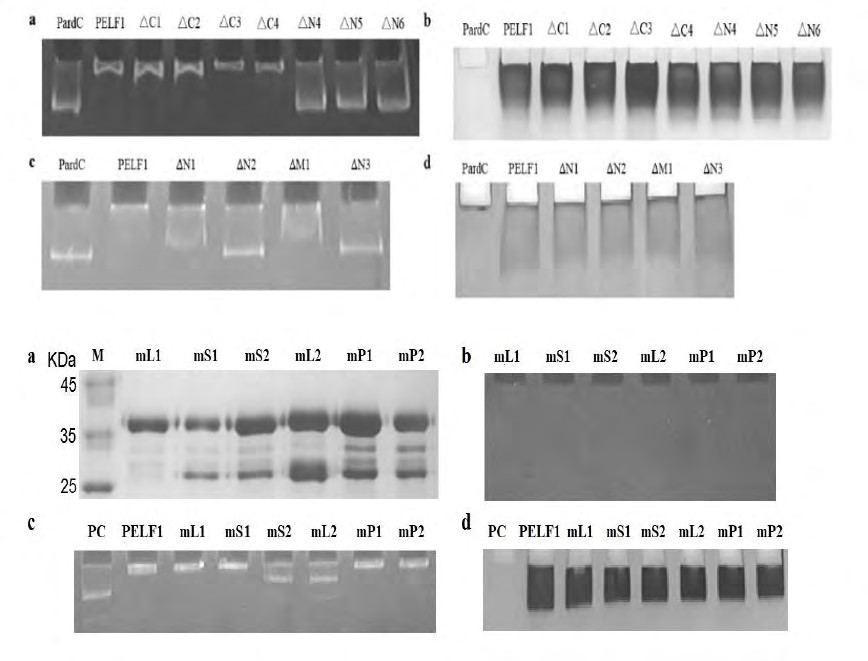
Figure 3: (a): PardC DNA binding with purified GST fusion PELF1 and its truncated peptides detected by EMSA. (b): The purified GST fusion PELF1 and its truncated peptides binding with PardC DNA stained by Coomassie brilliant blue. (c): Results of PELF1 deletion peptide binding to PardC by EMSA. (d): PELF1 residual, deletion and mutantpeptide stained by Coomassie brilliant blue R-250. Lanes: PardC - PardC DNA fragment (without protein), PELF1; ∆C1~4 - obtained by deletion of 20, 35, 46 and 67 residues at the C-terminus, respectively; ∆N1~6 - obtained by deletion of 5, 11, 17, 30, 39 and 49 residues at the N-terminus, respectively; ∆M1 - deletions of 12-17 peptides. The PELF1 mutant peptides mL1 (Lys6Thr), mS1 (Ser7Ala), mS2 (Ser8Ala), mL2 (Lys9Thr), mP1 (Pro10Ala) and mP2 (Pro11Ala) were designed and expressed by E. coli BL21 (DE3). GST- tagged mL1, mS1, mS2, mL2, mP1 and mP2 purified by GSTrap Fast Flow and desalted after digested by DNase I.
Figure 4(a): Coomassie brilliant blue R-250 stained GST fusion PELF1 residual, deletion and mutant peptide detected by SDS-PAGE. (b): Golden View stained GST fusion PELF1 residual, deletion and mutant peptide detected by PAGE. (c): Results of PESF1 mutant peptide binding to PardC by gel retardation assay/EMSA. (d): Shows the results of Coomassie Brilliant Blue R-250 staining of the same film. Lanes: M – Protein Marker; PC- PardC DNA fragment (without protein); PELF1; (mL1, mS1, mS2, mL2, mP1, mP2)-PELF1 with mutations at Lys6Thr, Ser7Ala, Ser8Ala, Lys9Thr, Pro10Ala, Pro11Ala, respectively.
The results of the Coomassie brilliant blue staining assay are shown in Figure 4a. The binding of GST-tagged mL1, mS1, mS2, mL2, mP1 and mP2 to the genomic DNA of the expression host was detected by PAGE and Golden View staining (mL1, mS1, mS2, mL2, mP1, and mP2 lane in Figure
4b). The above-mentioned purified PELF1 mutant peptide sample has no bound DNA and can be used for binding studies of PELF1 mutant peptide DNA. The binding of GST- tagged mL1, mS1, mS2, mL2, mP1 and mP2 to PardC DNA was detected by EMSA (Fig. 4c & d). PardC DNA mixed with GST-
tagged mL1, mS1, mP1 and mP2 is identical to PardC DNA in PELF1/PardC complex. The electrophoretic migration rate on the PAGE gel is smaller than that of the free PardC DNA. The electrophoretic migration rate was less, indicating that the PELF1 of Lys6Thr, Ser7Ala, Pro10Ala and Pro11Ala mutations can still bind to DNA, and also that Lys6, Ser7, Pro10 and Pro11 do not affect the binding of PELF1 to DNA. Unlike the above results, the PardC DNA mixed with GST- mS2 and GST-mL2 had a higher electrophoretic migration rate on the PAGE gel than free PardC DNA (Figure 4c) and Coomassie brilliant blue R-250 staining and the results are shown in Fig. 4d. The electrophoretic migration rate is less, but the PardC DNA electrophoretic migration rate is larger than the PELF1/PardC mixture. This indicates that both Ser8 and Lys9 mutations affect the binding of PELF1 to DNA and Ser8 and Lys9 are key amino acids affecting the binding of PELF1 to PardC DNA.
Effect of C4 Zinc Finger Structure on the Binding of PELF1 to DNA
To realize the effect of conserved cysteine Cys25 and Cys28 in the C4 zinc finger structure on PELF1 binding DNA. We expressed the PELF1 mutant peptides mC1~2, mC1C2 and deletion peptide dC1C2 in E. coli BL21. The GST-tagged mC1~2, GST-mC1C2 and GST-dC1C2 fusion proteins were purified by Glutathione Sepharose 4B. The binding of GST-dC1C2, GST-tagged mC1~2 and GST-mC1C2 to E. coli. DNA was detected by EMSA. The purified protein samples all contained nucleic acids (Figure 5a, 1-4 lane). After treatment with DNA hydrolase, the purified protein- binding DNA disappeared, see the lane 5-8 in Figure 5a. These results suggest that GST-dC1C2, GST-tagged mC1~2 and GST-mC1C2 expression products contain E. coli. DNA. GST-dC1C2, GST-tagged mC1~2 and GST-mC1C2 treated with DNA hydrolase were mixed with PardC and incubated for 1h at room temperature (RT). The binding of GST-dC1C2, GST- tagged mC1~2 and GST- mC1C2 to PardC was also detected by gel retardation assay/EMSA (Figure 5b). It was found that the mobility of PardC bound to GST-dC1C2, GST-tagged mC1~2 and GST-mC1C2 on PAGE gel was less than that of free PardC (Figure 5b). Indicating that GST-dC1C2, GST- tagged mC1~2 and GST-mC1C2 are the same as GST-PELF1, it can bind to PardC in vitro. These results suggest that the PELF1 is conserved cysteine Cys25 and Cys28 in the 23-28 peptide and C4 zinc finger domains are independent of the role of PELF1 binding DNA. 278 The effect o f PELF1 binding to DNA is only related to t h e 1-MGKRKKSSKPPPKKKRPVLSKV-22 peptide segment of the N-terminus of PELF1.
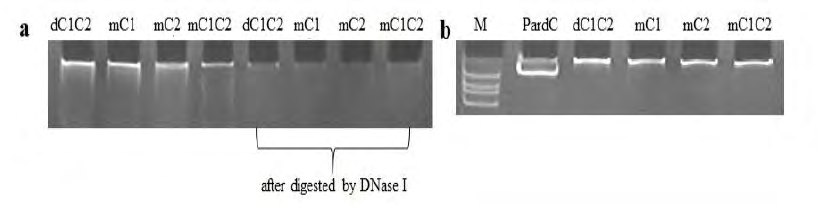
Figure 5: (a) Detection of E. coli DNA binding with purified GST-tagged dC1C2, mC1~2, mC1C2 by EMSA. (b): Detection of PardC binding with purified GST-tagged dC1C2, mC1~2, mC1C2 by EMSA. Lanes: M - Marker; PardC - PardC without protein; dC1C2 -obtained by deletion of PELF1 23-28 peptides and purified GST; mC1~2 - Cys25Ala and Cys28Ala mutant PELF1s and purified GST; mC1C2 - Cys25Ala and Cys28Ala mutant PELF1 and purified GST.
Effect of P14-3-3 Interaction with Pelf1 on the Binding of PELF1 to DNA
We incubated the purified P14-3-3 and PELF1 and their defective peptides for 2 h at RT, and then with the PardC actin gene. The promoter PardC fragment was mixed for 1 h, and then the effect of P14-3-3/PELF1 complex on PELF1 binding DNA was detected by gel suppression electrophoresis. The control lane is free PardC; the 2, 4, 6, 8, 10, 12, 14, and 16 lanes are the reaction samples of GST-tagged PELF1, ∆C1~4, ∆N4~6, respectively; and 3, 5, 7, 9, 11, 13, 15, 17 lanes contain GST-tagged PELF1, ∆C1~4, ∆N4~6, respectively and mixed with Trx-P14-3-3 for 1 h at RT and then incubated with PardC for 1 h. As can be seen from Figure 6, P14-3-3 binds to PardC after binding to GST-tagged PELF1 and ∆C1~4 (both containing N-terminal 1-22 peptides). The migration rate of PardC became less while P14-3-3 was mixed with the PELF1 residual peptide lacking the N-terminal 1-22 peptide and then bound to PardC, but the electrophoretic migration rate of PardC was not affected. The above results indicate that PELF1 can still bind to PardC through its N-lterminal Coil sequence after binding to P14-3-3.
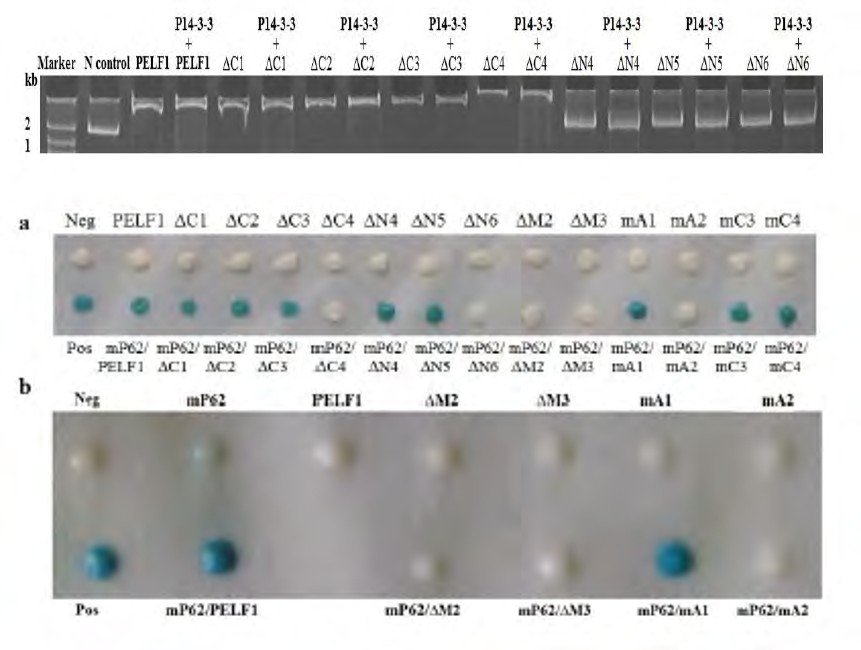
Figure 6 Gel-repression electrophoresis of PELF1 residual, deletion and mutant peptide after binding to P14-3-3 and binding to PardC. ∆C1~4: PELF1 residues lacking 20, 35, 46 and 67 amino acid residues at the C-terminus; ∆N4~6: 30, 39 and 49 amino acid residues at the N-terminus, respectively PELF1 residual peptide; Lanes: Marker – Marker; Control- free PardC; lanes 3, 5, 7, 9, 11, 13, 15, 17: PardC bound with GST-tagged PELF1, ∆C1~4, ∆N4~6 respectively; lanes 4, 6, 8, 10, 12, 14, 16, 18: PardC bound with Trx-P14-3-3 and mixed with (incubated at RT for 1 h) GST-tagged PELF1, ∆C1~4, ∆N4~6 respectively.
The Interaction of PELF1 and P14-3-3
In order to understand the interaction between PELF1 and P14-3-3, as well as the role of PELF1 N-terminal motif, C-terminal motif and C4 zinc finger structure in PELF1 and P14-3-3 interaction, we paired the plasmid pGBK-mP62 (P14-3-3 with mutations at Ser62Ala) with pGAD-tagged PELF1, ΔC1~4, ΔN4~6, ΔM2~3, mA1~2, and mC3~4 and co-transformed them into yeast Y187. Then positive clones were screened on SD/Leu/-Trp culture plate. The insertion fragments of plasmids in the transformants were identified by PCR. The expression of a Gal4 protein regulatory gene LacZ was detected by X-gal filter paper colourimetric assay when BD-mP62 was co-expressed with AD-tagged PELF1, ΔC1~4, ΔN4~6, ΔM2~3, mA1~2, and mC3~4. Figure 7a shows that the colour development results of the positive control yeast (Y187 containing plasmid pGBKT7-53 and yeast hybridized with AH109 containing plasmid pGAD-424-T) were identical. Co-expressing BD-mP62/AD-tagged PELF1, ΔC1~3, ΔN4~5, mA1, and mC3~4 Yeast Y187 transformants were blue on X-gal filter paper colourimetry. This indicates that there is an interaction between the co-expressed proteins in these Y187 yeast transformants. The yeast Y187 transformants co-expressing BD-mP62/AD-tagged ∆C4, ∆N6, ΔM2~3, and mA2 had no colour reaction on the X-gal filter paper like the negative control yeast Y187. This indicates that the co- expressed proteins in these Y187 yeast transformants have no interaction. The above results indicated that PELF1 and PELF1 defective peptides ∆C1~3 and ∆N4~5 containing the 40-RDAGI-44 peptide can interact with mP62 in yeast Y187. The 40-44 peptide segment of PELF1 is located at the corners of the βA and βB slices of the C4 zinc finger structure of PELF1. But, the conserved cysteine Cys49 and Cys52 of the C4 zinc finger structure do not directly interact with P14-3-3, this means that the C4 zinc finger structure plays a key role in the PELF1 and P14-3-3 interactions.
Figure 7: (a): X-gal filter assay for the interactions between PELF1 residual, deletion andmutant peptides with mP62 in yeast Y187. Lanes: Pos - positive control (Y187 containing pGBKT7-53 hybrid with AH109 containing pGAD-424-T); Neg - negative control (Yeast Y187); ∆C1~4 - obtained by deletion of 20, 35, 46 and 67 residues at the C-terminus respectively; ∆N4~6 - obtained by deletion of 30, 39 and 49 residues at the N-terminus respectively; ∆M2~3 - deletions of 40-44, and 41-42 peptides; mA1~2 and mC3~4 - PELF1 with mutations at Asp41Ala, Ala42Val, Cys49Ala and Cys52Ala, respectively; mP62 -P14-3-3 with mutations at Ser62Ala. (b): Detection of PELF1 deletion peptide and mutant peptide interacting with mP62 by X-gal filter paper colourimetric assay. Upper row: Neg- negative control; pGBK -Y187-tagged mP62, PELF1, ∆M2~3, mA1~2 Lower row: Pos- positive control, pGBK- mP62/pGAD-Y187-tagged PELF1, ∆M2~3, mA1~2; mP62 -P14-3-3 with mutations at Ser62Ala; ∆M2~3 - deletions of 40-44 and 41-42 peptides, respectively; mA1~2 - PELF1 with mutations at Asp41Ala and Ala42Val, respectively.
We found that PELF1 could interact with p14-3-3 in vitro and found that the 40- RDAGI-44 peptide segment, detected via yeast double hybridization, was the key peptide segment of PELF1 and P14-3-3. In order to understand the key amino acids that affect the interaction between PELF1 and P14- 3-3, we paired the plasmid pGBK-mP62 with pGAD-tagged ∆M2~3, and mA1~2 were co-transformed into yeast Y187, respectively. Then positive clones were screened on SD/ Leu/-Trp culture plate. The insertion fragments of plasmids in the transformants were identified by PCR. The expression of a Gal4 protein regulatory gene LacZ was detected by X-gal filter paper colourimetric assay. Whether BD-mP62/ AD-tagged ∆M2~3, and mA1~2 can activate yeast Y187 Gal4 protein regulation through interaction expression of the gene LacZ. Figure 7b shows yeast recombinants co- expressing BD-mP62/AD-tagged PELF1, and mA1 and the positive control yeast showed blue colour on the X-gal filter paper. Thus, indicating that the Asp41Ala mutation did not affect the interaction between of PELF1 and P14-3-3. Yeast recombinants co-expressing BD-mP62/AD-tagged ∆M2~3, and mA2 and the negative control yeast could not develop colour on X-gal filter paper. It indicated that PELF1 lost its ability to interact with P14-3-3 after deletion of 40-44 aa, 41- 42 aa peptide or Ala42Val mutation. This shows that Ala42 is a key amino acid affecting the interaction between PELF1 and P14-3-3.
Examination of PELF1 Binding to DNA Via AFM
AFM was used to observe the binding of PELF1 to PardC DNA. Imaging effects of 10 ng/μl, 2 ng/μl and 1 ng/μl PardC DNA were observed. When the DNA concentration is 10 ng/ μl and 2 ng/μl, the DNA was linked into a grid. When the DNA concentration is 1ng/μl, the DNA imaging effect is better and the image is clearly evident with most DNA molecules linked together in an end-to-end mode (Figure 8a). The imaging effects of PELF1 and PardC DNA formed PELF1/ DNA complex by concentration ratio 1:1, 1:2, 1:4, 2:1, and 4:1 have been observed by AFM. When the concentration ratio of PELF1 and PardC DNA was 4:1, PELF1 tended to aggregate into a network. The best images were obtained when the concentration ratio of PELF1 and PardC DNA was 2:1 (Figure 8b). Therefore, the concentrations ration of PELF1 and PardC DNA selected by AFM were 2ng/μl and 1 ng/μl when PELF1 was combined with PardC DNA to form PELF1/DNA complex, respectively. The PardC DNA (indicated by the arrows in Figure 8a) was measured by the SPM9500-J3 AFM software. The average width of PardC DNA was 15.10 nm [27] which was close to the DNA width (9-15 nm) measured by AFM. The results also show that the average length of the PardC DNA molecule is 352.32 nm (due to errors in DNA bending and theoretical values approach), which is close to the theoretical value of B conformational DNA (359.89 nm) [28]. The eight linear substances in Figure 8b were measured by the SPM9500-J3 AFM software to obtain an average width of 56.76 nm, which is 40 nm wider than the linear PardC DNA, which indicates that these linear substances are PELF1/DNA complexes formed by PELF1 and PardC DNA. In addition, the study also found that the width of the PELF1/DNA complex has a uniform chain width, and PELF1 is densely distributed on the PardC DNA. However the fact that there is no obvious gap between the proteins, suggests that PELF1 has no specific binding sequence in DNA. In addition to the PELF1/ DNA complex, many free PELF1 particles (the substance indicated in arrow 3) were also found in Figure 8b. These particles average size was 57.62 nm, close to the average width of the PELF1/DNA complex. The width of the binding between PELF1 and PardC DNA did not increase significantly, and PELF1 and PardC DNA formed a tight binding state.
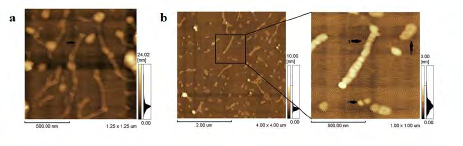
The results also showed that the average length of the four free stretched PELF1/DNA complexes was 353.62 nm, which is close to the average length of the free stretched PardC DNA molecules. These results suggest that the PELF1 does not cause significant stretching or compression of DNA after binding to PardC DNA. In addition to the aggregation and dissociation of the stretched PELF1/DNA complexes, some particulate matter with an average major axis of 184.63 nm and an average minor axis of 100.71 nm has also been found in Figure 8b (arrow 2 refers to the substance in Figure 8b). These particles are folded PELF1/DNA complexes. Figure 8b shows that the stretched PELF1/DNA is mostly multi- molecules linked together in an end-to-end interaction mode (Figure 8b, the 715 nm chain indicated by arrow 1 is two end-to-end PELF1/DNA complexes). The folded PELF1/DNA complex is mostly a single molecule in the end-to-end mode.
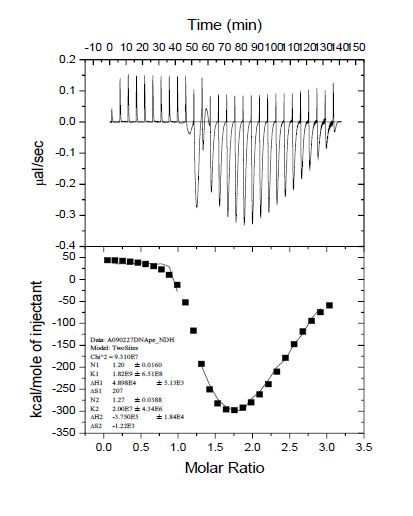
Titration of PELF1 with PardC and P14-3-3/ PELF1 with PardC Using ITC with Two Thermal Reaction Processes
In order to further understand the interaction between PELF1 and PardC, this study examined the thermal reaction process of PardC (0.67 μM) by PELF1 (10 μM) by ITC, and obtained the isothermal titration calorimetry curve and the nonlinearity of reaction enthalpy (■). The curve (transformation versus PELF1/PardC molar ratio) is shown in Figure 9. As can be seen from Figure 9, two thermal reactions occur during the titration of PardC by PELF1. The first thermal reaction occurred after the start of titration, the binding constant (K1) was 1.82×10⁹ L/mol, the enthalpy change (ΔH1) was 4.90×10⁴ kJ/mol, and the entropy change (ΔS1) was 207 kJ/mol. ΔG1 (ΔG1=ΔH1-TΔS1) is -1.27×10⁴ kJ/mol, and the number of intermolecular binding sites (N1) is 1.20. A positive entropy means that the molecules change from ordered to disordered during the initial interaction between PELF1 and PardC ( May involve DNA melting), the decrease of ΔG1 is mainly contributed by the increase of entropy; N1 of 1.20 means that there is an ionic bond formation process in the initial interaction between PELF1 and PardC. In the second thermal reaction process that followed, the binding constant (K2) was 2.00×10⁷ L/ mol, the enthalpy change (△ H2) was 427-3.75×10⁵ kJ/ mol, and the entropy change (△ S2) was -1.22×10³ kJ/mol, G2 is -7.38×10⁵kJ/mol. A negative value of △H2 means that the subsequent interaction between PELF1 and PardC is an endothermic reaction; a negative value of ΔS2 means that the subsequent interaction of PELF1 and PardC changes from disorder to order (probably DNA binding to PELF1) The resulting folding process); ΔG2 reduction is contributed by the reduction and entropy increase; N2 of 1.27 means that there is a second interaction between PELF1 and PardC. Comparing the thermodynamic parameters of the two thermal reaction processes, it can be seen that K1 is 91 times that of K2, indicating that the first thermal reaction process is a fast reaction, and the second thermal reaction process is a slow reaction; the first heat the reaction process reflects the formation of PELF1/PardC complex by PELF1 and PardC and the disordered allosteric (unfolding) process of PardC by PELF1. The second thermal reaction process reflects the first place between PELF1 and PardC. After the interaction site, a second interaction site is formed. The formation of the second site is accompanied by the disordered structure of the PELF1/PardC complex (possibly after PELF1 and PardC are combined Adaptive folding of DNA). This result further confirms that PELF1 interacts with PardC in vitro.
To further understand the effect of P14-3-3 on PELF1 binding DNA, the thermal reaction of P14-3-3/PELF1 complexes (isothermal reaction of PELF1 and P14-3-3 mixtures at RT for 2h) was measured by ITC. The obtained isothermal titration calorimetry curve and the nonlinear fitting curve of the reaction enthalpy change (■) (the molar ratio of P14-3-3/PELF1 complex to PardC) are shown in Figure 10. The thermal reaction process occurred when the P14-3-3/PELF1 complex was titrated with PardC and the when PELF1 was titrated with PardC. The binding constant (K1) of the first thermal reaction is 0.505 x 10⁹L/mol, enthalpy change (△H1) is -5.65×10⁴ kJ/mol and entropy change (△S1) is -150 kJ/mol. The free energy change (△G1) is -1.14 × 10⁴ kJ/mol, and the number of binding sites (N1) is 1.39. The negative value of △H1 means that the initial interaction of P14-3-3/PELF1 complex with PardC is an endothermic reaction. The decrease of △G1 is mainly contributed by enthalpy reduction, which means that the interaction of P14-3-3/PELF1 complex with PardC may cause further folding of PardC. N1 is 1.27 which means that there is an interaction between the initial interaction of the P14-3-3/PELF1 complex and PardC. The binding constant (K2) of the second thermal reaction is 1.94×10⁷ L/mol, the enthalpy change (△H2) is -1.00×10¹⁶ kJ/mol, and the entropy change (△S2) is -3.77×10¹³kJ/mol. The free energy change (△G2) is -1.00 x 10¹⁶ kJ/mol, and the number of binding sites (N2) is 2.7 x 10⁻¹¹. A negative value of △H2 means that the subsequent action of the P14-3-3/PELF1 complex with PardC is an endothermic process, and a negative value of △S2 means that the subsequent action of the P14-3-3/PELF1 complex with PardC is accompanied by a disorder in the order of the molecules. The △G2 reduction was mainly due to enthalpy reduction. The N2 value is 0 which means that the product of the P14-3-3/PELF1 complexes with PardC is an endothermic molecular folding process, but does not involve further intermolecular interaction. This means that the subsequent reaction of the P14-3-3/PELF1 complex with PardC is an allosteric process in which the molecule moves from disorder to order (possibly a molecularly induced coincidence folding).
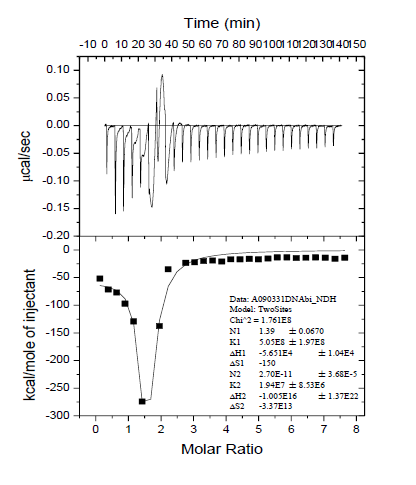
Comparing the thermodynamic parameters of the two thermal reaction processes, it can be seen that K1 is 26 times that of K2, indicating that the first thermal reaction process is a fast reaction and the second thermal reaction process is a slow reaction. Comparing N1 and N2, it can be seen that there is an intermolecular interaction in the first thermal reaction process. The second thermal reaction process involves only the molecular structure adjustment of the P14-3-3/ PELF1/PardC complex and does not involve intermolecular interaction. This result indicates that the P14-3-3/PELF1 complex could interact with PardC in vitro, and a trimer can be formed in vitro between P14-3-3, PELF1 and PardC.
Discussion
In this work, we provide several lines of evidences that PELF1 acts as a DNA-binding protein and plays an important role in DNA folding. The PELF1 gene was isolated from the genomic DNA of the P. polycephalum by PCR, and contains 3 exons and 2 introns. The PELF1 gene introns are located at 151-1201 nt and 272-364 nt. The two intron sequences of the pre-mRNA of PELF1 each have a potential branch point sequence, which is consistent with the classical branch point sequence “YNCURAY” of eukaryotes, indicating that the expression of PELF1 is regulated by splicing. Both ends of the intron sequence have a distinct conserved GTACG---CAG structure [26]. The PELF1 gene was transferred upstream of the P. polycephalum genomic DNA using TALF-PCR and a 530 bp control sequence was obtained for the start codon of the PELF1 gene. The mRNA level of the PELF1 gene was detected by Q-PCR. The expression of PELF1 is regulated by HFS and is involved in cellular stress response [29]. The mRNA levels of PELF1 genes were significantly higher in the G2 and M phase than those of the S phase. The relative level of PELF1 mRNA was highest at the spore stage, indicating that the expression of PELF1 echoes the degree of chromosome folding. The spores have a hard outer shell that can survive for several years under adverse conditions [30, 31]. It is speculated that the expression of PELF1 is related to the structural changes of the chromosome. Transcription factor is an important positive regulator of human Myeloid ectropic viral integration site 1 (MEIS1) [32]. Prather, et al., Daniels, et al. and Kumar, et al. [1, 3, 23] found that ELF1 plays an important role in DNA folding. Our results also suggest that PELF1 plays a role in regulating chromatin structure in regions of active transcription. Together, these results provide strong evidence of a significant role for PELF1 in transcription elongation.
The E. coli expression product showed that the PELF1 residual, deletion and mutant peptide containing N-terminal 1-22 peptide and treated by the DNA hydrolase DNaseI. The results showed that the nucleic acid was completely degraded, suggesting that the N-terminal 1-22 peptide fragment is located in E. coli BL21 expressed after E. coli DNA combination. Xiang, et al. [32] shows that human MEIS1 binding site of transcription factor is located at 289 bp. In our studies, the DNA binding site of PELF1 is located within 1-22 peptide segment of the N-terminus. Wei, et al. [33] analysed that ETS (E26 transformation-specific) family transcription factors binding sites in different cell models (human and mouse). The 1-MGKRKKSSKPPPKKKRPVLSKV-22 peptide is rich in basic amino acids at the N-terminus and plays a key role in the binding of PELF1 to DNA. It was also found that PELF1 binds to PardC through its N-terminal coiling sequence upon binding to P14-3-3. Prather, et al. [1] found that yeast ELF1 can bind to ELF1 in the GAL1 and PMA1 gene coding regions and Hogart, et al. [34] used various method to find that transcription factors have highly similar DNA‐ binding domains. Also, Makowski, et al. [35] found that transcription factors binding to recurrent in human telomerase reverse transcriptase promoter mutations. Our results found that, PELF1 is not only bound PardC it also DNA encoding P14- 3-3, DNA encoding PELF1, and PELF1 genomic DNA, which can be found by EMSA. These results indicate that PELF1 is not selective for the bound DNA and that PELF1 is not only capable of binding to the transcribed region of the gene, but also capable of binding to any fragment of any DNA.
Previously reported that 14-3-3 protein has direct effects with transcription factors Gal4, Gat1, Gcr2, Gln3, Gts1, Hot1, Mig1, Msn2, Msn4, Sfl1, Ume6, FoxO and Xbp1 [19, 36]. 14-3- 3 proteins also indirectly affect gene transcription by binding to regulatory factors upstream of the gene [17,18,20,]and also widely involved in various life activates in cells [10]. However, there is no report on the interaction of the ELF1 protein with the 14-3-3 family protein, and there is no subsequent report on the interaction of the ELF1 protein with other proteins. In the present study, we found that P14-3-3 can interact with PELF1. The interaction site of PELF1 and P14-3-3 is located on the 40-RDAGI-44 peptide at the βA→βB of the C4 zinc finger structure of the PELF1 protein. Since 42-AGI-44 in the 40-RDAGI-44 peptide is an inert amino acid, and Arg40 and Asp41 are polar amino acids, it is speculated that the effects of PELF1 and P14-3-3 are related to 40ArgAsp41 of PELF1. Thus, the 40-RDAGI-44 peptide in the PELF1 C4 zinc finger structural segment plays a key role in the interaction between PELF1 and P14-3- 3. Our results show that the 40-RDAGI-44 peptide is a key peptide affecting the interaction between PELF1 and P14- 3-3. Furthermore, we found that PELF1 deletion peptides with 41-42 amino acids and 40-44 amino acid deletions and Al42Val mutations cannot interact with P14-3-3, but PELF1 mutant peptides with Asp41Ala mutations can still interact with P14-3-3 interactions. Therefore, the key amino acid that affects the interaction between PELF1 and P14-3-3 is Ala42. Furthermore, ΔC1~3, ΔN1~2, dC3C4, mC3 and mC4 PELF1 peptides interacted with mP62 in Y187, and only ΔC4 and ΔN3 PELF1 peptides did not interact with mP62, indicating that the roles of PELF1 and P14-3-3 are independent of the N-terminal and C-terminal Coil structures of PELF1 and two potential phosphorylation sites. It is also independent of the four conserved cysteines on its C4 zinc finger structure.
The interaction of the PELF1 peptide with the P14-3-3 protein was also confirmed by immunoblotting (data are not showed). The his-tagged P14-3-3 does not pull-down GST, but those PELF1 peptides are expressed by pull-down fusion with GST. Overall of these results revealed that the PELF1 peptides interact with P14-3-3. P14-3-3 deficient peptides ΔC5 and ΔN7, P14-3-3 mutant peptides mP62, mP67 and mP235/236 failed to activate the expression of the auxotrophic yeast Y187 reporter gene LacZ. The results indicate that the C-terminal ligand binding domain and the N-terminal dimer binding domain, as well as the potential phosphorylation sites Ser62, Ser67 and 235ThrSer236, play key roles in P14-3-3 activation of yeast Y187 reporter gene transcription. We found that ΔC5, ΔN7, mP62, mP67 and mP235/236 interacted with PELF1, indicating that the interaction of P14-3-3 and PELF1 binds to the dimer binding domain of P14-3-3 and the ligand protein at the C-terminus. The domain and the potential phosphorylation sites Ser62, Ser67 and 235ThrSer236 are irrelevant. P14-3-3 does not form a heterodimer with PELF1, and the interaction between them is also independent of the phosphorylation state of P14-3-3. The site of action of the P14-3-3 and PELE1 C4 zinc finger structures (40A-RDAGI-44 peptide of the βA→βB turn) is located in the 81-218 peptide. The above results suggest that the interaction of PELF1 with P14-3-3 does not affect the formation of homologous or heterodimers by P14-3-3, nor does it affect the interaction of P14-3-3 with other proteins. P14-3-3/PELF1/DNA complex found that the average width of PELF1/DNA complex is greater than the average width of PardC DNA, and the average width of P14-3-3/PELF1/DNA complex is greater than PELF1/DNA complex by AFM. The average width of the PELF1 and P14- 3-3/PELF1 complexes was tightly aligned on PardC DNA, indicating that PELF1 has no specific binding sequence on the DNA. The length of P14-3-3 complexes was significantly higher than that of DNA length so, it is indicating that P14- 3-3 not only promotes the binding of PELF1 to DNA but also plays an important role in regulating the folding of PELF1/ DNA complex. AFM observations also show that when PardC DNA is at a high concentration, DNA molecules on the mica plate aggregate into a network state.
When PELF1 binds to PardC DNA, PELF1 is tightly aligned on the DNA, indicating that the increase in entropy during the first thermal reaction of PELF1 binding to DNA may be related to an increase in the number of macromolecules. The thermodynamic process of ITC detection of PELF1 combined with PardC shows that the action of PELF1 and PardC produces an exothermic, entropy-increasing process and an endothermic and entropic reduction process, each of which has an intermolecular binding site. The exothermic and entropic increase processes of PELF1 and PardC may involve intermolecular ionic bond formation (3-KRKK-6 and 13-KKKR-16 peptides at the N-terminus of PELF1 are rich in basic amino acids, possibly forming an ionic bond with the PardC group associated with acidity to generate heat) and DNA unfolding processes. The endothermic and entropic reduction processes of PELF1 and PardC may involve intermolecular secondary bonding and adaptive folding of DNA to form a PELF1/PardC complex.
At the same time, P14-3-3/PELF1 complexes binding with PardC DNA was determined by ITC. It shows that the two isothermal titration calorimetric enthalpy nonlinear fitting curves were similar and all had a fast response. These processes are slow reaction process, but the thermodynamic parameters of the two titration reactions are quite different. The total free energy produced by PELF1 titration of PardC was-7.51×10⁵ kJ/mol, while the total free energy of PardC produced by P14-3-3/PELF1 complex was up to -1.00×10¹⁶ kJ/mol, two titration reactions. The total free energy changes differ by 10 orders of magnitude, indicating that PELF1 binding to P14-3-3 is easier to bind DNA than PELF1 alone.
Materials and Methods
Culture of Physarum Polycephalum
The microplasmodia of P. polycephalum strain M3CVII ATCC 204388 (American type culture collection, a gift from Eggehard Holler, Institute of Biophysics and physical biochemistry, University of Regensburg) were cultured according to the method of Haindl, et al. [37] for 72 hr at 24 °C. To start a macroplasmodium, 1 g of wet microplasmodia was allowed to fuse on a 9 cm filter paper supported by glass beads in the plate. After 2 hr starvation, compatible growth medium was poured to the dish until the filter was soaked. After cultured in darkness for 16 hr at 24 °C, the samples were scraped from the edge of macroplasmodium according to the cell cycle (the first synchronizedmitosis).
TAIL-PCR and Genes Cloning
Physarum ardC (PardC) is the promoter of the ardC actin gene of P. polycephalum. PardC (5’ region of ardC actin gene, 1107 nt, GenBank accession No. M73459 [38] and the PELF1 DNA were cloned from the P. polycephalum genome DNA using primers5’- CGGAATTCGGATCTCCACACTATTGCAC-3’(EcoRI)/5’- CGAGCTCTGCGGTTTGTTTGTTTTGTTGTTTTGC-3’ (Sal I), and PELF1F primer 5’- C C G G A A T T C A T G G G T A A A A G A A A G A A G T C - 3’andPELF1Rprimer5’-ACGCGTCGACGTGTTGCATATTCC-3’. The 5’ region of PELF1 DNA was cloned from the P. polycephalum genome DNA referring to the thermal asymmetric interlaced TAIL-PCR established by Liu, et al. [39]. Sequenced PELF1 genomic DNA and known PELF1 cDNA sequences were detected by DNAssist Version 2.0 comparison, PELF1 ORF (open reading frame). For the first reaction of TAIL-PCR, each 50-μl primary mixture contained 5 μl 10×LA-PCR Buffer-II, 8 μl dNTPs mixture (2.5 mmol/L each), 10 pmol/L5’-CGTTCGCAAGCATCAATCCA-3’ primer, 100 pmol/L 9-mer random primer, 0.5 μlLA- Taq DNA polymerase (Takara, Dalian), and 2 ng genome DNA; for the secondary reaction, 1 μl of primary TAIL- PCR product was used as the template, with 10 pmol/L 5’-GAAGGAAACGAAACCTATGC-3’ primer and 100 pmol/L 9-mer random primer; for the tertiary TAIL-PCR, again 1 μl of secondary TAIL-PCR product was used as the template, with 10pmol primers 5’-TTTACTGTAGAGGCATTAGCA-3’ and 100 pmol 9-merprimer. The specific products above were gel purified and reconstituted with the clone vector pMD18T (Takara), resulting in recombinant plasmids pMD-PardC, pMD-gpelf1 and pMD-tail-pelf1, and then sequenced.
Quantification of PELF1 Expression in Different Cell Cycles Using Q-PCR
The total RNA of P. polycephalum samples were quantified using GeneQuant Pro DNA/RNA spectrophotometer (GE Healthcare). The mRNAs level of P14-3-3 and PELF1 over the course of the cell cycle and under different stresses was quantified using the Thunderbird Probe qPCR Mix kit (Toyobo, Shanghai), with primers and probes (Appendix Table 1) following the procedure specified by Sadon, et al. [40]. Each reaction mixture was 20-μl and contained 10 μl Probe qPCR Mix, 0.4 μl 50 × ROX Dye, 0.3 μM Forward Primer, 0.3 μM Reverse Primer, 0.4 μM TaqMan Probe, 2 μl cDNA, and ddH2O. The amplification conditions were 95°C for 10 min and 40 cycles of 95°C for 15 s and 60°C for 1 min, and the resulted fragments were 158 bp and 100 bp respectively. The level of PELF1mRNAs from S phase cells of normal cultured P. polycephalum served as the control. The Q-PCR measurements were run in triplicate on an ABI Prism 7300 detection system (Applied Biosystems, Foster City, CA, USA). The data evaluation was transformed with the software StepOne™ v2.0 (Applied Biosystems) using the ∆∆CT method [40].
Defective and Mutant Peptides
The truncated PELF1 with deletions of 20, 35, 46, and 67 residues at the C-terminus, and 5, 11, 17, 30, 39, and 49 residues at the N-terminus, and deletions of 12-17, 40-44, 41-42, 23-28, and 45-52 aa peptides, were named ΔC1~4, ΔN1~6, ΔM1~3, dC1C2, and dC3C4 respectively (Appendix Fig. A4). The PELF1 with mutations at Lys6Thr, Ser7Ala, Ser8Ala, Lys9Thr, Pro10Ala, Pro11Ala, Cys25Ala, Cys28Ala, Asp41Ala, Ala42Val, Cys49Ala and Cys52Ala were named mL1, mS1, mS2, mL2, mP1, mP2, mC1, mC2, mA1, mA2, mC3 and mC4, respectively. PELF1 with simultaneous mutations at Cys25Ala and Cys28Ala were named mC1C2. The P14-3-3 with mutations at Ser62Ala, Ser67Ala, Ser190Ala, Thr235Ala, Ser236Ala, and Thr235Ala/Ser236Ala were named mP62, mP67, mP190, mP235, mP236, and mP235/236, respectively. The P14-3-3 defective peptide lacking 43 amino acid residues at the C-terminal (Coil structure interacting with ligand proteins) was named as ΔC5 and the P14-3-3 defective peptide lacking 80 amino acid residues at the N-terminal (containing 2 dimer binding domains) was named as ΔN7, deleted N- 35 amino acid residues at the terminal 30 and C-terminus also named as tpM (Appendix Fig. A5).
Construction of Recombinant Plasmid
The DNA fragments of wild-type (wt) PELF1 and its truncated mutants ΔC1~4, and ΔN1~6 were amplified by PCR from the vector pGAD-pelf1 described by Liu, et al. [41] using the primers listed in Appendix Table 2a, and then inserted between the EcoR I and Sal I site of the E. coli expression vector pGEX-5X-1 and the yeast expression vector pGAD-424, resulting in recombinant plasmids pGEX-PELF1, pGEX-tagged ΔC1~4 and ΔN1~6 and pGAD-tagged ΔC1~4 and ΔN1~6. The DNA fragments of truncated PELF1 peptides ΔM1~3 and the site-directed mutagenesis of PELF1 were cloned by the Pfu DNA polymerase (Fermentas, ON, Canada) from the pGEX-PELF1 and from the pGAD- PELF1 using the primers listed in Appendix Table 2b, and then digested by the Dpn I (Takara,Dalian), resulting in recombinant plasmids pGEX- tagged ΔM1~3, mL1, mS1, mS2, mL2, mP1, mP2, mC1, mC2, mA1, mA2, mC3 and mC4 and pGAD-tagged ΔM1~3, mL1, mS1, mS2, mL2, mP1, mP2, mC1, mC2, mA1, mA2, mC3 and mC4. The DNA fragments of the site-directed mutagenesis of the P14-3-3 were cloned by the Pfu DNA polymerase from the vector pGBK-p14-3-3 constructed by Liu, et al. [41] using the primers listed in Appendix Table 2a-b, and digested by the Dpn I, resulting in recombinant plasmids pGBD-tagged mP62, mP67, mP190, mP235, and mP236 in E. coli BL21 (DE3).
Expression and Purification of Recombinant Proteins
The recombinant E. coli DH5α strains expressing the Glutathione S-transferase (GST) and the GST-fusion proteins were cultured at 37°C in LB broth containing 50 µg/ml ampicillin until OD600 of cell culture reach 0.5~0.6. GST. GST- fusion-tagged ΔC1~5, ΔN1~7, ΔM1~3, mL1, mS1, mS2, mL2, mP1, mP2, mC1, mC2, mA1, mA2, mC3 and mC4, expression were then induced with 1 mM isopropyl β-D-thiogalactoside (IPTG) at 37°C for 4 hr before collection by centrifugation. The pelleted cells were then washed with 10ml lysis buffer (137 mM NaCl, 2.7 mM KCl, 4.3 mM Na2HPO4, 1.4 mM KH2PO4, 2 mM DTT, 0.2 mM PMSF (protease inhibitor mixture (Sigma, St Louis, MO, USA), pH7.4) and suspended in 20 ml of ice- cold PB. The cells were lysed by sonication (10×15 s bursts with 5 s for cooling between bursts) and then collecting the suspension by centrifugation. The strain expressing the Trx-fusion P14-3-3 was cultured and induced in the same manner. The GST and the GST-fusion proteins were purified by affinity chromatography using GSTrap Fast Flow agarose (Amersham Biotech, Uppsala, Sweden) on AKTATM FPLC UPC- 900 (Amersham) according to the manufacturer’s protocol with elution buffer (50 mM Tris, 20 mM GST, 2 mM DTT, pH 8.0) after the lysate supernatant was filtrated by 0.45 μm filter and the bound E. coli DNA was digested by 500 U DNase I for 30 min. The Trx-fusion P14-3-3 was purified using Chelating Sepharose Fast Flow agarose (Amersham) with elution buffer (50 mM Tris, 100 mM NaCl, 0.2 mM PMSF, 50 mM imidazole, pH 8.0) as previously described [42]. The purified proteins were desalted by HiPrep 26/10gel (Amersham) using a desalting buffer (137 mM NaCl, 2.7 mM KCl, 4.3 mM Na2HPO4, 1.4 mM KH2PO4, pH 7.5) and then condensed by ice-dried. The protein solutions were then adjusted to 300 μg/ml using distilled H2O after the concentration of the proteins was determined by the Bradford assay. The purity of the proteins was analyzed by 12% sodium dodecylsulphate- polyacrylamide gel electrophoresis (SDS-PAGE), followed by staining with 0.1% Coomassie Blue.
Electrophoretic Mobility Shift Analysis (EMSA)
PardC is the promoter of the actin gene of P. polycephalum. In this paper, the plasmid pXM-2 was used as a template, and the primer PardC fragment was used with the primer 5’-CGGAATTCGGATCTCCACACTATTGCAC-3’ (including EcoR I site) and 5’-CGAGCTC TGCGGTTTGTTTGTTTTGTTGTTTTGC-3’ (including Sal I site). The wild-type PELF1 and its deletions and mutation peptides binding with DNA were determined using Electrophoresis Mobility Shift Assay (EMSA) referring to the method of Hellman, et al. and Siu, et al. [43, 44]. The assay was carried out with 8 μl of PELF1 (5.4×10⁻⁵ M) or its deletions and mutations solutions, 1 μl PCR product of PardC (6.6×10⁻⁷ M), 1.5 μl 10 mM spermine, 1.5 μl 10 × binding buffer (10 mM Tris, 1 mM EDTA, 100mM KCl, 0.1 mM DTT, 5% glycerol (v/v), 10 mg/L BSA, pH 7.5) in a final volume of 15μl and were incubated at room temperature (RT) for 1 hr. The mixture containing DNA but the absent protein served as the control. Then free PardC and the PardC bound to PELF1 deletion peptides and mutant peptides were separated by 8% PAGE gel electrophoresis, and then the PAGE gel was immersed in 1 × TAE buffer (40 mM Tris, 2.5 mM EDTA, adjust the pH to 7.8 with acetic acid) with 5 μl Gold dye at RT for 30 min. After that the gel was detected and photographed through the gel imaging system (Shanghai Fusun Technology Co., Ltd. FR-980). The P14-3-3 effect on the PELF1 and its deletions binding with PardC DNA was assayed as above. An equal amount of Trx-fusion P14-3- 3, or the GST-fusion PELF1, or its deletions were mixed with PardC DNA in binding buffer incubated and processed under the same conditions. The effect of P14-3-3 protein on PELF1
binding to PardC was compared with the sample without Trx-P14-3-3 fusion protein.
Determination of the Yeast Reporter Gene Transcriptional Activity
Competent yeast Y187 cells were prepared using a LiAc/SS/-DNA/PAGE based protocol [45]. Yeast expression vectors were transformed into Y187 yeast strains according to the protocol provided by Clontech. The transformants containing the vector pGAD-tagged ΔC1~5, ΔN1~7, ΔM1~3, mL1, mS1, mS2, mL2, mP1, mP2, mC1, mC2, mA1, mA2, mC3 and mC4 were selected on SD/-Leu plates. The transformants containing the vector pGBK-tagged mP62, mP67, mP190, mP235, and mP236 were selected on SD/-Trp plates. The transformants containing both pGAD- and pGBK- vectors were selected on SD/-Leu/-Trp plates. Yeast reporter gene transcriptional activity was detected on an X-gal filter based on Liu, et al. [41]. Blue coloured colonies indicate successful activation of expression of the LacZ reporter gene due to the interaction of co-expressed proteins or expression of a single protein alone_._ AH109 cells containing pGAD-424 or pGBKT7 were used as negative controls. Two-hybrid yeast cells (Y187 cells containing pGBKT7-53 and AH109 cell containing pGADT7-RecT) were used as positive controls.
Atomic Force Microscopy (AFM)
The PardC DNA amplified from vector pMD-PardC was purified twice using Agarose Gel DNA Purification Kit Ver 2.0 (TaKaRa, Dalian). The PELF1/DNA and the P14-3-3/PELF1/ DNA complexes were prepared by incubation 50 μl mixture of 1 mM MgCl2, 1ng/μl PELF1 and 2 ng/μl PardC DNA, and 50 μl mixture of 1 mM MgCl2, 1 ng/μl GST-fusion PELF1, 1 ng/μl Trx-fusion P14-3-3, and 2 ng/μl PardC DNA at 37 °C for 30 min respectively. The contamination on the mica surface was eliminated using transparent adhesive plaster and rinsed twice with ultrapure water. After 50 μl of the reaction mixture was deposited onto 1 × 2 cm2 mica and adsorption at RT for 15 min, the sample was rinsed twice with ultrapure water and then dried with a stream of compressed nitrogen. AFM imaging was performed using an SPM9500-J3 AFM instrument (Shimadzu, Kyoto, Japan) with a NanoSensors FMR-20 tip, and the images were collected in tapping mode with an oscillation frequency 300-400 kHz in air. DNA and protein-binding DNA molecules were analysed using SPM- 9500 Series Data Processing Unit software to trace each molecule and to accurately measure the contour length and width.
Isothermal Titration Calorimetry (ITC)
Heats of interaction were measured on a VP-ITC calorimeter (MicroCal, Northampton, MA, USA) with a cell volume of 1.43 ml. The Trx-fusion P14-3-3, GST-fusion PELF1 and PardC DNA were adjusted to 10 μM, 10 μM and 0.67 μM using 10 mM Tris-HCl buffer (pH 7.5) respectively. The Trx-P14-3-3/GST-PELF1 complex was prepared by mixing equal aliquot solutions of Trx-P14-3-3 and GST-PELF1 at 25°C for 2 hr. The solution of GST-PELF1 and Trx-P14-3-3/ GST-PELF1 complex were deflated for 30 min under vacuum before they were titrated into the solution of PardC DNA. Except for the first 3 μl, titrations typically consisted of 29 × 10 µl injections of 24 s duration each with 5 min spacing between injections. All experiments were performed at 25°C. Syringe rotation was fixed to 300 rpm. Reference power was fixed to 15. Prior to fitting analysis, data point from the first injection was removed, and the reaction heat data were corrected by subtracting the heat of dilution obtained from injection of buffer solution into a DNA solution. Binding isotherms were fitted using a nonlinear least square curve- fitting algorithm (Origin 5.0, MicroCal). The binding constant (K), the stoichiometric ratio (N), and the changes of enthalpy and entropy (ΔH° and ΔS°) were given by the software. The Gibbs free energy change (ΔG°) was calculated using formula ΔG°= ΔH° - TΔS°.
Conclusion
In conclusion, we identified that PELF1 is involved in the osmotic stress of P. polycephalum and it is up regulated at the end of G2 and M phase indicating the expression of PELF1 is correlated to the degree of chromosome folding. It is speculated that the expression of PELF1 is related to the structural changes of chromosomes. PELF1 binds to DNA via in vitro, and its binding site is located in the 1-22 peptide range at the N-terminus. The interaction between PELF1 and P14- 3-3 was found in vitro, and the interaction site was located at 40-RDAGI-44 aa peptide at the βA→βB of the C4 zinc finger structure of the PELF1 protein. Further detection showed that the transcriptional activation function of P14-3-3 is related to its N-terminal structure and potential phosphorylation sites (62Ser, 67Serand 235ThrSer236). AMF results shows that P14-3-3 increase the aggregation of PELF1 and DNA. The average length of the P14-3-3/PELF1/DNA complex was significantly shorter than the average length of PELF1/DNA, indicating that P14-3-3 not only has promoted the binding of PELF1 to DNA but also plays an important role in regulating the folding of PELF1/DNA complexes. It was also evident in ITC results, that the binding of PELF1 to P14-3-3 is easier to bind to DNA than PELF1 alone.
Acknowledgment
This research was funded by Shenzhen Scientific Technology Basic Research Projects, grant numbers JCYJ20170302144210545, JCY20140418193546107, and JC201105130450A. And also funded by Natural Science Foundation of China, grant number 31070043, and National
High Technology Research and Development Program of China, grant number 863 Program 2012AA030312.
Author Contribution
“conceptualization, LSD, KZ and GRV.; methodology, KZ, GRV, JHZ and LSD.; validation, GRV, JNT and LSD; formal analysis, GRV, JHZ and LFL.; investigation, GRV, JHZ and LSD.; resources, LSD, JNT and JLQ; data curation, GRV and KZ; writing—original draft preparation, GRV.; writing-review and editing, GRV, KZ,LSD, JHZ, JNT, and LFL; visualization, GRV.; supervision, LSD and JLQ; project administration, JLQ and LSD.; funding acquisition, JLQ and LSD.
Conflicts of Interest
The authors declare no conflict of interest.
References
-
Prather D, Krogan NJ, Emili A, Greenblatt JF, Winston F (2005) Identification and characterization of Elf1, a conserved transcription elongation factor in Saccharomyces cerevisiae. Molecular and Cellular Biology 25(22): 10122-10135.
-
Krishna SS, Majumdar I, Grishin NV (2003) Structural classification of zinc fingers: survey and summary. Nucleic acids research 31: 532-550.
-
Daniels JP, Kelly S, Wickstead B, Gull K (2009) Identification of a crenarchaeal orthologue of Elf1: implications for chromatin and transcription in Archaea. Biology direct 4: 24.
-
Altschul SF, Gish W, Miller W, Myers EW, Lipman DJ (1990) Basic local alignment search tool. J Mol Biol 215(3): 403-410.
-
Marchler-Bauer A, Anderson JB, DeWeese-Scott C, Fedorova ND, Geer LY, et al. (2003) CDD: a curated Entrez database of conserved domain alignments. Nucleic acids research 31(1): 383-387.
-
Liu SD, Li LF, Li MH, Zhang JH, Tian SL, et al. (2008) ELF-1 homolog of Physarum polycephalum is a 14-3-3 related protein. Unpublished.
-
Moore B (1967) Specific acidic proteins of the nervous system. Physiological and Biochemical Aspects of Nervous Integration, pp: 343-359.
-
Fu H, Subramanian RR, Masters SC (2000) 14-3-3 proteins: structure, function, and regulation. Annual review of pharmacology and toxicology 40: 617-647.
-
Ferl RJ, Manak MS, Reyes MF (2002) The 14-3-3s. Genome biology 3: reviews3010. 3011.
-
Mhawech P (2005) 14-3-3 proteins-an update. Cell research 15: 228.
-
Shimada T, Fournier AE, Yamagata K (2013) Neuroprotective function of 14-3-3 proteins in neurodegeneration. BioMed research international 2013: 564534.
-
Benzinger A, Popowicz GM, Joma KJ, Majumdar S, Holak TA, et al. (2005) The crystal structure of the non-liganded 14-3-3σ protein: insights into determinants of isoform specific ligand binding and dimerization. Cell research 15(4): 219-227.
-
Gardino AK, Smerdon SJ, Yaffe MB (2006) Structural determinants of 14-3-3 binding specificities and regulation of subcellular localization of 14-3-3-ligand complexes: a comparison of the X-ray crystal structures of all human 14-3-3 isoforms. Seminars in cancer biology 16(3): 173-182.
-
Yang X, Lee WH, Sobott F, Papagrigoriou E, Robinson CV, et al. (2006) Structural basis for protein–protein interactions in the 14-3-3 protein family. Proceedings of the National Academy of Sciences 103(46): 17237- 17242.
-
Wang J, Goodman HM, Zhang H (1999) An Arabidopsis 14‐3‐3 protein can act as a transcriptional activator in yeast. FEBS letters 443(3): 282-284.
-
Carrasco JL, Castelló MJ, Vera P (2006) 14-3-3 mediates transcriptional regulation by modulating nucleocytoplasmic shuttling of tobacco DNA-binding protein phosphatase-1. Journal of Biological Chemistry 281(32): 22875-22881.
-
Bruckmann A, Hensbergen PJ, Balog CI, Deelder AM, Steensma HY, et al. (2007) Post-Transcriptional Control of the S accharomyces cerevisiae Proteome by 14-3-3 Proteins. Journal of proteome research 6(5): 1689-1699.
-
Van Heusden GPH (2009) 14-3-3 Proteins: insights from genome-wide studies in yeast. Genomics 94(5): 287- 293.
-
Kakiuchi K, Yamauchi Y, Taoka M, Iwago M, Fujita T, et al. (2007) Proteomic analysis of in vivo 14-3-3 interactions in the yeast Saccharomyces cerevisiae. Biochemistry 46(26): 7781-7792.
-
Bruckmann A, Steensma HY, de MATTOS MJT, van HEUSDEN GPH (2004) Regulation of transcription by Saccharomyces cerevisiae 14-3-3 proteins. Biochemical Journal 382: 867-875.
-
Neigeborn L, Celenza JL, Carlson M (1987) SSN20 is an essential gene with mutant alleles that suppress defects in SUC2 transcription in Saccharomyces cerevisiae. Molecular and cellular biology 7(2): 672-678.
-
Yamaguchi Y, Narita T, Inukai N, Wada T, Handa H (2001) SPT genes: key players in the regulation of transcription, chromatin structure and other cellular processes. The Journal of Biochemistry 129(2): 185-191.
-
Kumar A, Agarwal S, Heyman JA, Matson S, Heidtman M, et al. (2002) Subcellular localization of the yeast proteome. Genes & development 16(6): 707-719.
-
Kamath RS, Fraser AG, Dong Y, Poulin G, Durbin R, et al. (2003) Systematic functional analysis of the Caenorhabditis elegans genome using RNAi. Nature 421: 231.
-
Li ZT, Gray D (2005) Isolation by improved thermal asymmetric interlaced PCR and characterization of a seed-specific 2S albumin gene and its promoter from grape (Vitis vinifera L.). Genome 48(2): 312-320.
-
Tsai KW, Chan WC, Hsu CN, Lin WC (2010) Sequence features involved in the mechanism of 3’splice junction wobbling. BMC molecular biology 11: 34.
-
Coury JE, Mcfail-Isom L, Williams LD, Bottomley LA (1996) A novel assay for drug-DNA binding mode, affinity, and exclusion number: scanning force microscopy. Proceedings of the National Academy of Sciences 93(22): 12283-12286.
-
Ho PS (1994) The non-B-DNA structure of d (CA/TG) n does not differ from that of Z-DNA. Proceedings of the National Academy of Sciences 91(20): 9549-9553.
-
Burdon RH (1993) Heat shock proteins in relation to medicine. Molecular aspects of medicine 14(2): 83-165.
-
Gawlitta W, Wolf KV, Hoffmann H-U, Stockem W (1980) Studies on microplasmodia of physarum polycephalum. Cell and tissue research 209: 71-86.
-
Thiriet C, Hayes JJ (1999) Chromatin remodeling by cell cycle stage-specific extracts from Physarum polycephalum. European journal of cell biology 78(3): 214-220.
-
Xiang P, Lo C, Argiropoulos B, Lai CB, Rouhi A, et al. (2010) Identification of E74-like factor 1 (ELF1) as a transcriptional regulator of the Hox cofactor MEIS1. Experimental hematology 38(9): 798-808. e792.
-
Wei GH, Badis G, Berger MF, Kivioja T, Palin K, et al. (2010) Genome‐wide analysis of ETS‐family DNA‐binding in vitro and in vivo. The EMBO journal 29(13): 2147-2160.
-
Hogart A, Lichtenberg J, Ajay SS, Anderson S, Margulies EH, et al. (2012) Genome-wide DNA methylation profiles in hematopoietic stem and progenitor cells reveal overrepresentation of ETS transcription factor binding sites. Genome research 22(8): 1407-1418.
-
Makowski MM, Willems E, Fang J, Choi J, Zhang T, et al. (2016) An interaction proteomics survey of transcription factor binding at recurrent TERT promoter mutations. Proteomics 16(3): 417-426.
-
Tzivion G, Dobson M, Ramakrishnan G (2011) FoxO transcription factors; Regulation by AKT and 14-3-3 proteins. Biochimica et Biophysica Acta (BBA)-Molecular Cell Research 1813(11): 1938-1945.
-
Haindl M, Holler E (2005) Use of the giant multinucleate plasmodium of Physarum polycephalum to study RNA interference in the myxomycete. Analytical biochemistry 342(2): 194-199.
-
Bénard M, Lagnel C, Pallotta D, Pierron G (1996) Mapping of a replication origin within the promoter region of two unlinked, abundantly transcribed actin genes of Physarum polycephalum. Molecular and cellular biology 16(3): 968-976.
-
Liu YG, Whittier RF (1995) Thermal asymmetric interlaced PCR: automatable amplification and sequencing of insert end fragments from P1 and YAC clones for chromosome walking. Genomics 25(3): 674- 681.
-
Sadon N, Delers A, Jarman RG, Klungthong C, Nisalak A, et al. (2008) A new quantitative RT-PCR method for sensitive detection of dengue virus in serum samples. Journal of virological methods 153: 1-6.
-
Liu S, Cheng C, Lin Z, Zhang J, Li M, et al. (2009) Construction of transient expression system of micro- plasma mass of Physarum polycephalum. Chinese Journal of Biotechnology 25: 854-862.
-
Zhu K, Zhang J, Liu S (2011) Research Progress of Yeast Transcription Factor Gal4. Chinese Journal of Biotechnology 31: 81-85
-
Hellman LM, Fried MG (2007) Electrophoretic mobility shift assay (EMSA) for detecting protein nucleic acid interactions. Nature protocols 2(8): 1849-1861.
-
Siu FK, Lee LT, Chow BK (2008) Southwestern blotting in investigating transcriptional regulation. Nature protocols 3(1): 51-58.
-
Gietz RD, Schiestl RH, Willems AR, Woods RA (1995) Studies on the transformation of intact yeast cells by the LiAc/SS‐DNA/PEG procedure. Yeast 11: 355-360.
- Origin, Evolution, and Functional Impact of Short Insertion- Deletion Variants in Human Genomes: A Review
- Harnessing Molecular Glues for Next-Generation Vaccine, Cancer and Cardiovascular Disease Drug Development: A Comprehensive Review
- Lateral Cervical Epidermal Inclusion Cyst in a Paediatric Patient: A Rare Case Report
- Malarial Plasmodium Falciparum with Hepatitis B and C Virus Infections among Blood Donors in Ife Central Local Government Area, Ile Ife, Osun State, Nigeria
- Withanolides and Withaferin A- What’s next in Ashwagandha Research
- Designing of Dual Pulse Photoacoustic Tomography for Imaging of Drug-Response and Tumor Growth