Optimized Classification Model for Biomedical Data Analysis
In recent years, medical data analysis has become a well-known research topic in healthcare in recent years. Smart healthcare will use a new generation of information technologies, like artificial intelligence, the Internet of Things, cloud computing, and big data, to transform the conventional medical system in an all-around way, making healthcare highly effective, more personalized, and more convenient to support healthcare practitioners in their decision-making. Due to the huge amount of medical data, appropriate clustering methods have been proven useful to implement an efficient medical data classification process. In addition, the development of machine learning models effectively aids the classification process. With this motivation, this paper focuses on a unit-wide search algorithm with an optimal support vector machine model for medical data analysis. The purpose of the proposed model is to classify health data using clustering and classification models. In addition, the proposed technique includes a clustering method for medical data, which helps to improve the classification performance. In addition, the model used examines accumulated medical data to perform the classification process. In addition, an optimization algorithm is used to improve the classification results of medical data. Extensive benchmarking and a wide range of simulations can highlight the promising performance of the research technique.
Introduction
Artificial intelligence for medical use is an exciting and important area of research. Usually, the doctor gathers his information based on confirmed diagnoses and patient symptoms [1]. The predictive value of symptoms in diagnosing a person and the accuracy of the disease depends largely on the knowledge of the doctors. Since medical therapy and medical knowledge evolve rapidly according to, for example, the availability of new drugs and the occurrence of new diseases, it is difficult for the doctor to manage current developments and knowledge in medical institutions [2].
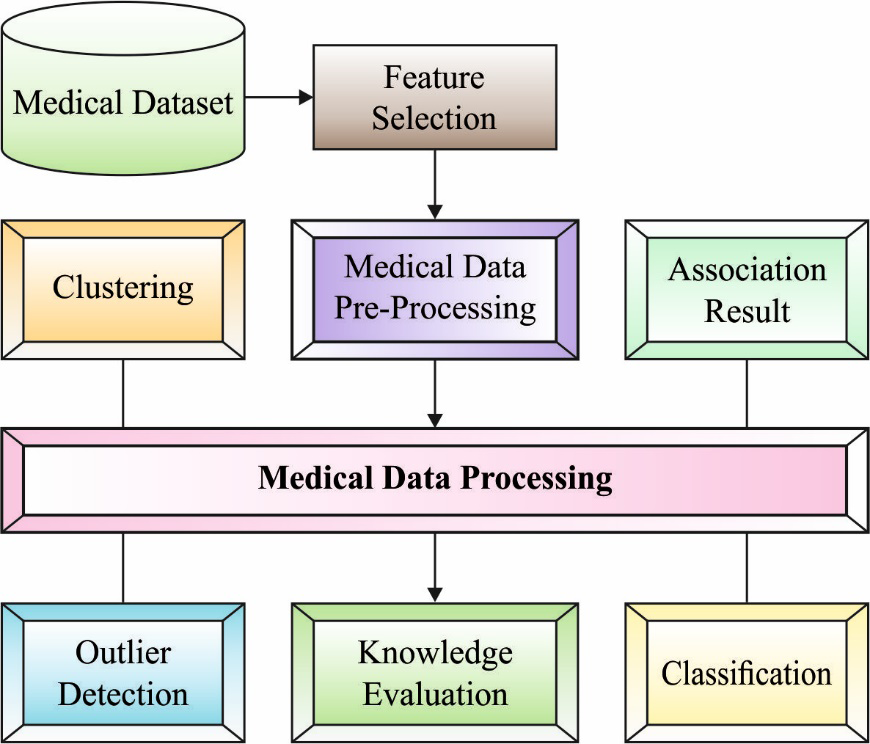
Alternatively, with the advent of computer technology, it is now relatively easy to store and retrieve much data digitally, such as in specialized electronic patient records. Essentially a computerized medication decision support system (DSS). This becomes a useful method to help doctors identify specific patients accurately and quickly. However, some issues should be addressed beforehand and an effective medical DSS should be developed and implemented, which includes decision making under imprecision and uncertainty [3]. While medical expertise and knowledge are important from measuring patient health to diagnoses, advances in machine learning methods have opened the way for doctors to use computational intelligence in DSS [4]. Data normalization is applied to pre-process the input data at the initial stage. Next, the HBO algorithm is used in the second stage to choose an optimal set of features from the healthcare data and the DQNN model is exploited for healthcare data classification [5, 6, 7, 8, 9]. Figure 1 shows the medical imaging process.
Data mining (DM) and machine learning (ML) often use similar methods and have considerable overlap, but the prediction-based ML method based on a known feature learned from the trained data [10] focuses on identifying previously unknowns in DM methods. property in the data. The DM method uses the ML method for different purposes; meanwhile, ML uses the DM method as an unsupervised learning or pre-processing step to improve the performance of the learning model [11]. The ML algorithm was developed from the ground up and is used to analyze pharmaceutical data. Clustering techniques play an important role in DM and ML methods. The domestic researcher mainly focuses on the following two features: (a) the clustering model improves the clustering efficiency, and (b) the clustering method dynamically determines the number of cluster centers [12]. A genetic algorithm based on a dynamic clustering model; The main concept of the algorithm is to effectively solve the sensitivity of the value group of the primary state, in the mutation reaching the optimal clustering center, the distribution strategy of the regions of maximum characteristic values and two stages and the dynamic selection model were used. Cluster analysis is a type of unsupervised pattern recognition method [13]. The clustering task divides the unlabeled pattern into several subsets that must be matched under some conditions, which have more matching cluster centers, and different cases must be separated into different groups. Therefore, it is called unsupervised classification. Cluster analysis has been widely used in image processing, DM, radar target detection, target recognition and the rest [14]. This research presents a fuzzy clustering Approach based on breadth-forward search algorithm (FCA-BFS) with an optimal support vector machine (OSVM) model called FCABFS-OSVM for medical data classification. The proposed FCABFS-OSVM technique incorporates the FCABFS technique for clustering medical data, which helps to improve the classification performance. In addition, the OSVM model examines accumulated medical data to perform the classification process. Archimedes Optimization Algorithm (AOA) is also used to change the parameters of SVM and improve the classification results of medical data. A wide range of simulations highlight the promising performance of the FCABFS-OSVM technique. Various techniques are at present, classification plays a very important role in medical information processing and biological data analysis [15, 16].
Literature Review
A better imputation technique known as IM-CBC was introduced by Yelipe, et al. [17]. The experiment is conducted on nine standard datasets, and the output of the IM-CBC imputation method is compared with outputs of ten C4.5 imputation models, KNN and SVM classifiers, as well as outputs of CBCC classifiers that use fuzzy Gaussian similarity and Euclidean distance models. On the basis of ontology and whale optimization, Karlekar and Gomathi [18] established a method for drug data classifier with SVM algorithm. First, the privacy-protected data is created by modifying the Kronecker product’s bat model, and then the ontology is constructed using the FS model. Then, by merging WOA and ontology with SVM and using ontology and WOA to choose potential kernel parameters, the OW-SVM and ontology model is shown.
The improvement of parameter tuning and clustering techniques significantly improves classification outcomes. Additionally, the outcomes of the classification of medical data using the SVM parameters are improved by using the Archimedes optimization method (AOA). To demonstrate the FCABFS-OSVM technique’s promising performance, numerous simulations are conducted. An exhaustive comparison research revealed that the FCABFS-OSVM technique produced better results than the most recent state-of-the-art methods [3].
A medical computer architecture built using deep autoencoder (AE) and energy spectral density (ESD) models was discussed by Karim et al. in [19]. The ESD process is integrated into a special deep sparse autoencoder (DSAE) as feature extraction in the method that is being presented. As a result, our proposed method may generate characteristics of greater quality than the conventional framework with a quick calculation time. To assist physicians in making better diagnoses, Le [20] suggests a fuzzy c-means clustering interval type 2 cerebellar model synovial neural network (FCM-IT2CMANN). In the approach that is being given, a pre-classification called the FCM model, and an original classification called IT2CMANN are combined. The deployment legislation to update the presented approach is derived through the use of the gradient calculation model.
Medical data from Kadam and Jadhav [21] is condensed using PCA. To establish the greatest possible separation between attributes, the subtraction dimension information is converted by increasing weight factors or scaled by WOA. As a result, the data is categorized and the information is raised to an identifier-distinguishable level, where the DBN system is modified to carry out the DL procedure.
The Proposed Model
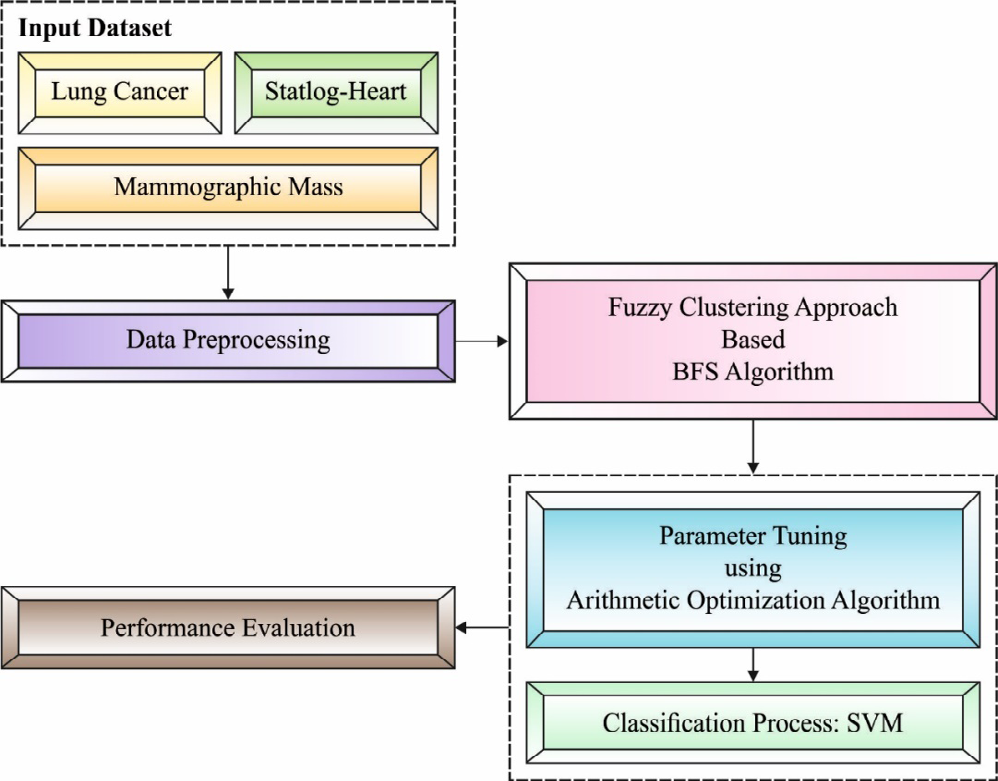
In this study, a novel FCABFS-OSVM technique was developed to classify health data using clustering and classification models. The proposed FCABFS-OSVM technique includes various sub-processes such as data processing, FCABFS-based clustering, SVM-based classification, and AOA-based parameter optimization. Figure 2 shows the general process of the FCABFS-OSVM technique [22, 23].
Technique Design for Classification Process
The FCABFS approach was initially created to divide up the medical data into different clusters. The weighted sum of squares of the distance between each datapoint and its corresponding cluster center is decreased by the traditional FCM method. Although each feature may have a different impact on clustering, FCM believes they all have a similar impact. However, there is still the grouping of unrelated and sample noise features. Due to their separation from other objects, a small number of data items in a large sample may have a significant impact on the clustering results. However, practically all clustering models and feature weighting extensions take into account the equal weight of each sample at the moment of clustering. The technique is hence sensitive to noise.
Design of Optimal SVM based Classification Process
The following optimized job is resolved with a better separation margin by the linear SVM. The agent’s upgrading process was then carried out with the help of the AOA operator. Algorithm 1 illustrates the key AOA phases in a nutshell.
Algorithm 1: Steps of AOA
Input: The parameter of AOA like dynamic exploitation parameter (), control function number of agents (N), and entire amount of iterations Create the primary value to the agent while t<Mt do Estimate the FF to all the agents. Define the optimum agent Upgrade the and utilizing Eq. (12) & (14) correspondingly for i=1 to do for j=1 to do Upgrade the value of , and if r1>MOA then Exploration stage Utilize Eq. (13) for updating the else Exploitation stage Utilize Eq. (15) for updating the end if end for end for t=t+1 end while Output the optimum agents (feature subset) .
Experimental Validation
Three datasets—lung cancer, mammographic mass, and Statlog-heart dataset—are used to test the proposed model [3]. The specifics of the dataset description are shown in Table 1. Table 2 examines the FCABFS-OSVM technique’s classifier result analysis for various epochs on the lung cancer dataset. With 100 epochs, the FCABFS-OSVM technique has gained TPR, TNR, accuracy, error, and F-measure of 83.08%, 80.88%, 87.04%, 12.96%, and 83.35% respectively. Along with that, with 300 epochs, the FCABFS-OSVM method has received TPR, TNR, accuracy, error, and F-measure of 82.63%, 85.23%, 86.92%, 13.08%, and 85.66% correspondingly. in addition, with 500 epochs, the FCABFS-OSVM technique has gained TPR, TNR, accuracy, error, and F-measure of 83.38%, 82.36%, 87.22%, 12.78%, and 86.78% respectively.
| No. of samples | No. of attributes | No. of classes | |
|---|---|---|---|
| Lung cancer | 32 | 56 | 2 |
| Mammographic mass | 961 | 6 | 1 |
| Statlog-Heart | 270 | 13 | 1 |
Table 1: Dataset description.
| TPR | TNR | Accuracy | Error | F-measure | |
|---|---|---|---|---|---|
| Epoch-100 | 83.08 | 80.88 | 87.04 | 12.96 | 83.35 |
| Epoch-200 | 82.4 | 82.82 | 87.25 | 12.75 | 85.11 |
| Epoch-300 | 82.63 | 85.23 | 86.92 | 13.08 | 85.66 |
| Epoch-400 | 82.24 | 85.7 | 86.08 | 13.92 | 85.79 |
| Epoch-500 | 83.38 | 82.36 | 87.22 | 12.78 | 86.78 |
| Average | 82.75 | 83.4 | 86.9 | 13.1 | 85.34 |
Table 2: Result analysis of FCABFS-OSVM technique with different epochs under lung cancer dataset.
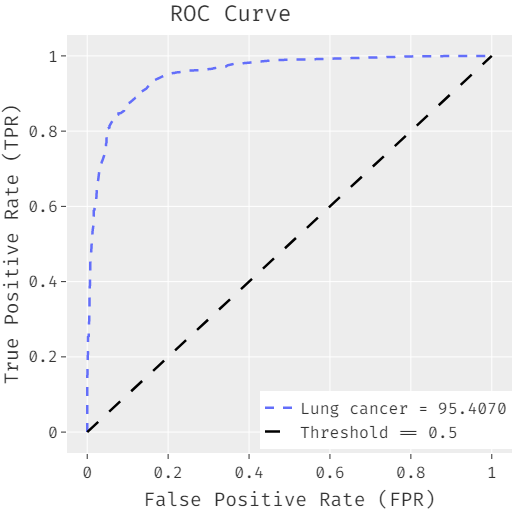
The FCABFS-OSVM system’s ROC analysis for lung cancer data sets is shown in Figure 3. With a high ROC of 95.4070, the FCABFS-OSVM approach was shown to have enhanced results. Table 3 looks at the FCABFS-OSVM system’s classifier analysis for the Mammographic mass dataset using various epochs. The FCABFS-OSVM method’s TPR, TNR, accuracy, error, and F-measure were, respectively, 86.59%, 85.82%,
89.41%, 10.59%, and 86.69% after 100 epochs. The FCABFS- OSVM approach also achieved TPR, TNR, accuracy, error, and F-measure of 84.15%, 87.58%, 88.51%, 11.49%, and 86.45%, respectively, with 300 epochs. The FCABFS-OSVM approach also has archival TPR, TNR, accuracy, error, and F-measure of 86.66%, 86.81%, 86.26%, 13.74%, and 88.16%, respectively, with 500 epochs.
| No. of Epochs | TPR | TNR | Accuracy | Error | F-measure |
|---|---|---|---|---|---|
| Epoch-100 | 86.59 | 85.82 | 89.41 | 10.59 | 86.69 |
| Epoch-200 | 85.35 | 84.3 | 88.91 | 11.09 | 86.06 |
| Epoch-300 | 84.15 | 87.58 | 88.51 | 11.49 | 86.45 |
| Epoch-400 | 88.69 | 87.46 | 89.75 | 10.25 | 87.7 |
| Epoch-500 | 86.66 | 86.81 | 86.26 | 13.74 | 88.16 |
| Average | 86.29 | 86.39 | 88.57 | 11.43 | 87.01 |
Table 3: Result analysis of FCABFS-OSVM technique with different epochs under Mammographic mass dataset.
Figure 4 displays the ROC analysis of the FCABFS-OSVM system using the mammographic mass dataset. The FCABFS- OSVM technique was demonstrated to have improved results with a high ROC of 94.8630.
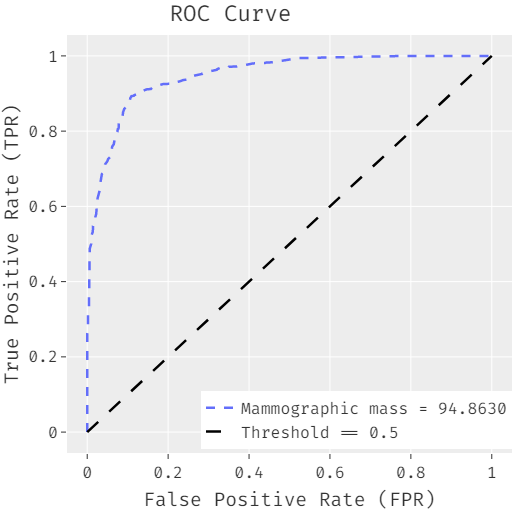
Table 4 explores the classifier analysis of the FCABFS- OSVM model under discrete epochs on the Statlog-Heart dataset. With 100 epochs, the FCABFS-OSVM approach has attained TPR, TNR, accuracy, error, and F-measure of 89.37%, 90.38%, 89.41%, 10.59%, and 93.21% correspondingly. Along with that, with 300 epochs, the FCABFS-OSVM system has achieved TPR, TNR, accuracy, error, and F-measure of 90.40%, 90.87%, 89.48%, 10.52%, and 91.35% correspondingly. In addition, with 500 epochs, the FCABFS- OSVM system has obtained TPR, TNR, accuracy, error, and F-measure of 91.54%, 90.64%, 91.12%, 8.88%, and 92.79% correspondingly Figure 5.
| TPR | TNR | Accuracy | Error | F-measure | |
|---|---|---|---|---|---|
| Epoch-100 | 89.37 | 90.38 | 89.41 | 10.59 | 93.21 |
| Epoch-200 | 88.64 | 90.71 | 89.87 | 10.13 | 91.23 |
| Epoch-300 | 90.4 | 90.87 | 89.48 | 10.52 | 91.35 |
| Epoch-400 | 89.66 | 92.88 | 90.64 | 9.36 | 91.72 |
| Epoch-500 | 91.54 | 90.64 | 91.12 | 8.88 | 92.79 |
| Average | 89.92 | 91.1 | 90.1 | 9.9 | 92.06 |
Table 4: Result analysis of FCABFS-OSVM technique with different epochs under Statlog-Heart dataset.
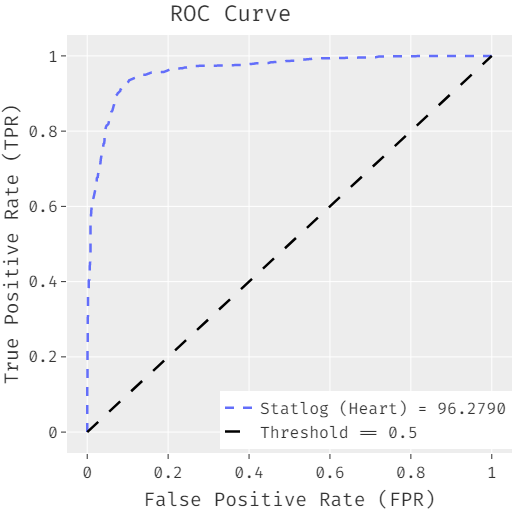
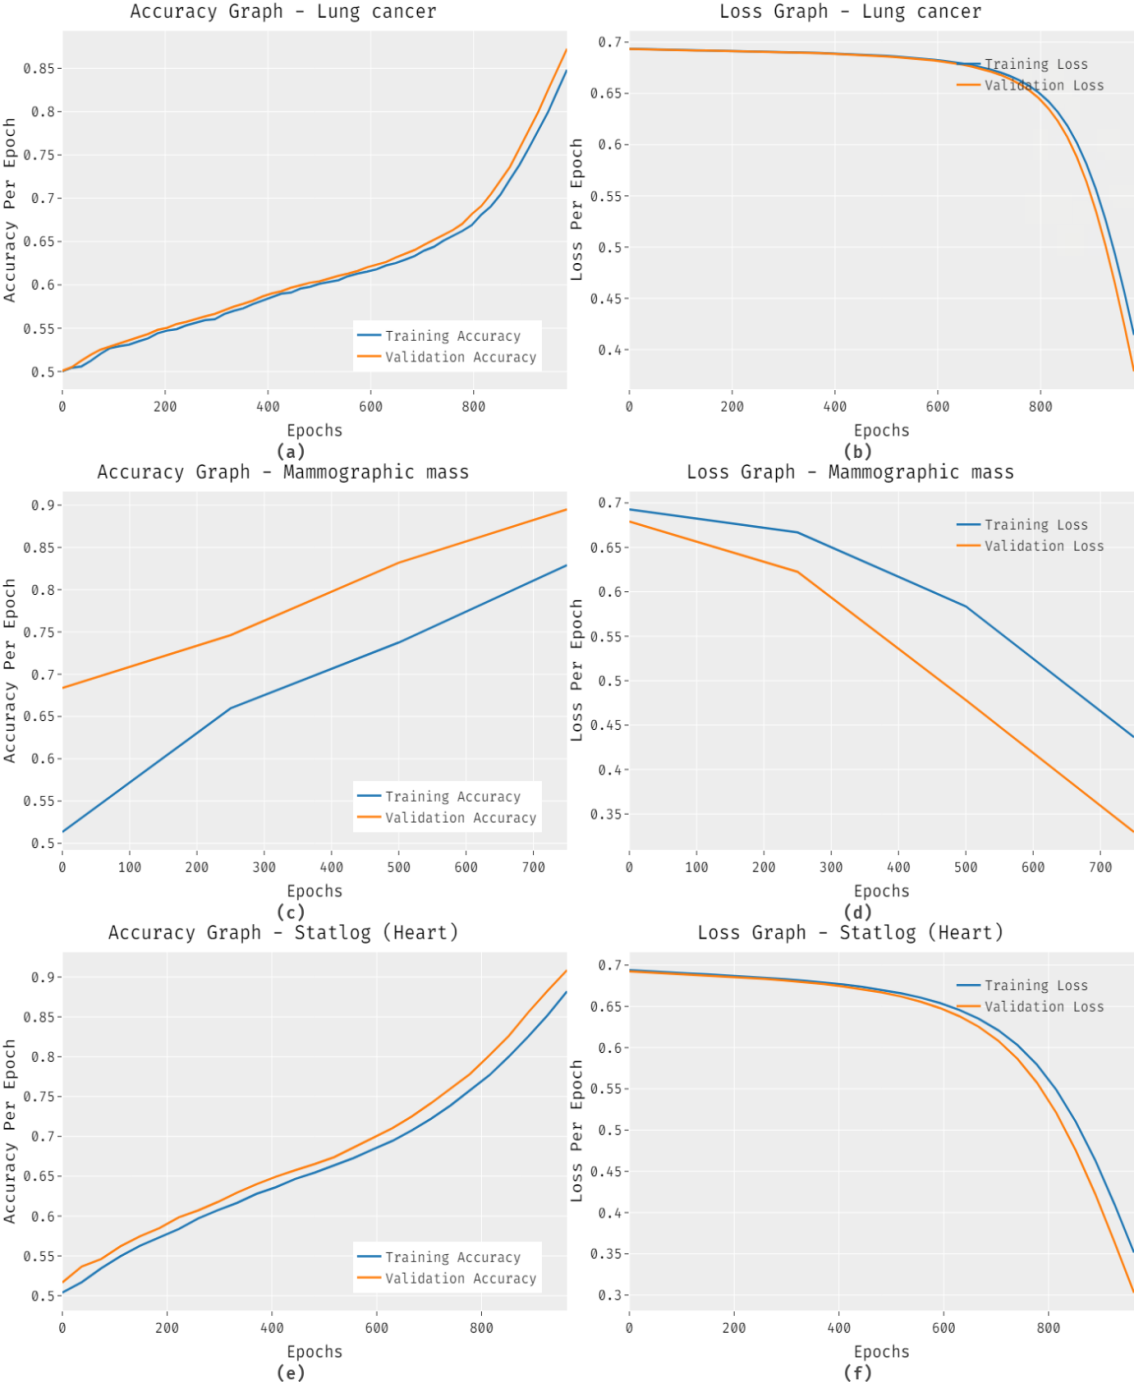
The FCABFS-OSVM system’s accuracy and loss graph analysis for the test data set is shown in Figure 6. The outcome demonstrates that when the amount of epochs increases, accuracy values tend to rise and loss values tend to fall. On the testing datasets, it is also seen that the training loss is smaller and the validation accuracy is higher.
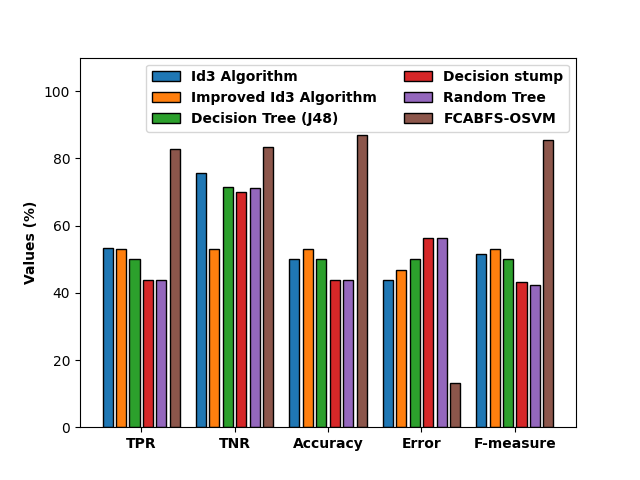
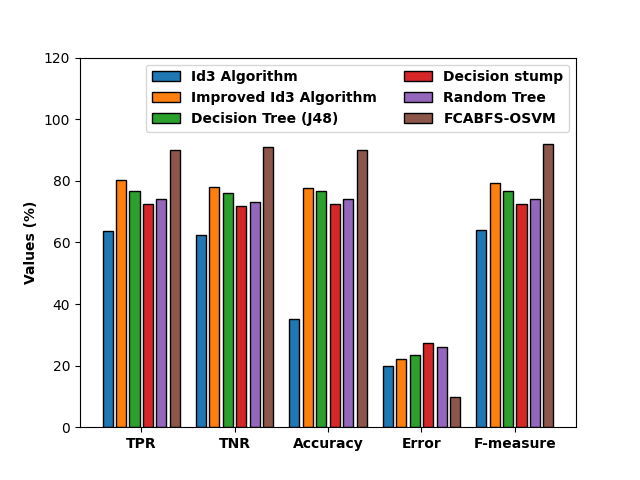
Figure 7 compares the FCABFS-OSVM strategy to various methods in terms of classification results analysis [3]. According to the experimental findings, the Decision Stump (DS) and Random Tree (RT) techniques produce worse classification outcomes. Accordingly, the classification performance of the DT (J48) and RT algorithms has been marginally enhanced. The FCABFS-OSVM technique has achieved maximum outcome with the TPR of 82.75%, TNR of 83.40%, accuracy of 86.90%, error of 13.10%, and F-measure of 85.34%, whereas the Improved ID3 technique has produced competitive results.
View the FCABFS-OSVM method’s comparative study with the alternative algorithms in Figure 8. According to the experiment’s findings, the DS and RT techniques produced poor categorization outcomes. This has led to enhanced and closer classification efficiency for the DT (J48) and RT models.
The FCABFS-OSVM algorithm has achieved maximum results with the TPR of 86.29%, TNR of 86.39%, accuracy of 88.57%, error of 11.43%, and F-measure of 87.01%, despite the Improved ID3 system producing competitive results.
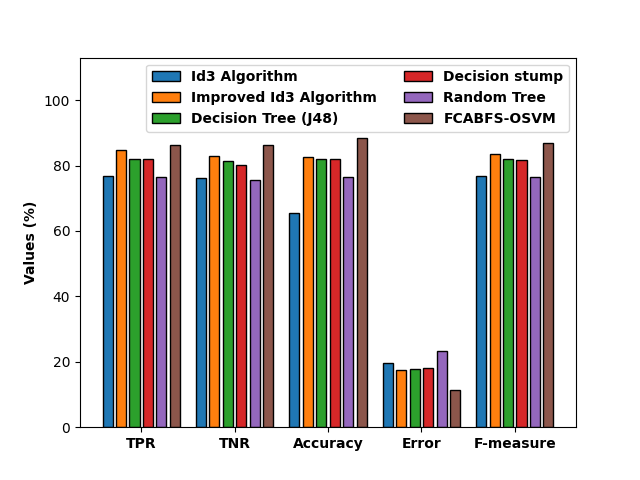
Figure 9 compares the FCABFS-OSVM approach to other algorithms in a comparative analysis. According to the experiment’s findings, the DS and RT techniques produced poor categorization results. This has led to enhanced and closer classification efficiency for the DT (J48) and RT approaches. The FCABFS-OSVM strategy has achieved the best results, with TPR of 89.92%, TNR of 91.10%, accuracy of 90.10%, error of 9.90%, and F-measure of 92.06%, while the Improved ID3 technique has produced results that are competitive.
Conclusion
Using clustering and classification models, the healthcare data in this study was categorized using a unique FCABFS-OSVM technique. The proposed FCABFS-OSVM technique includes a number of subprocesses, including data preparation, clustering based on FCABFS, classification based on SVM, and parameter optimization based on AOA. The improvement of parameter tuning and clustering techniques significantly improves classification outcomes. Additionally, the outcomes of the classification of medical data using the SVM parameters are improved by using the Archimedes optimization method [3]. To demonstrate the FCABFS-OSVM technique’s promising performance, numerous simulations are conducted. An exhaustive comparison of research revealed that the FCABFS-OSVM technique produced better results than the most recent state-of-the-art methods. Future feature selection approaches can be developed to improve classifier performance.
References
-
Mohapatra P, Chakravarty S, Dash PK (2015) An improved cuckoo search based extreme learning machine for medical data classification. Swarm and Evolutionary Computation 24: 25-49.
-
Fan CY, Chang PC, Lin JJ, Hsieh JC (2011) A hybrid model combining case-based reasoning and fuzzy decision tree for medical data classification. Applied Soft Computing 11(1): 632-644.
-
Ragab M, Hamed D (2022) Fuzzy Logic with Archimedes Optimization Based Biomedical Data Classification Model. CMC-COMPUTERS MATERIALS & CONTINUA 72(2): 4185-4200.
-
Alam Z, Rahman MS, Rahman MS (2019) A Random Forest based predictor for medical data classification using feature ranking. Informatics in Medicine Unlocked 15: 100180.
-
Katib, Ragab M (2023) Heap Based Optimization with Deep Quantum Neural Network Based Decision Making on Smart Healthcare Applications. Computer Systems Science and Engineering 46(3): 3749-3765.
-
Ragab M (2022) Spider Monkey Optimization with Statistical Analysis for Robust Rainfall Prediction. CMC- Computers Materials & Continua 72(2): 4143-4155.
-
Abdullah S, Ragab M (2023) Tunicate swarm algorithm with deep convolutional neural network-driven colorectal cancer classification from histopathological imaging data. Electronic Research Archive 31(5): 2793- 2812.
-
Ragab M (2023) Leveraging mayfly optimization with deep learning for secure remote sensing scene image classification. Computers and Electrical Engineering 108: 108672.
-
Fakieh B, Ragab M (2022) Automated COVID-19 Classification Using Heap-Based Optimization with the Deep Transfer Learning Model. Computational Intelligence and Neuroscience.
-
Nguyen T, Khosravi A, Creighton D, Nahavandi S (2015) Medical data classification using interval type-2 fuzzy logic system and wavelets. Applied Soft Computing 30: 812-822.
-
Tang R, Zhang X (2020) CART Decision Tree Combined with Boruta Feature Selection for Medical Data Classification. 2020 5th IEEE International Conference on Big Data Analytics (ICBDA) pp. 80-84.
-
Sudha V, Girijamma HA (2017) Novel clustering of bigger and complex medical data by enhanced fuzzy logic structure. 2017 International Conference on Circuits, Controls, and Communications (CCUBE) pp: 131-135.
-
Abd D, Alwan JK, Ibrahim M, Naeem MB (2017) The utilisation of machine learning approaches for medical data classification and personal care system management for sickle cell disease. 2017 Annual Conference on New Trends in Information & Communications Technology Applications (NTICT), Baghdad, Iraq pp: 213-218.
-
de Lima MD, de Oliveira Roque e Lima J, Barbosa RM (2020) Medical data set classification using a new feature selection algorithm combined with twin- bounded support vector machine. Med Biol Eng Comput 58(3): 519-528.
-
Ragab M, Bahaddad AA (2022) Improved harmony search with optimal deep learning enabled classification model. CMC-Computers Materials & Continua 73(1): 1783-1797.
-
Mansouri AR, Ragab M (2023) Equilibrium Optimization Algorithm with Ensemble Learning Based Cervical Precancerous Lesion Classification Model. Healthcare 11(1): 55.
-
Yelipe U, Porika S, Golla M (2018) An efficient approach for imputation and classification of medical data values using class-based clustering of medical records. Computers & Electrical Engineering 66: 487-504.
-
Karlekar NP, Gomathi N (2018) OW-SVM: Ontology and whale optimization-based support vector machine for privacy-preserved medical data classification in cloud. Int J Commun Syst 31(12): e3700.
-
Karim AM, Güzel MS, Tolun MR, Kaya H, Çelebi F (2019) A new framework using deep auto-encoder and energy spectral density for medical waveform data classification and processing. Biocybernetics and Biomedical Engineering 39(1): 148-159.
-
Le TL (2019) Fuzzy C-Means Clustering Interval Type- 2 Cerebellar Model Articulation Neural Network for Medical Data Classification. IEEE Access 7: 20967-20973.
-
Kadam VJ, Jadhav SM (2020) Optimal weighted feature vector and deep belief network for medical data classification. Int J Wavelets Multiresolut Inf Process 18(2): 2050006.
-
Zhang Y, Zhai LL, Shahbaz M (2019) A Novel Fuzzy Clustering Approach Based on Breadth-first Search Algorithm. Journal of Computers 30(3): 162-175.
-
Cortes C, Vapnik V (1995) Support-vector networks. Mach Learn 20(3): 273-297.
- Origin, Evolution, and Functional Impact of Short Insertion- Deletion Variants in Human Genomes: A Review
- Harnessing Molecular Glues for Next-Generation Vaccine, Cancer and Cardiovascular Disease Drug Development: A Comprehensive Review
- Lateral Cervical Epidermal Inclusion Cyst in a Paediatric Patient: A Rare Case Report
- Malarial Plasmodium Falciparum with Hepatitis B and C Virus Infections among Blood Donors in Ife Central Local Government Area, Ile Ife, Osun State, Nigeria
- Withanolides and Withaferin A- What’s next in Ashwagandha Research
- Designing of Dual Pulse Photoacoustic Tomography for Imaging of Drug-Response and Tumor Growth