Estimation of Infected Area and its Severity in Chest X-ray Images of Tuberculosis Patients
Despite much research, tuberculosis (TB) remains a significant health burden in both developing and advanced countries. Diagnosis of tuberculosis still relies on chest X-ray images which are interpreted qualitatively by radiologist. Hence, much pathological conditions useful for formulating a treatment plan elude detection. This work aims to develop quantitative methods for determining the extent of tuberculosis infection, and quantify the relative proportion of moderate and severe infections in different parts of the lung. Using MATLAB software developed for this study, quantitative analysis of 15 TB infected and 6 latent TB cases reveals higher light intensity in TB infected and latent TB cases relative to normal lung. More importantly, analysis of infected area for pixel intensity > 35 indicates TB infection spread throughout the lung and is considered a systemic disease. In cases of pixel intensity > 90 (moderate to severe), and pixel intensity > 150 (severe) infected area, both TB infected and latent TB presents with these infections to a significant degree, and less burden for latent TB cases. Overall, the top right lung persistently presents with less moderate and severe TB infections, and is the region that can be resuscitated in severe TB pneumonia. Additionally, this work also reveals latent TB as an aggressive lung disease likely kept in check by a relatively strong immune system that prevented whole body physiological collapse.
Abbreviations
TB: Tuberculosis; qPCR: Quantitative Polymerase Chain Reaction; CNN: Convolution Neural Network.
Introduction
Lung infection is a common aliment especially in the elderly and immune compromised. Typically caused by bacteria, it can be treated with antibiotics, and the lung should clear after treatment. However, there remains significant case load in lung pneumonia cases associated with Mycobacterium tuberculosis infection [1]. Specifically, in 2022, World Health Organisation reports 10.6 million cases of tuberculosis (TB) infections worldwide.
Mycobacterium tuberculosis is a small, round, mycoplasma that lacks a cell wall typical of other bacterial species such as Escherichia coli or Bacillus subtilis [2, 3]. Clinically, M. tuberculosis infections can be treated by a couple of antibiotics, and these drugs remain effective generally. However, there is a rise of multi drug resistant and extremely drug resistant TB bacterium that evades and is recalcitrant to antibiotic treatment [4, 5]. This then set the stage of what is clinically observed as cyclic TB infections when the bacterium population in the patient is not completely cleared, and the residual persister cells sow a secondary infection, particularly when the immune system of the patient is down regulated.
In general, M. tuberculosis infections manifest in different clinically detectable symptoms with similarities to other bacterial infections of the lung and respiratory system. Hence, there is a strong possibility of misdiagnosis, especially when modern molecular microbial identification techniques such as quantitative polymerase chain reaction (qPCR) are not employed. Misdiagnosis then set the stage for cluster formation and an emerging epidemic because TB infection is infectious, and the infection is not easy to eradicate at the patient level [6].
Another facet that potentiates the misdiagnosis of TB infections as those caused by other microbial species is the complex, varied, and evolving life cycle of the bacterium, M. tuberculosis [3, 7, 8]. Yes, the bacterium evolves and adapts, and the clinical presentation of TB in different regions of the world is different due to unknown reasons. One possibility is diet and the energy state of the patient where higher energy state may not necessarily be preferential for M. tuberculosis to grow to high cell density populations.
TB relapse due to latent TB is another emerging clinical problem, particularly in advanced countries and high- income developing countries [9, 10, 11, 12]. Typically, survey of the patient’s diet and income profile does not suggest a TB aetiological agent at the first responder level. Other clinical tools utilized could also miss a diagnostic opportunity at TB infection, where the lung infection is diagnosed as one of several pathogens such as Pseudomonas aeruginosa or Klebsiella pneumoniae which is of higher circulation in the population or more “hotly” researched in the scientific literature. Inability to properly diagnose a TB infection raises severe consequences for both the patient and the community as the slow growing M. tuberculosis could not be effectively contained with current culture-based detection methods. In essence, TB may be spreading in the community in a silent hidden epidemic.
Chest X-ray remains the frontline diagnosis method for TB. But, this method is not fool proof, and relies on the complementary M. tuberculosis agar culture test, as well as molecular qPCR technique for confirmation. Hence, the chest X-ray of TB patients could only tell us so much about the patient’s condition, at least at the superficial level. This comes about due to the qualitative nature of current chest X-ray diagnosis, which loses much diagnostic opportunities, and did not fully utilize the clinical picture captured of the patient’s lungs [13]. Specifically, currently we do not quantify, on a regular and institutional basis, the percent area of lung infected with TB. Next, we do not know which part of the lung is most susceptible to TB infection. Finally, we also do not have a clear clinical conceptualisation or picture of how TB infection spreads in the lung to reach end-stage TB pneumonia, where last resort resuscitation methods may no longer work.
Currently, artificial intelligence methods are in vogue for chest X-ray image analysis and TB diagnosis [14, 15]. Different methodologies have been developed to aid this effort such as artificial neural network, convolution neural network (CNN), and deep learning [16, 17, 18]. One goal in this endeavour is the automatic screening of tuberculosis using chest X-ray images. Another is the use of CNN for automatic detection of TB cases from chest X-ray images. A key question for the implementation of AI techniques in automated TB case detection from chest X-ray image analysis is the concordance between AI detection and radiologists’ diagnosis [19, 20]. The limitation in current AI TB detection method is the yes/no decision making process where the threshold for detection appears to be a moving target in different studies and contexts. A new trend is to use a comprehensive framework integrating text and images to interpret chest X-ray images and reports to arrive at an automated TB detection [21].
This work proposes the use of quantitative image analysis to extract clinically useful and relevant pixel intensity information to quantify the percent area of lung infected by M. tuberculosis bacterium imaged in chest X-ray imaging. Next, the analysis also tries to dissect the severity of the infection in two main categories such as moderate to severe infection, and highly severe infection by counting the number of pixels whose intensity is above a certain threshold. Finally, a coarse but useful analysis method in aggregating the pixel intensity of all pixels in a region of interest, will tell us, with confidence, whether the patient has a TB infection. However, the technique is likely unable to discriminate between full blown TB infection, and latent TB infection.
Materials and Methods
Collation of Chest X-ray Images for the Study
Chest X-ray images of patients with tuberculosis and latent TB infection are downloaded from the Internet using a Google Chrome browser after a Google search with the following two keywords groups: (i) “chest X-ray images of tuberculosis patients”, and (ii) “chest X-ray images of latent TB infection”. The images were obtained after careful and judicious selection from the images collated in the “Images” tab of Google Search. Only images in upright position with little slanting of the chest are selected. Images with annotations such as arrows or false colours were not selected.
Development and use of Pixel Intensity Analysis MATLAB Software
MATLAB was selected as the programming language of this project because of its versatility and user-friendly syntax. In addition, the author of this project is familiar with MATLAB programming language. Overall, two main image analysis software were developed by the author for the image processing tasks in this project.
The first image analysis software is intended to aggregate the pixel intensity of all pixels within a user-defined region of interest. Specifically, the software will go through and sum up the pixel intensity of all pixels in a row, and following this, add up the row level intensity of all the rows in the region of interest. Doing it this way allows the total pixel intensity of the region of interest such as the bottom left lung to be obtained for comparison with other regions of the lung.
The second main image analysis software is intended to obtain the percent surface area of the lung with moderate to severe, and severe TB infection. Specifically, it takes the pixel intensity of every pixel in the region of interest, compare it with a user defined threshold, and if the pixel intensity crosses the threshold, the count of pixel with particular infection status will be increased by 1. Repeating this analysis for all the pixels in the region of interest will register the percent area of the lung with a specific infection status. Threshold set are 35, 90 and 150, where 90 is for moderate to severe infection, and 150 is for severe infection.
All images collated for this project including the normal chest, TB infected chest, and latent TB images were analyzed by the above two in-house MATLAB software written by me. The source codes for the MATLAB software are in the Appendix of this report.
Extraction of Data from Chest X-ray Images Analysis
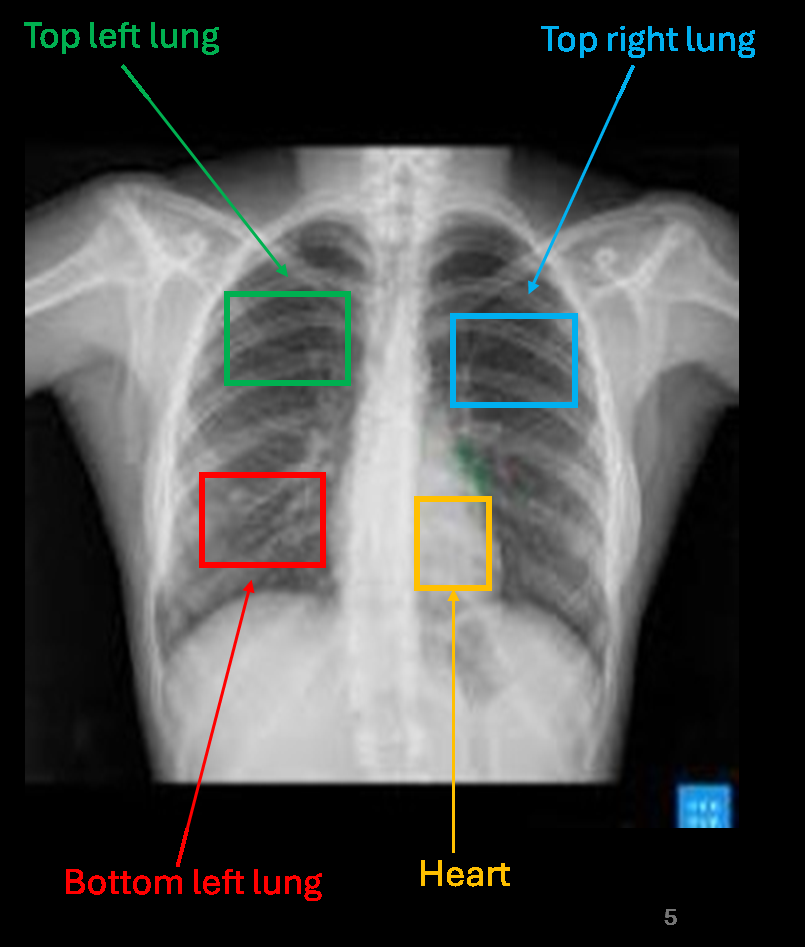
Four regions of interest were defined in this project for the left and right lung: They are the bottom left lung, top left lung, top right lung, and heart (Figure 1). The imaging parameters and total pixel number (also known as surface area) are as listed in Table 1 below.
| Section of Lung | Bottom Left Lung | Top Left Lung | Top Right Lung | Heart |
|---|---|---|---|---|
| Row coordinates | 100 to 140 | 50 to 80 | 60 to 100 | 120 to 160 |
| Column coordinates | 60 to 125 | 80 to 130 | 180 to 240 | 130 to 180 |
| Total pixel number | 2706 | 1581 | 2501 |
Table 1: Imaging parameters for different lung sections in the chest X-ray images
The chest X-ray images were analyzed by the two MATLAB software that I developed, and the data is output into Excel files for data archive and storage. The obtained data was tabulated and different data visualisation techniques were used to dissect hidden signals from the data.
For aggregate pixel intensity analysis for specific regions of interest, the variability of the data is computed by the concept of average deviation, which is a measure of the average deviation of each reading with the mean value of the analysis. This is plotted as the variability bar in the column chart. Using this metric to measure patient level variability in light intensity of different lung regions is perhaps fairer compared to the standard error approach as the sample size of 15 (TB infection) and 6 (latent TB infection) is smaller than the 30 required to use a statistic based on the standard
Normal Chest X-ray Image
normal distribution.
Results
Collection of Chest X-ray Images
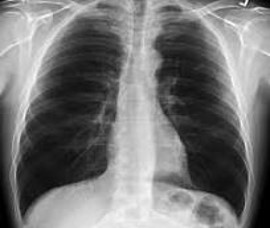
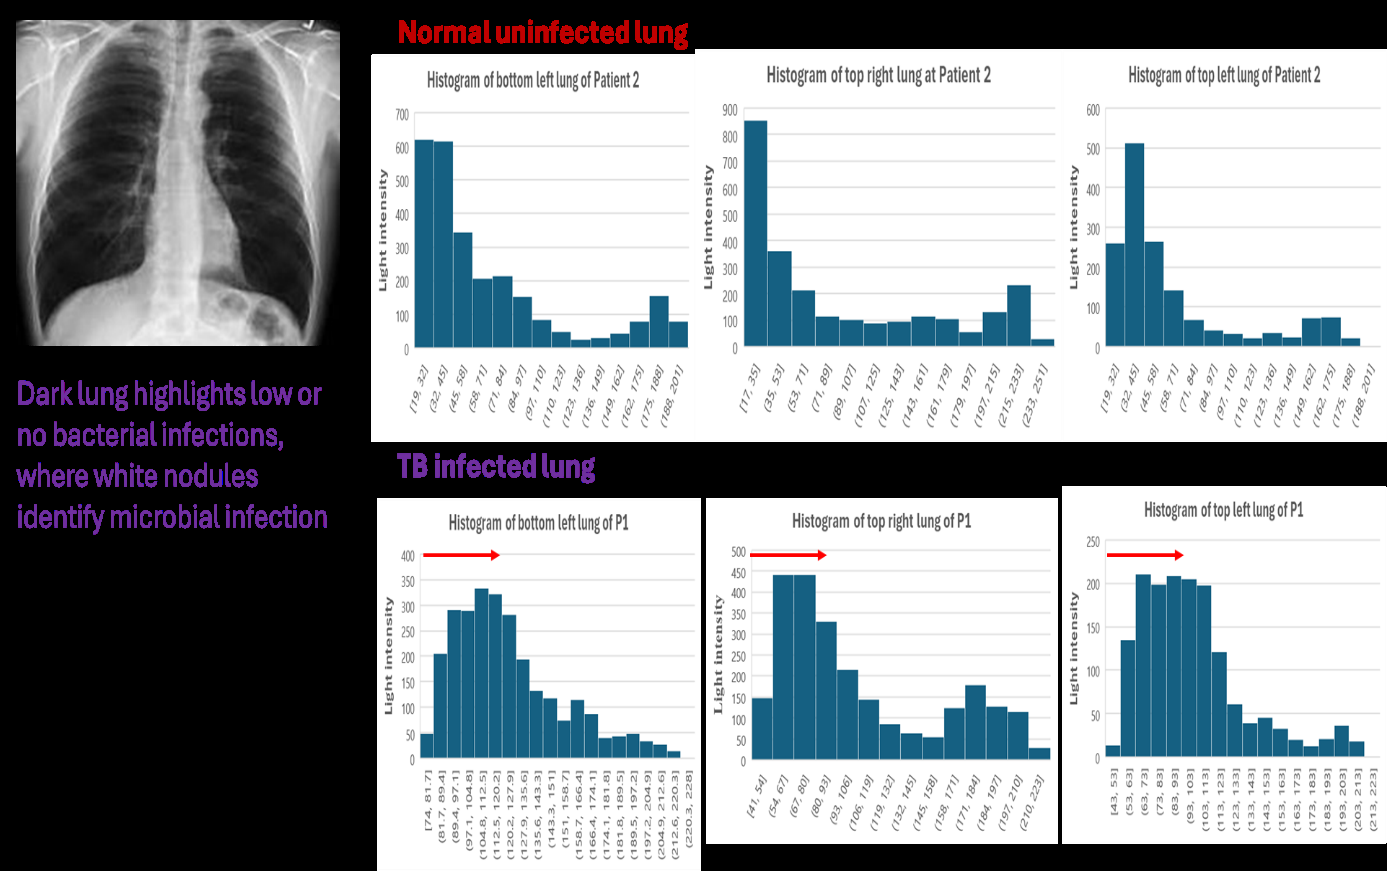
Figure 2 shows the chest X-ray image of normal lung without TB infection. Dark areas show no TB infection. In this research, I could only find one clean background image of the uninfected lung with no white nodules or patches. This shows the difficulty of finding patients no microbial infection of the lung. Hence, it can be postulated that in the modern city environment, there is a high chance of breathing in microbial contaminants in the air that results in low level lung infection.

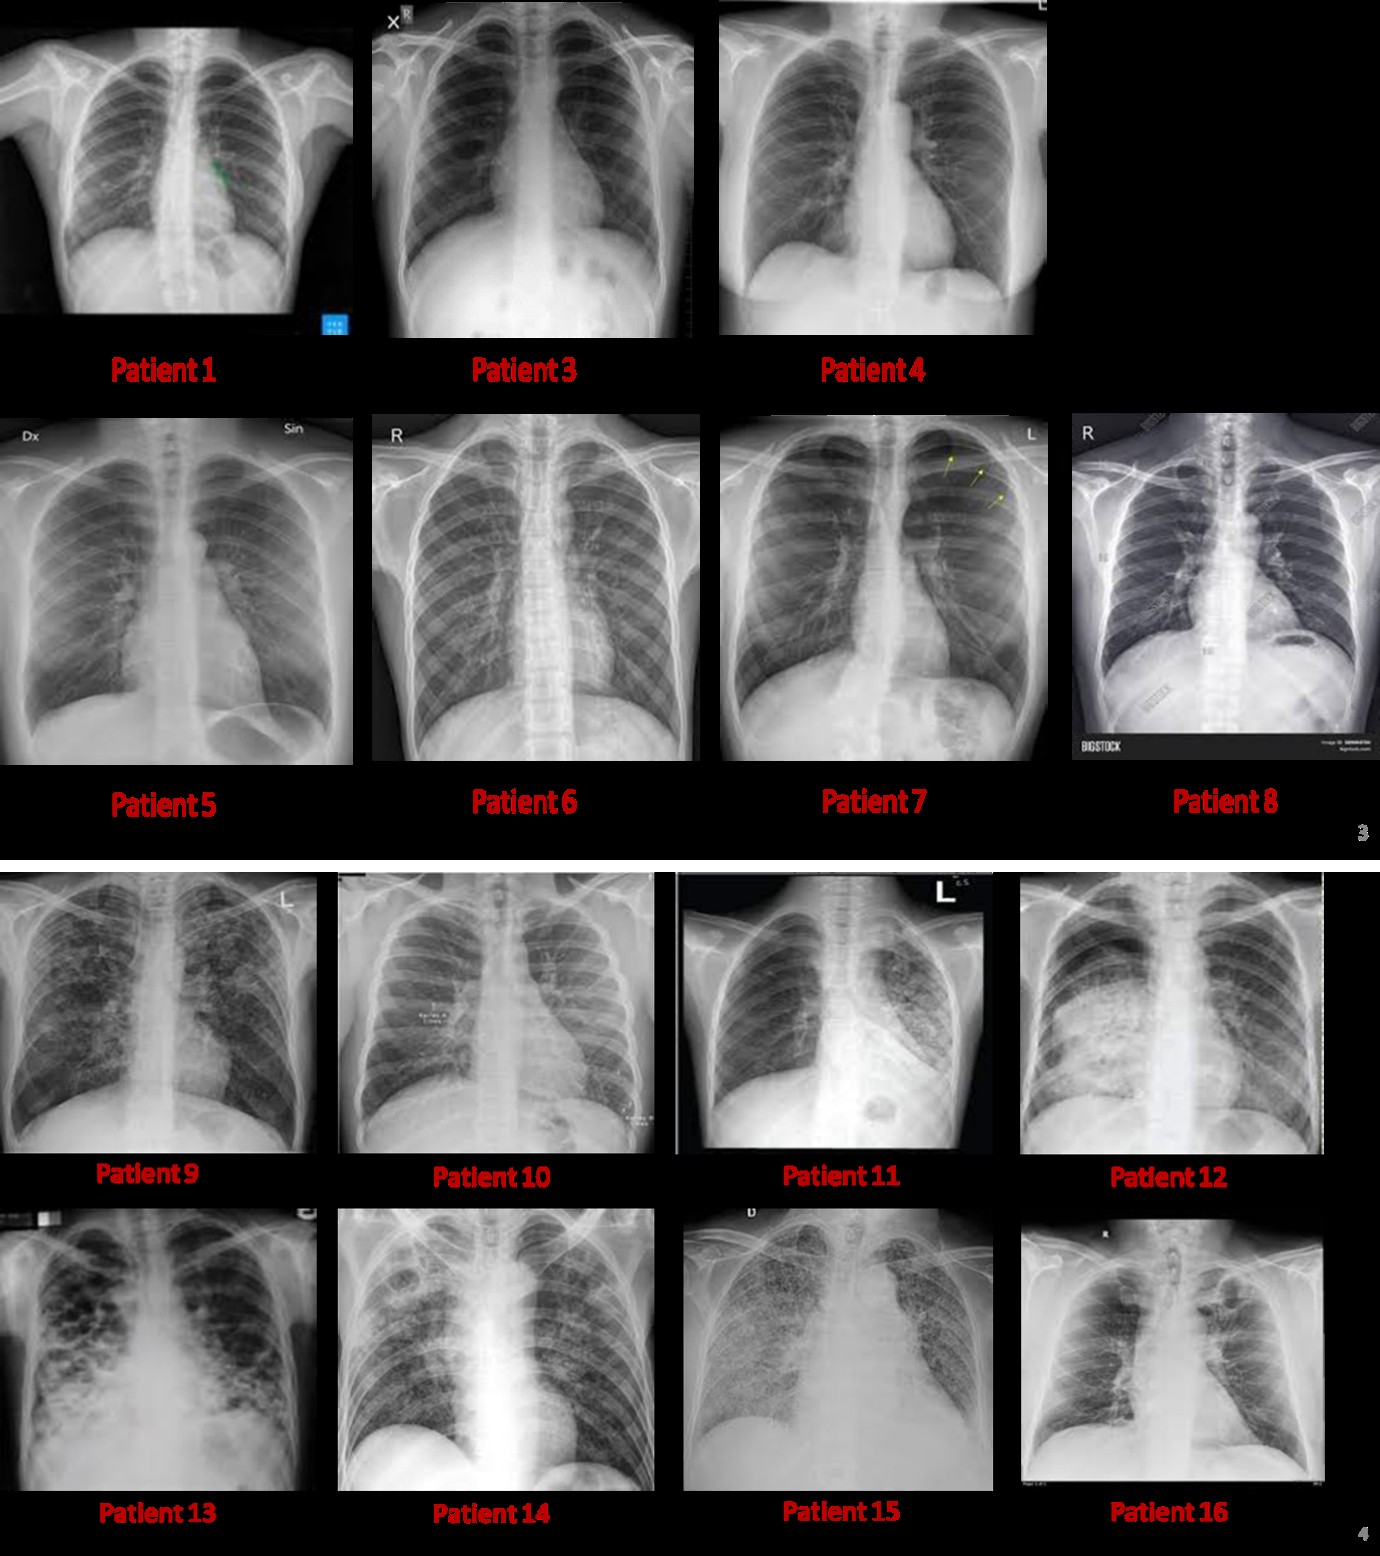
Figure 3 shows the chest X-ray images of TB infected patients. Firstly, in all patients, large parts of the left and right lung have been infected with M. tuberculosis resulting in white patches symptomatic of lung infection. In addition, infection is not restricted to specific parts of the lung, but is distributed quite widely across all surface area of the lung. However, the top right lung appears to be less affected.
TB Infected Chest X-ray Images
Normal Uninfected Lung
Latent TB Infection
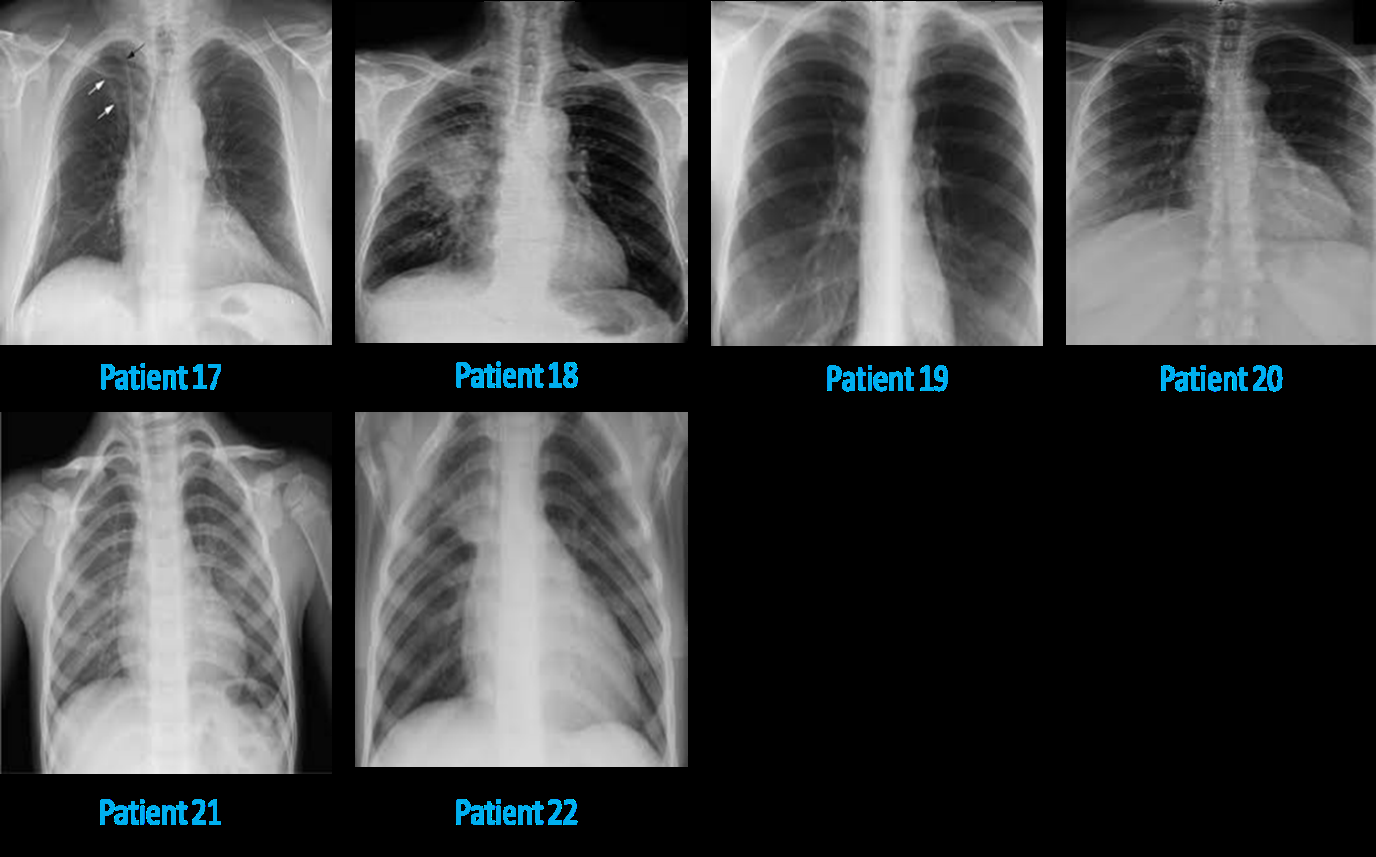
Figure 5: Chest X-ray images of latent TB lung patients showing clinically severe disease that does not correlate with the “latent” nature of the disease. Specifically, small white nodules can be seen dispersed throughout the lung volume in the left and right lung. More importantly, there is heart hypertrophy in many patients likely due to increased exertion of the heart to supply more blood to the deficient lung for gas exchange.
Background Calibration of Normal Chest X-ray
In the course of doing this research, there is significant difficulty in finding a clean background for calibrating the pixel intensity and distribution of a non-infected lung. Such a lung should present with dark areas in the lung, indicating of no microbial infection. This study could only find one clean background with no microbial infection, and it necessarily serve as the calibration standard for this project.
Specifically, Figure 6 shows the chest X-ray image of the normal lung, which presents with dark lungs and no white patches and nodules indicative of microbial infections. Histogram analysis of the pixel intensity distribution of this lung reveals no high intensity pixels which can be attributed to white patches of microbial infections. Rather, the pixel intensity is predominantly lower than about 35, which suggests that pixel intensity above 35 can be taken as signs of microbial infections of the lung.
Comparing the histograms of different parts of a normal lung with that of a TB infected lungs reveals that there is a distinct rightward shift in the histogram distribution of pixel intensity in TB infected lung in all lung regions investigated. This provides confirmatory evidence that white nodules and patches in a TB infected lung can be identified in a histogram analysis of pixel intensity via the presentation of high intensity pixels and a rightward shift of the histogram structure compared to those describing a non-infected lung.
Figure 7 plots the comparison of aggregate light intensity of different parts of lung in different lung disease conditions (normal, TB infected, and latent TB). Across the different lung regions, TB infected and latent TB lungs show higher aggregate light intensity compared to normal lung. This signifies severe microbial infection in the case of TB infection. In addition, TB infected lung show higher light intensity compared to latent TB infection. Such a case highlights that TB infection is a full-blown disease, while latent TB is a disease in progression. Similar light intensity of the heart in healthy and TB infected individuals show that the heart is not significantly affected by microbes.
Comparison of Overall Aggregate Pixel Intensity of Regions of Interest (ROI)
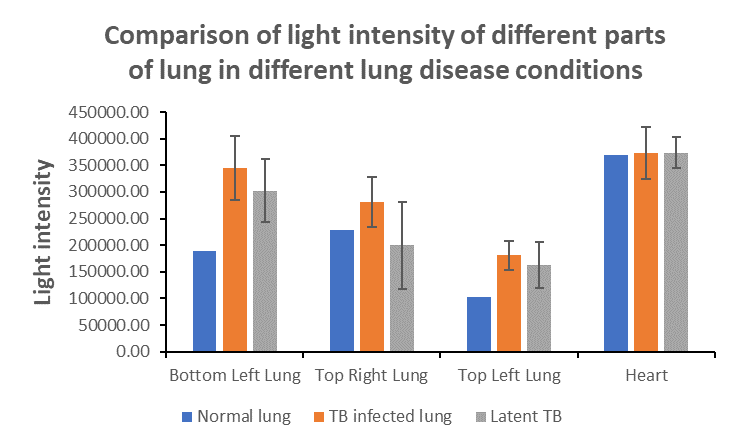
Figure 7: Comparison of aggregate light intensity of different parts of lung in different lung disease conditions. Results show that TB infected and latent TB lung exhibited higher aggregate light intensity compared to normal lung. Values plotted are average of readings from each patient, and the variability bar is an estimate of the variation in reading amongst different patients. Average deviation is here used to estimate the variability bar.
Significant Severe Lung Infection in all Lung Regions
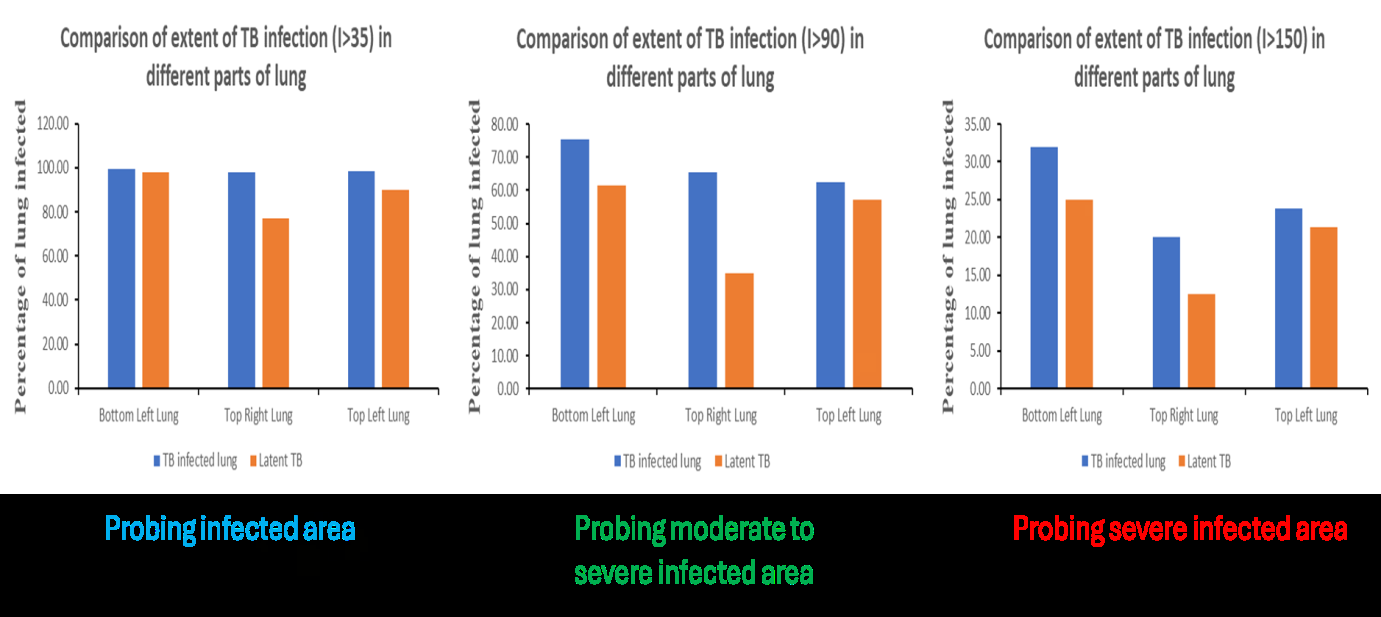
Figure 8 shows comparison of extent of TB infection in different parts of lung assessing infection status and surface area with (i) moderate to severe infection, and (ii) severe infection. Results show that in TB infection, almost the entire lung surface area is infected; hence, it is a systemic lung disease. Specifically, large areas of lung are infected to the moderate and severe degree, which indicates severe disease. More importantly, at the minimal infection level, almost 100% of the lung surface area in different lung regions is infected with TB.
Next, significant moderate to severe infection happens in TB infected and latent TB cases, where the percentage higher in full-blown TB infection. Hence, TB infection is a full-blown disease with large percentage of lung infected with M. tuberculosis. Such infection status calls for acute care for TB infection cases. On the other hand, latent TB is a serious disease in progression, and requires urgent medical attention to slow down TB spread to other lung regions. Finally, analysis of the data shows that the top right lung is the least affected lung region for moderate to severe TB infection, and maybe the lung region for resuscitation in patients with severe TB pneumonia.
Discussion
Paradigm Shift towards Quantitative Chest X-ray Analysis
Up to now, clinical diagnosis of chest X-ray images for different ailments such as detecting TB infection has been done by a radiologist using qualitative approaches. This negates much diagnostic opportunities such as extracting useful information on percent lung area infected with M. tuberculosis, and how serious is the infection (moderate or severe) at different lung regions in the TB infected lung. Using pixel intensity analysis, this work developed relatively efficient and simple MATLAB software to calculate the aggregate pixel intensity of a region of interest (ROI) for comparison with that of other lung regions. In addition, another MATLAB software developed in this work assess the severity of the infection status by comparing the pixel intensity of each pixel with a threshold, and provides a calculation for the percent lung area with moderate or severe TB infection.
What this work brings about is not a paradigm shift, but it confirms using modest computing resources and a simple MATLAB code that quantitative chest X-ray image analysis on a simple laptop with Intel Core i7 processor and Intel Integrated UHD graphics is possible. But there is an important caveat, the image dataset that was processed is small, and larger dataset with higher resolution chest X-ray images would likely need high performance computing support. It is important to note that clinically useful insights were gleaned using the quantitative chest X-ray image analysis outlined in this work, and this paradigm of increasingly quantitative nature of medical image analysis is likely to stay, in both the clinical and research lab.
Lack of Clean Background (Normal Chest X-ray) for Calibration in Computational Medical Imaging Analysis
In any image analysis project, there is a need to calibrate the normal phenotype in order to detect the abnormal phenotype. To this end, there is a need to obtain good background images for normal chest X-ray: i.e., without any microbial infection or white patches. This study uses chest X-ray images of TB patients downloaded using a Google Search. In this endeavour, it was realised that there are very few good background images of dark lungs without microbial infection or white patches. More importantly, many of the normal chest X-ray images contain significant patches of microbial infection that precluded them from being use as background calibration standards.
Such a situation potentially highlights that TB infection specifically, and microbial infection of lung in general is more widespread than thought. Specifically, many “normal” patients are in fact infected with TB or other microbial infections, and thus, there may be a hidden epidemic in TB infection.
TB Infection Manifest as Higher Aggregate Light Intensity of Affected Lung Region and is a Full Blown Disease
Current clinical manifestations of TB come in TB infection and latent TB. Each requires different treatment regime, and this needs to be titrated depending on patient’s body condition and physiology. Data from this work reveals that TB infection and latent TB have a higher aggregate light intensity compared to normal lung. This shows that profiling light intensity metric in chest X-ray images is useful for quantitative clinical diagnosis of TB pathology, specifically with regards to the amount of TB bacteria present. Naturally, higher concentration and spread (surface area) of TB in lung will result in higher aggregate light intensity for a region of interest.
This project also reveals another facet of TB pathology worth clinical considerations. Specifically, aggregate light intensity of TB infected lung is consistently higher than latent TB lung, indicating that TB infection is a more severe disease than latent TB. Hence, TB infection can be characterised as a full-blown disease, while latent TB is a disease in progression. It is important to note here that significant areas of the lung are afflicted with moderate to severe TB infection in latent TB, and it must be characterized as a serious infection that can evolve into life threatening should the immune status of the patient declines rapidly. Trends revealed in this research thus opens up a new view on latent TB infection, and labelling this infection as an aggressive disease that require more dedicated and aggressive treatment.
Moderate to Severe Infection is Prevalent in all parts of TB Infected Lung, which meant that TB must be Treated Aggressively Instead of the Slower Approach used now
Data from this project shows that all regions of the lung are susceptible to moderate to severe TB infection. This suggests that no lung region is immune from M. tuberculosis colonization and infection. Conceptually, different parts of the lung would be at different operating temperature and gaseous concentration for oxygen, carbon dioxide, and nitrogen. This may tune the conditions to be more or less favourable for M. tuberculosis colonization and growth. For Image of example, in a lung region with higher temperature, M. tuberculosis may grow faster and pose a greater threat to lung function. Analysis of the data from the chest X-ray images did not refute this possibility, but the clear trend is that TB infection is a systemic disease that afflicts all lung regions.
One implication of the systemic nature of TB infection is that the disease must be treated very aggressively to reduce the disease burden on the patient, and improve his/ her quality of life such as ease of respiration and breathing during treatment. Current antibiotics treatment is slow, and is encountering difficulty in eradicating drug resistant, extremely drug resistant, and persister M. tuberculosis. Hence, traditional antibiotic regime may no longer control TB disease progression unless drastic measures such as surgery to remove the most severely infected lung region are used as a treatment option.
Top Right Lung is the Least Affected now and is the Lung Region that can be used for Resuscitation for Severe TB Lung Pneumonia
Amongst the difficulty in treating TB infection, and the systemic and aggressive nature of the disease, there is a ray of hope for TB treatment and care. Results from this research, although from a small sample size, shows that the top right lung is the least affected lung region in terms of moderate to severe TB infection. Hence, it may be the lung that can be preserved or be resuscitated to help protect the life of a patient with severe TB lung pneumonia.
Implementing this treatment strategy necessitate the use of nasal delivery of drugs for the control of TB lung infection. Delivery efficiency may be poor for the left bottom and left top lung due to blockage caused by white bacterial nodules or patches. But, modern nasal delivery methods should be able to deliver sufficient doses of anti-inflammatory drugs or anti-histamine to the top right lung, and partially to the top left lung for relieving the symptoms associated with TB lung pneumonia. Improvement in patient’s breathing would be gradual but steady, and the lung infection in the top right and top left lung should be relieved with about two to three weeks of treatment. The bottom left and bottom right lung would be more complicated due to fluid retention resulting from gravity effect that persistently support a sizeable population of M. tuberculosis live cells that can migrate and cause reinfection of the lung. Drugs that clear this fluid retention would be immensely useful for this treatment modality.
Recommendations for Future Work
This work uses a relatively small image dataset; thus, the results may not be fully representative of the actual TB infection status in the left and right lung. Hence, larger and more comprehensive chest X-ray image dataset can be obtained, preferably with full annotation of radio-graphical information of the TB infection. However, this aspect must be balanced with the computational power available for processing the compendium of chest X-ray images in the collated dataset. This work uses a modest laptop with Intel Core i7 processor and Intel Integrated UHD graphics and could only processed about 22 chest X-ray images. Image dataset in the size range of 100s to 1000s chest X-ray images may thus need high performance computing (especially with graphics processing units (GPU) support) and possibly a cloud-based computing infrastructure.
Conclusion
Tuberculosis is an old disease since the start of human civilisation. While there are modern drugs, antibiotics, and treatment modalities for controlling TB infection, the disease is still persistent in human population, accounting for 10.6 million cases in 2022 worldwide. Such disease burden calls for a relook at TB detection and diagnosis because TB is a very hard to control due to delayed diagnosis and treatment resulting from confounding symptom presentation similar to viral or bacterial pneumonia.
This work uses two simple but effective MATLAB (self- coded) software to quantitatively profile for total extent of TB lung infection in three different lung regions (bottom left, top left, and top right), as well as extent of moderate to severe TB infection in different lung regions. Results indicate that TB infection and latent TB show up as higher aggregate pixel intensity relative to normal lung. In addition, TB infection is systemic and affects the whole lung, with large areas of lung hosting moderate to severe TB infection. This suggests aggressive treatment as the only option to protect patients’ lives and improve their quality of life during treatment. Top right lung is the least affected lung region, and may be the region targeted for aggressive resuscitation and treatment in severe TB pneumonia cases via nasal spray delivery of anti- inflammatory and anti-histamine drugs. Finally, surgery may be explored as a treatment option in cases of very severe TB infection in all lung regions.
Conflicts of Interest
The author declares no conflicts of interest.
Funding
No funding was used in this work.
References
-
Ananda NR, Triasih R, Dwihardiani B, Nababan B, Hidayat A, et al. (2023) Spectrum of TB Disease and Treatment Outcomes in a Mobile Community Based Active Case Finding Program in Yogyakarta Province, Indonesia. Trop Med Infect Dis 8(9): 447.
-
Yang J, Zhang L, Qiao W, Luo Y (2023) Mycobacterium Tuberculosis: Pathogenesis and Therapeutic Targets. MedComm 4(5): e353.
-
Jones RM, Adams KN, Eldesouky HE, Sherman DR (2022) The Evolving Biology of Mycobacterium Tuberculosis Drug Resistance. Front Cell Infect Microbiol 12: 1027394.
-
Liebenberg D, Gordhan BG, Kana BD (2022) Drug Resistant Tuberculosis: Implications for Transmission, Diagnosis, and Disease Management. Front Cell Infect Microbiol 12: 943545.
-
Gygli SM, Borrell S, Trauner A, Gagneux S (2017) Antimicrobial Resistance in Mycobacterium Tuberculosis: Mechanistic and Evolutionary Perspectives. FEMS Microbiology Reviews 41(3): 354-373.
-
Nguyen TA, Teo AKJ, Zhao Y, Quelapio M, Hill J, et al. (2024) Population-Wide Active Case Finding as a Strategy to End TB. Lancet Reg Health West Pac 46: 101047.
-
Orgeur M, Sous C, Madacki J, Brosch R (2024) Evolution and Emergence of Mycobacterium Tuberculosis. FEMS Microbiol Rev 48(2): fuae006.
-
Boritsch EC, Brosch R (2016) Evolution of Mycobacterium Tuberculosis: New Insights into Pathogenicity and Drug Resistance. Microbiol Spectr 4(5).
-
Knight GM, McQuaid CF, Dodd PJ, Houben RMGJ (2019) Global Burden of Latent Multidrug-Resistant Tuberculosis: Trends and Estimates Based on Mathematical Modelling. Lancet Infect Dis 19(8): 903- 912.
-
Chaw L, Chien LC, Wong J, Takahashi K, Koh D, et al. (2020) Global Trends and Gaps in Research Related to Latent Tuberculosis Infection. BMC Public Health 20: 352.
-
Ding C, Hu M, Guo W, Hu W, Li X, et al. (2022) Prevalence Trends of Latent Tuberculosis Infection at the Global, Regional and Country Levels from 1990-2019. Int J Infect Dis 122: 46-62.
-
Rojano B, Caminero JA, Hayek M (2019) Curving Tuberculosis: Current Trends and Future Needs. Ann Glob Health 85(1): 5.
-
Murthy SE, Chatterjee F, Crook A, Dawson R, Mendel C, et al. (2018) Pretreatment Chest X-ray Severity and its Relation to Bacterial Burden in Smear Positive Pulmonary Tuberculosis. BMC Med 16(1): 73.
-
Nakagawa S, Ono N, Hakamata Y, Ishii T, Saito A, et al. (2024) Quantitative Evaluation Model of Variable Diagnosis for Chest X-ray Images using Deep Learning. PLOS Digit Health 3(3): e0000460.
-
Khan FA, Majidulla A, Tavaziva G, Nazish A, Abidi SK, et al. (2020) Chest X-ray Analysis with Deep Learning-Based Software as a Triage Test for Pulmonary Tuberculosis: A Prospective Study of Diagnostic Accuracy for Culture- Confirmed Disease. The Lancet Digital Health 2(11): e573-e581.
-
Wong A, Lee JRH, Rahmat KH, Sabri A, Alaref A, et al. (2022) TB-Net: A Tailored, Self-Attention Deep Convolutional Neural Network Design for Detection of Tuberculosis Cases From Chest X-Ray Images. Front Artif Intell 5: 827299.
-
Santosh KC, Allu S, Rajaraman S, Antani S (2022) Advances in Deep Learning for Tuberculosis Screening using Chest X-rays: The Last 5 Years Review. J Med Syst 46(11): 82.
-
Acharya V, Dhiman G, Prakasha K, Bahadur P, Choraria A, et al. (2022) AI-Assisted Tuberculosis Detection and Classification from Chest X-Rays Using a Deep Learning Normalization-Free Network Model. Comput Intell Neurosci 2399428.
-
Qin ZZ, Sander MS, Rai B, Titahong CN, Sudrungrot S, et al. (2019) Using Artificial Intelligence to Read Chest Radiographs for Tuberculosis Detection: A Multi-Site Evaluation of the Diagnostic Accuracy of three Deep Learning Systems. Sci Rep 9(1): 15000.
-
Hisham MFM, Lodz NA, Muhammad EN, Asari FN, Mahmood MI, et al. (2023) Evaluation of 2 Artificial Intelligence Software for Chest X-Ray Screening and Pulmonary Tuberculosis Diagnosis: Protocol for a Retrospective Case-Control Study. JMIR Res Protoc 12: e36121.
-
Owais M, Arsalan M, Mahmood T, Kim YH, Park KR (2020) Comprehensive Computer-Aided Decision Support Framework to Diagnose Tuberculosis From Chest X-Ray Images: Data Mining Study. JMIR Med Inf 8(12): e21790.
- Origin, Evolution, and Functional Impact of Short Insertion- Deletion Variants in Human Genomes: A Review
- Harnessing Molecular Glues for Next-Generation Vaccine, Cancer and Cardiovascular Disease Drug Development: A Comprehensive Review
- Lateral Cervical Epidermal Inclusion Cyst in a Paediatric Patient: A Rare Case Report
- Malarial Plasmodium Falciparum with Hepatitis B and C Virus Infections among Blood Donors in Ife Central Local Government Area, Ile Ife, Osun State, Nigeria
- Withanolides and Withaferin A- What’s next in Ashwagandha Research
- Designing of Dual Pulse Photoacoustic Tomography for Imaging of Drug-Response and Tumor Growth