Trend Scenarios of Mortality due to Diabetes Mellitus and its Correlation with the Economic Sector, in the State of Mexico, for the Years 2020, 2025 and 2030
Purpose: This research aimed to develop trend scenarios for diabetes mellitus mortality and analyze their correlation with the economic sectors of the municipalities of the State of Mexico for the years 2020, 2025, and 2030, in order to provide shortand medium-term future projections. Materials and Methods: A regression analysis with curvilinear estimation was used to define the scenarios corresponding to 2020, 2025, and 2030. Constants were included in the equations and trends were integrated using linear, quadratic, cubic, compound, growth, and exponential models. The classification of the municipalities was based on the standard deviation, range, and the diabetes mellitus mortality rate per 100,000 inhabitants. In addition, the Pearson correlation coefficient was calculated to evaluate the relationship with the economic sectors of agriculture, manufacturing, construction, services, restaurants, and hotels. Results: Composite regression models were applied to 47 municipalities, cubic models to 44, quadratic models to 31, while 1 municipality was modeled with a growth approach, another with an exponential model, and one with a linear model. Conclusion: Short- and medium-term scenarios suggest that the industrial and service sectors are predisposed to higher mortality from diabetes mellitus, as evidenced by a low positive correlation. As these economic activities increase, so does the mortality rate associated with this comorbidity.
Abbreviations
WHO: World Health Organization; SIESDE: Strategic Information System on Health; Functional Dependency and Aging.
Introduction
Diabetes mellitus is a chronic, systematic pathology of unknown cause, with varying degrees of hereditary predisposition and the participation of various environmental factors that affect the intermediate metabolism of carbohydrates, proteins and fats, which are pathophysiologically associated with a deficiency in the quantity, timing of secretion and/or in the action of insulin. These defects result in an abnormal elevation of blood glucose after standard glucose loads and even in aids as there is greater decompensation of insula secretion [1]. This comorbidity manifests itself when the pancreas does not produce enough insulin or when the body does not effectively use the insulin it produces. Insulin is a hormone that regulates blood sugar. The effect of uncontrolled diabetes is hyperglycemia (increased blood sugar), which over time seriously damages many organs and systems, especially nerves and blood vessels [2].
By other hand, according to the International Diabetes Federation, the countries that have registered the highest number of people with diabetes mellitus are China, India, the United States, Brazil, Russia and Mexico [3]. In 2016 alone, Mexico had 89,420 deaths according to the Epidemiological Panorama of Mexico. Based on theories such as the epidemiological transition theory, which studies the types of causes and changes in mortality that exist over time [4] and the demographic transition theory, which explains mortality levels and the decrease in fertility [5]; and on the other hand, taking into account that the state of Mexico is the most populated political demarcation in Mexico [6], it is relevant to analyze the data from the records of people who suffer from this disease.
A time series analysis of mortality reports caused by Diabetes Mellitus was carried out, in order to integrate models that describe the trend of the increase or decrease in the mortality rate of this comorbidity. This allowed the integration of trend scenarios for the years 2025, 2030, and also a history with the records of the year 2020.
This information can constitutes a statistical tool for the identification of vulnerable areas and those with the greatest demand for health services in diabetes mellitus care, which can be incorporated into institutional and governmental decision-making and, on the other hand, for logistics in health promotion and prevention days and campaigns in order to improve the quality of life of the population of the State of Mexico.
Materials and methods
Database
The information used to generate the trend models comes from the National Health Information System database [7], referring to diabetes mellitus mortality (TMD, by its acronym in Spanish), which is available in https:// salud.gob.mx/unidades/cdi/documentos/sinais.pdf. This resource contains the TDM of the 125 municipalities of the State of Mexico for the period 1990 to 2015, the subtraction and trend increase values between 2015 and 1990 [8], as well as the economic activity carried out by the registered persons.
Calculation of Statistics
The process began with the selection of mortality rates for diabetes mellitus (TMD) corresponding to the years 1990 and 2015. Next, the difference between the values for both years was calculated for each municipality. This difference was used to obtain the percentage increase by multiplying the result by 100 and dividing by the 1990 value. This procedure made it possible to estimate the trend of the TDM in the 125 municipalities of the State of Mexico.
The projection of future scenarios of mortality due to diabetes mellitus was made based on the calculated TDM (according to equation 1), expressed per 100,000 inhabitants.
Number of deaths from diabetes Mortality rate 100,000 Total population = × (1)
Scenario Generation
The dates for the 2020, 2025 and 2030 scenarios were defined using SPSS© statistical software.
A regression analysis with curvilinear estimation was performed. For each municipality, observed values were entered and predictions were made for future years, extending the estimates to 2030.
The coefficient of determination (R²) was calculated for each municipality to evaluate the adequacy of the selected model. The models evaluated included: linear, quadratic, cubic, compound, growth and exponential, ensuring that each met the criteria established for the inclusion of a constant in the equation.
Finally, Pearson’s correlation coefficient was applied to determine the degree of relationship between two trend results. A coefficient of r = 1 or r = -1 indicates a perfect linear relationship, being positive when both variables increase together, and negative when one variable decreases while the other increases.
Results
Different adjusted regression models were identified, due to the dispersion of the data on TDM due to diabetes mellitus in the scenarios projected for the years 2020, 2025 and 2030 Table 1. The models that describe the behaviour of the mortality rate in the municipalities of the State of Mexico include six types: linear, quadratic, cubic, compound, growth and exponential.
| Municipality | R2 | Model Type | 2020 Projection | 2025 Projection | 2030 Projection |
|---|---|---|---|---|---|
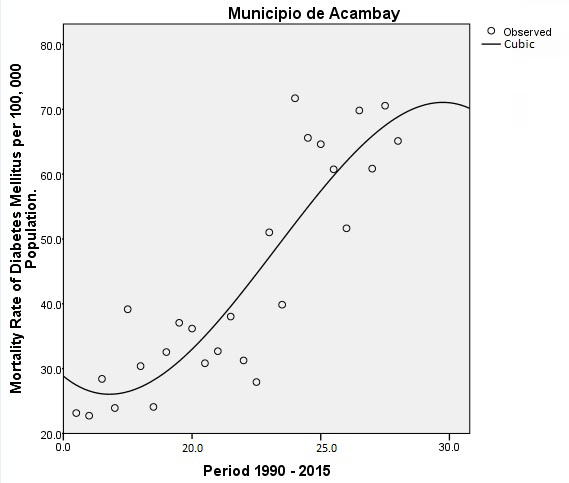
| Acambay | 0.786 | Cubic | 70.58 | 61.07 | 36.45 |
| Acolman | 0.038 | Linear | 59.91 | 61.39 | 62.86 |
| Aculco | 0.756 | Cubic | 93.18 | 115.76 | 138.54 |
| Almoloya de Alquisiras | 0.53 | Compound | 112.68 | 155.89 | 215.67 |
| Almoloya de Juárez | 0.861 | Cubic | 55.16 | 43.4 | 19.99 |
| Almoloya del Rio | 0.324 | Compound | 155.22 | 179.75 | 208.16 |
| Amanalco | 0.381 | Cubic | 49.44 | 35.73 | 8.13 |
| Amatepec | 0.793 | Cubic | 113.7 | 157.75 | 216.87 |
| Amecameca | 0.773 | Cubic | 117.69 | 108.13 | 81.73 |
| Apaxco | 0.71 | Cubic | 89.75 | 68.93 | 24.76 |
| Atenco | 0.68 | Cubic | 74.79 | 54.73 | 16.67 |
| Atizapan | 0.245 | Growth | 148.41 | 151.4 | 154.45 |
| Atizapan de Zaragoza | 0.945 | Cubic | 77.37 | 71.96 | 54.02 |
| Atlacomulco | 0.851 | Compound | 101.88 | 135.92 | 181.33 |
| Atlautla | 0.775 | Quadratic | 146.7 | 171.2 | 197.12 |
| Axapusco | 0.377 | Quadratic | 55.66 | 44.18 | 27.89 |
| Ayapango | 0.215 | Quadratic | 108.7 | 136.71 | 169.5 |
| Calimaya | 0.686 | Cubic | 79.3 | 63.02 | 33.65 |
| Capulhuac | 0.704 | Compound | 197.94 | 240.96 | 293.32 |
| Chalco | 0.875 | Cubic | 113.86 | 153.36 | 209.88 |
| Chapa de Mota | 0.43 | Exponential | 80.56 | 102.89 | 131.41 |
| Chapultepec | 0.126 | Quadratic | 141.92 | 193.27 | 256.49 |
| Chiautla | 0.639 | Cubic | 237.78 | 385.85 | 606.54 |
| Chicoloapan | 0.701 | Compound | 78.37 | 92.63 | 109.49 |
| Chiconcuac | 0.779 | Cubic | 201.08 | 255.14 | 322.37 |
| Chimalhuacan | 0.97 | Cubic | 95.95 | 105.83 | 110.5 |
| Coacalco de Berriozabal | 0.901 | Quadratic | 96.32 | 112.12 | 129.35 |
| Coatepec Harinas | 0.764 | Quadratic | 104.37 | 130.52 | 159.77 |
| Cocotitlan | 0.519 | Compound | 162.74 | 223.12 | 305.9 |
| Coyotepec | 0.886 | Cubic | 148.66 | 171.86 | 187.44 |
| Cuautitlan | 0.314 | Quadratic | 42.15 | 31.7 | 18 |
| Cuautitlan Izcalli | 0.97 | Compound | 121.77 | 163.69 | 220.04 |
| Donato Guerra | 0.689 | Compound | 114.48 | 169.64 | 251.37 |
| Ecatepec de Morelos | 0.993 | Cubic | 102.36 | 94.71 | 69.31 |
| Ecatzingo | 0.248 | Compound | 66.51 | 80.91 | 98.42 |
| El Oro | 0.533 | Quadratic | 80.05 | 96.73 | 115.58 |
| Huehuetoca | 0.571 | Cubic | 55.28 | 53.31 | 47.98 |
| Hueypoxtla | 0.761 | Compound | 143.22 | 185.93 | 241.38 |
| Huixquilucan | 0.892 | Compound | 92.28 | 124.11 | 166.92 |
| Isidro Fabela | 0.223 | Quadratic | 58.77 | 52.23 | 42.08 |
| Ixtapaluca | 0.942 | Cubic | 90.09 | 113.75 | 143.02 |
| Ixtapan de la Sal | 0.606 | Quadratic | 87.66 | 95.96 | 103.57 |
| Ixtapan del Oro | 0.13 | Quadratic | 58.86 | 70.88 | 84.56 |
| Ixtlahuaca | 0.886 | Quadratic | 78.62 | 95.41 | 113.93 |
| Jaltenco | 0.717 | Compound | 154.85 | 241.46 | 376.5 |
| Jilotepec | 0.804 | Quadratic | 97.64 | 119.66 | 144.5 |
| Jilotzingo | 0.654 | Quadratic | 105 | 122.26 | 139.76 |
| Jiquipilco | 0.88 | Cubic | 123.1 | 168.61 | 228.54 |
| Jocotitlán | 0.77 | Quadratic | 99.1 | 121.99 | 147.73 |
| Joquicingo | 0.285 | Compound | 143.64 | 177.19 | 218.56 |
| Juchitepec | 0.619 | Compound | 154.38 | 197.68 | 253.13 |
| La Paz | 0.862 | Cubic | 80.52 | 81.06 | 76.01 |
| Lerma | 0.743 | Compound | 114.89 | 139.49 | 169.36 |
| Luvianos | 0.817 | Cubic | 78.02 | 72.4 | 48.83 |
| Malinalco | 0.563 | Quadratic | 100.66 | 128.5 | 160.75 |
| Melchor Ocampo | 0.602 | Cubic | 177.46 | 273.52 | 418.56 |
| Metepec | 0.879 | Compound | 125.4 | 161.57 | 208.17 |
| Mexicaltzingo | 0.197 | Compound | 124.15 | 142.24 | 162.97 |
| Morelos | 0.533 | Compound | 128.3 | 163.13 | 207.42 |
| Naucalpan de Juárez | 0.957 | Compound | 139.61 | 180.27 | 232.77 |
| Nextlalpan | 0.091 | Cubic | 50.8 | 45.25 | 32.12 |
| Nezahualcoyotl | 0.976 | Compound | 201.99 | 264.92 | 347.45 |
| Nicolas Romero | 0.852 | Compound | 100.31 | 123.86 | 152.94 |
| Nopaltepec | 0.108 | Quadratic | 86.37 | 105.37 | 127.82 |
| Ocoyoacac | 0.727 | Compound | 163.93 | 205.25 | 256.98 |
| Ocuilan | 0.621 | Compound | 99.38 | 127.34 | 163.18 |
| Otumba | 0.655 | Quadratic | 134.4 | 166.43 | 203.15 |
| Otzoloapan | 0.384 | Quadratic | 181.39 | 253.82 | 339.91 |
| Otzolotepec | 0.79 | Quadratic | 87.87 | 102.33 | 117.64 |
| Ozumba | 0.691 | Compound | 163.19 | 206.58 | 261.51 |
| Papalotla | 0.324 | Compound | 163.36 | 203.59 | 253.72 |
| Polotitlán | 0.475 | Quadratic | 102.82 | 127.45 | 155.82 |
| Rayón | 0.155 | Compound | 77.04 | 86.99 | 98.21 |
| San Antonio la Isla | 0.175 | Compound | 84.3 | 95.33 | 107.81 |
| San Felipe del Progreso | 0.856 | Cubic | 73.8 | 102.63 | 139.87 |
| San José del Rincón | 0.799 | Cubic | 65.69 | 94.12 | 134.43 |
| San Martin de las Piramides | 0.362 | Cubic | 113.84 | 153 | 211.06 |
| San Mateo Atenco | 0.82 | Cubic | 103.15 | 96.08 | 74.19 |
| San Simón de Guerrero | 0.385 | Cubic | 165.85 | 292.1 | 479.6 |
| Santo Tomas | 0.196 | Compound | 87.05 | 105.23 | 127.21 |
| Soyaniquilpan de Juarez | 0.524 | Compound | 102.62 | 130.83 | 166.81 |
| Sultepec | 0.798 | Quadratic | 102.68 | 135.22 | 172.86 |
| Tecamac | 0.766 | Cubic | 56.72 | 60.26 | 66.36 |
| Tejupilco | 0.925 | Quadratic | 106.57 | 143.78 | 187.25 |
| Temamatla | 0.435 | Cubic | 105.43 | 133.82 | 167.8 |
| Temascalapa | 0.759 | Cubic | 101.04 | 102.27 | 88.93 |
| Temascalcingo | 0.893 | Quadratic | 139.77 | 170.84 | 204.7 |
| Temascaltepec | 0.787 | Cubic | 99.14 | 118.9 | 135.81 |
| Temoaya | 0.766 | Cubic | 155.22 | 176.42 | 189.66 |
| Tenancingo | 0.787 | Cubic | 85.47 | 106.52 | 137.63 |
| Tenango del Aire | 0.442 | Compound | 149.76 | 198.54 | 263.2 |
| Tenango del Valle | 0.892 | Compound | 117.01 | 139.1 | 165.36 |
| Teoloyucan | 0.936 | Cubic | 155.22 | 176.42 | 189.66 |
| Teotihuacan | 0.764 | Cubic | 101.03 | 94.44 | 72.4 |
| Tepetlaoxtoc | 0.73 | Compound | 168.46 | 231.08 | 316.96 |
| Tepetlixpa | 0.474 | Compound | 160.46 | 205.19 | 262.39 |
| Tepotzotlan | 0.816 | Quadratic | 63.23 | 64.31 | 63.41 |
| Tequixquiac | 0.579 | Compound | 119.73 | 154.97 | 200.58 |
| Texcaltitlan | 0.606 | Quadratic | 106.21 | 127.03 | 149.55 |
| Texcalyacac | 0.212 | Cubic | 164.29 | 213.08 | 278.24 |
| Texcoco | 0.941 | Cubic | 148.62 | 203.58 | 277.66 |
| Tezoyuca | 0.359 | Compound | 109.58 | 128.62 | 150.96 |
| Tianguistenco | 0.78 | Compound | 148.18 | 176.34 | 209.86 |
| Timilpan | 0.457 | Compound | 126.72 | 164.38 | 213.23 |
| Tlalmanalco | 0.746 | Compound | 164.65 | 208.37 | 263.69 |
| Tlalnepantla de Baz | 0.949 | Compound | 150.96 | 189.94 | 239 |
| Tlatlaya | 0.848 | Quadratic | 131.39 | 176.88 | 229.63 |
| Toluca | 0.939 | Cubic | 73.99 | 54.21 | 16.56 |
| Tonanitla | 0.629 | Quadratic | 141.31 | 188.94 | 244.91 |
| Tonatico | 0.455 | Compound | 144.96 | 184.22 | 234.12 |
| Tultepec | 0.747 | Compound | 108.84 | 138.73 | 176.83 |
| Tultitlan | 0.952 | Compound | 102.24 | 131.45 | 169.01 |
| Valle de Bravo | 0.674 | Compound | 118.38 | 147.77 | 184.45 |
| Valle de Chalco Solidaridad | 0.874 | Quadratic | 118.59 | 149.79 | 185.47 |
| Villa de Allende | 0.758 | Quadratic | 73.38 | 92.57 | 114.27 |
| Villa del Carbón | 0.685 | Cubic | 75.87 | 104.62 | 145.09 |
| Villa Guerrero | 0.669 | Cubic | 74.98 | 77.59 | 73.49 |
| Villa Victoria | 0.824 | Compound | 75.88 | 101.11 | 134.74 |
| Xalatlaco | 0.653 | Compound | 160.45 | 196.05 | 239.56 |
| Xonacatlan | 0.791 | Compound | 155.24 | 206.3 | 274.15 |
| Zacazonapan | 0.248 | Cubic | 79.54 | 67.21 | 32.27 |
| Zacualpan | 0.809 | Cubic | 107.97 | 127.13 | 139.7 |
| Zinacantepec | 0.886 | Compound | 109.49 | 141.63 | 183.22 |
| Zumpahuacan | 0.631 | Cubic | 135.92 | 214.05 | 324.14 |
| Zumpango | 0.744 | Quadratic | 86.81 | 99.57 | 113.52 |
Table 1: Different adjusted regression models.
Initially, a logarithmic model was considered, but it presented a lower R² value compared to the other models in all cases, so it did not meet the criteria established for data fitting and was excluded from the analysis. Consequently, only the six models mentioned above were used, which provide an adequate representation of mortality trends in the municipalities.
Table 2 presents the municipalities classified by the type of model that best describes the trend in the mortality rate due to diabetes mellitus, as well as the percentage of municipalities that correspond to each of these models in the State of Mexico. By other hand, Figure 1 presents a representative example of the cubic model applied to diabetes mellitus mortality rates in one of the municipalities of the State of Mexico. This model was selected for its ability to capture the nonlinear variations observed in the data, providing a robust fit that reflects fluctuations in short- and medium-term projections [7, 8].
| Model | Municipalities | % |
|---|---|---|
| Compound | 47 | 36.80% |
| Cubic | 44 | 35.20% |
| Quadratic | 31 | 24.80% |
| Growth | 1 | 0.80% |
| exponential | 1 | 0.80% |
| Linear | 1 | 0.80% |
Table 2: Models that explain the behaviour of the mortality rate due to diabetes mellitus in the municipalities of the State of M
The results obtained for each trend made it possible to generate rankings and gradient maps, based on the analysis of the standard deviation of the data.
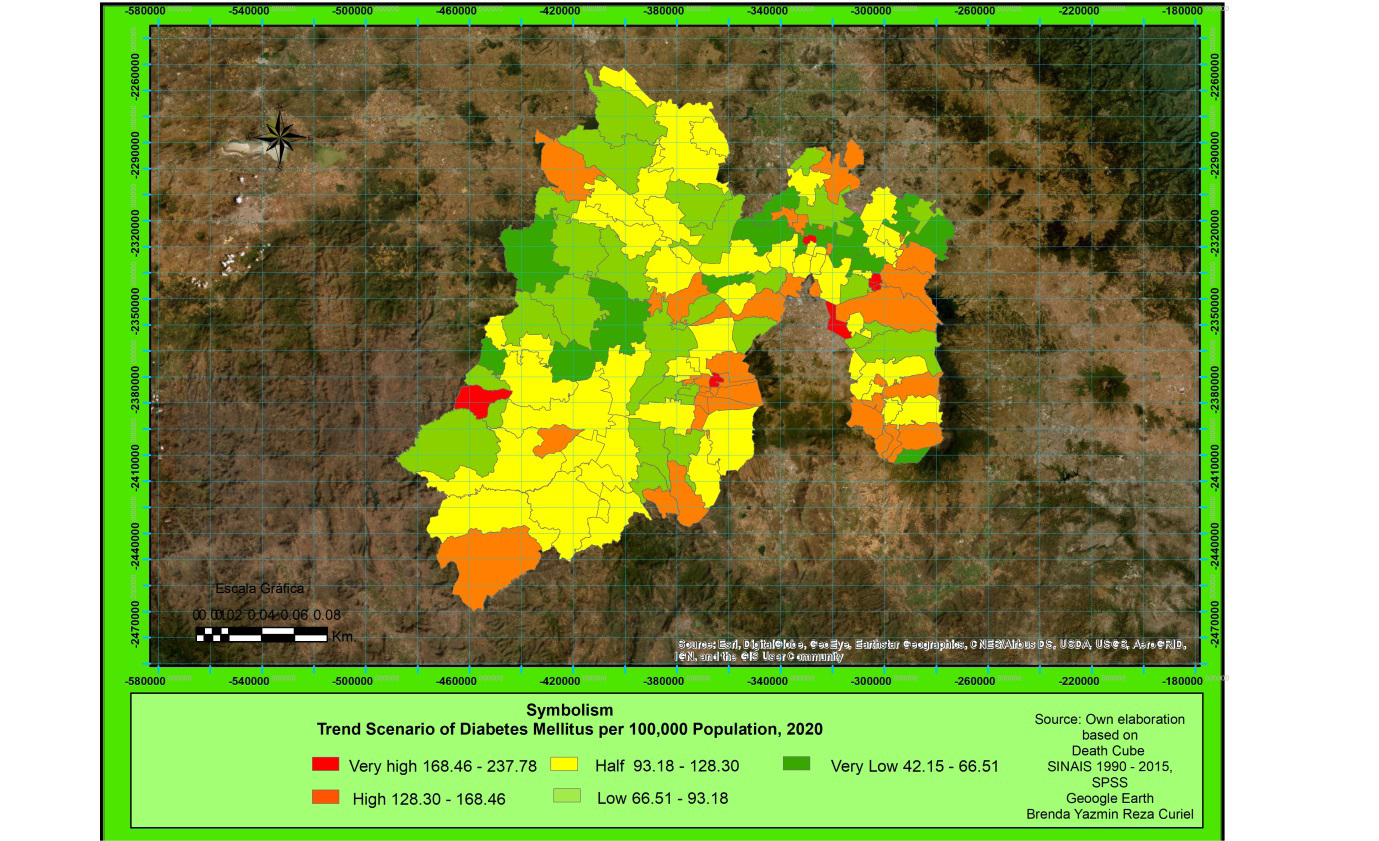
Trend Scenario for the Year 2020
The trend scenario for the year 2020 reveals high mortality rates for diabetes mellitus, classified in range 5, with values between 168.46 and 237.78 per 100,000 inhabitants, distributed in 6 municipalities, representing 4.8% of the total. These municipalities are located in the northeast, southeast and southwest of the State of Mexico, including Capulhuac, Otzoloapan, Nezahualcóyotl, Melchor Ocampo, Chiautla and Chiconcuac.
In rank 4, mortality rates range between 128.30 and 168.46 per 100,000 inhabitants, covering 32 municipalities, equivalent to 25.6%. These municipalities are located in the northeast, northwest, southeast and southwest of the State of Mexico, including Temascalcingo, Hueypoxtla, Naucalpan de Juarez, Ocoyoacac, Texcoco and Tianguistenco.
Rank 3 has average mortality rates that vary between 93.18 and 128.30 per 100,000 inhabitants, distributed among 44 municipalities, representing 35.2%. The municipalities in this range, located in the northeast, northwest, southeast and southwest of the State of Mexico, include Temascalcingo, Jilotepec, Atlacomulco, Jiquipilco, Temascaltepec, Zinacantepec and Metepec.
In rank 2, low mortality rates are observed, fluctuating between 66.51 and 93.18 per 100,000 inhabitants, corresponding to 26 municipalities, which is equivalent to 20.8%. These municipalities are located in the northeast, northwest, southeast and southwest of the State of Mexico, including Aculco, San Felipe del Progreso, Villa Victoria, Toluca, Huixquilucan, Ixtapaluca and Luvianos, among others.
Finally, rank 1 groups municipalities with very low mortality rates, which vary between 42.15 and 66.51 per 100,000 inhabitants, corresponding to 17 municipalities, representing 13.6%. These municipalities are located in the northwest, northeast and southeast of the State of Mexico, with Almoloya de Juárez, Amanalco, Axapusco, San José del Rincón and Tepotzotlán standing out [7].
The results for the 2020 trend on ranking and spatial distribution are presented in Table 3 and Figure 2, respectively.
| Classification | Color Cartography | Standard Deviation | Range | Rate per 100,000 inhabitants | Number of Municipalities | % of Municipalities |
|---|---|---|---|---|---|---|
| Very high | >1 | 5 | 168.46 to 237.78 | 6 | 4.8 | |
| High | 0.5 to 1 | 4 | 128.30 to 168.46 | 32 | 25.6 | |
| Half | 0 to <0.5 | 3 | 93.18 to 128.30 | 44 | 35.2 | |
| Low | -0.5 to <0 | 2 | 66.51 to 93.18 | 26 | 20.8 | |
| Very Low | <-1 | 1 | 42.15 to 66.51 | 17 | 13.6 |
Table 3: Projection of Mortality from Diabetes Mellitus, State of Mexico: 2020.
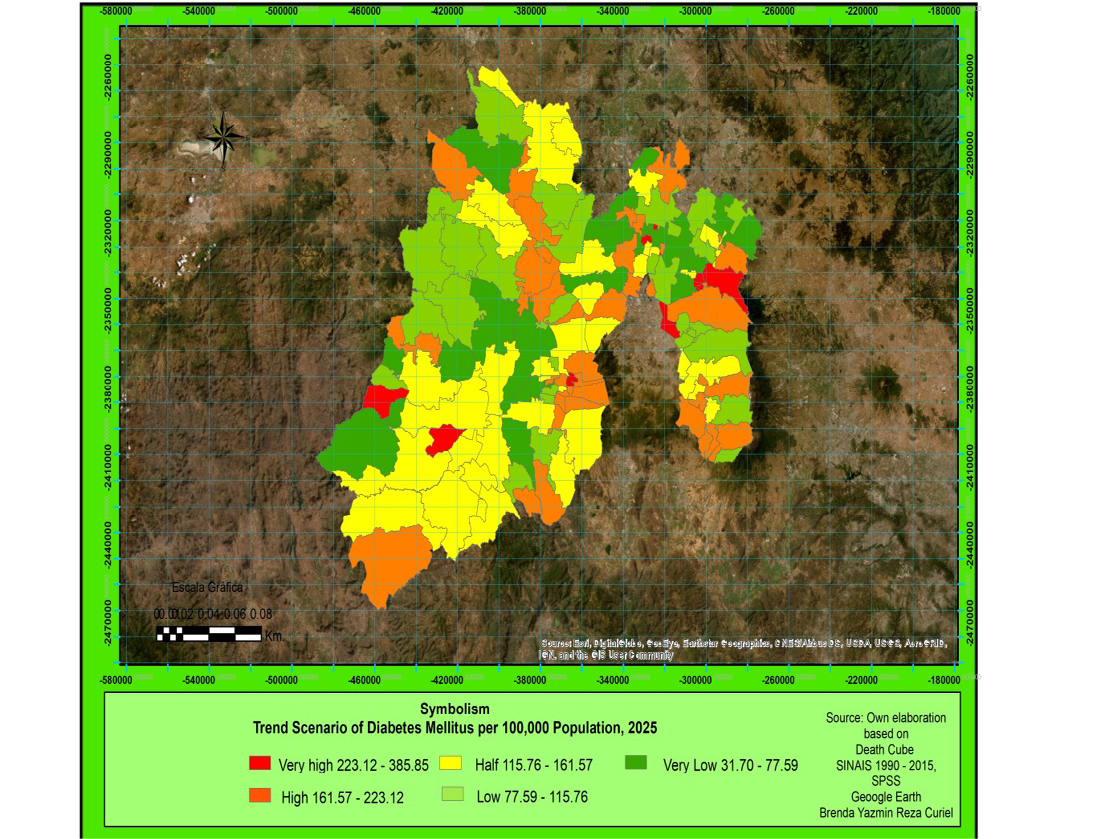
Trend Scenario for the Year 2025
The trend scenario for the year 2025 shows very high mortality rates, classified in range 5, with values ranging between 223.12 and 385.85 per 100,000 inhabitants in 10 municipalities, equivalent to 8% of the total. These municipalities, located in the northeast, southeast and southwest of the State of Mexico, include Capulhuac, San Simon de Guerrero, Otzoloapan, Tepetlaoxtoc and Nezahualcóyotl.
Rank 4 comprises municipalities with high mortality rates, between 161.57 and 223.12 per 100,000 inhabitants, distributed in 33 municipalities, representing 26.4%. These municipalities are located in the northeast, northwest, southeast and southwest of the State of Mexico, including Temascalcingo, Jiquipilco, Tianguistenco, Ocoyoacac and Xalatlaco.
In rank 3, there is an average mortality rate that varies between 115.76 and 161.57 per 100,000 inhabitants, also distributed among 33 municipalities, which is equivalent to 26.4%. Among these municipalities, located in the northeast, northwest, southeast and southwest of the State of Mexico, are Jilotepec, Zinacantepec, Nicolás Romero, Temascaltepec, Lerma and Huixquilucan.
Rank 2 has low mortality rates, with values between 77.59 and 115.76 per 100,000 inhabitants, covering 28 municipalities, which corresponds to 22.4%. Some of these municipalities are Aculco, San José del Rincón, Villa Victoria, Tenancingo and Ixtapaluca, located in the northeast, northwest, southeast and southwest of the State of Mexico.
Finally, rank 1 includes municipalities with very low mortality rates, ranging between 31.70 and 77.59 per
100,000 inhabitants, distributed in 21 municipalities, equivalent to 16.8%. These municipalities, located in the northwest, northeast, southwest and southeast of the State of Mexico, include Acambay, Luvianos, Villa Guerrero, Toluca, Almoloya de Juarez and Axapusco [7].
The results for the 2025 trend on ranking and spatial distribution are presented in Table 4 and Figure 3, respectively.
| Classification | Color in Cartography | Standard Deviation | Range | Rate per 100,000 inhabitants | Number of Municipalities | % of Municipalities |
|---|---|---|---|---|---|---|
| Very high | >1 | 5 | 223.12 to 385.85 | 10 | 8 | |
| High | 0.5 to 1 | 4 | 161.57 to 223.12 | 33 | 26.4 | |
| Half | 0 to <0.5 | 3 | 115.76 to 161.57 | 33 | 26.4 | |
| Low | -0.5 to <0 | 2 | 77.59 to 115.76 | 28 | 22.4 | |
| Very Low | <-1 | 1 | 31.70 to 77.59 | 21 | 16.8 |
Table 4: Projection of Mortality due to Diabetes Mellitus, State of Mexico: 2025.
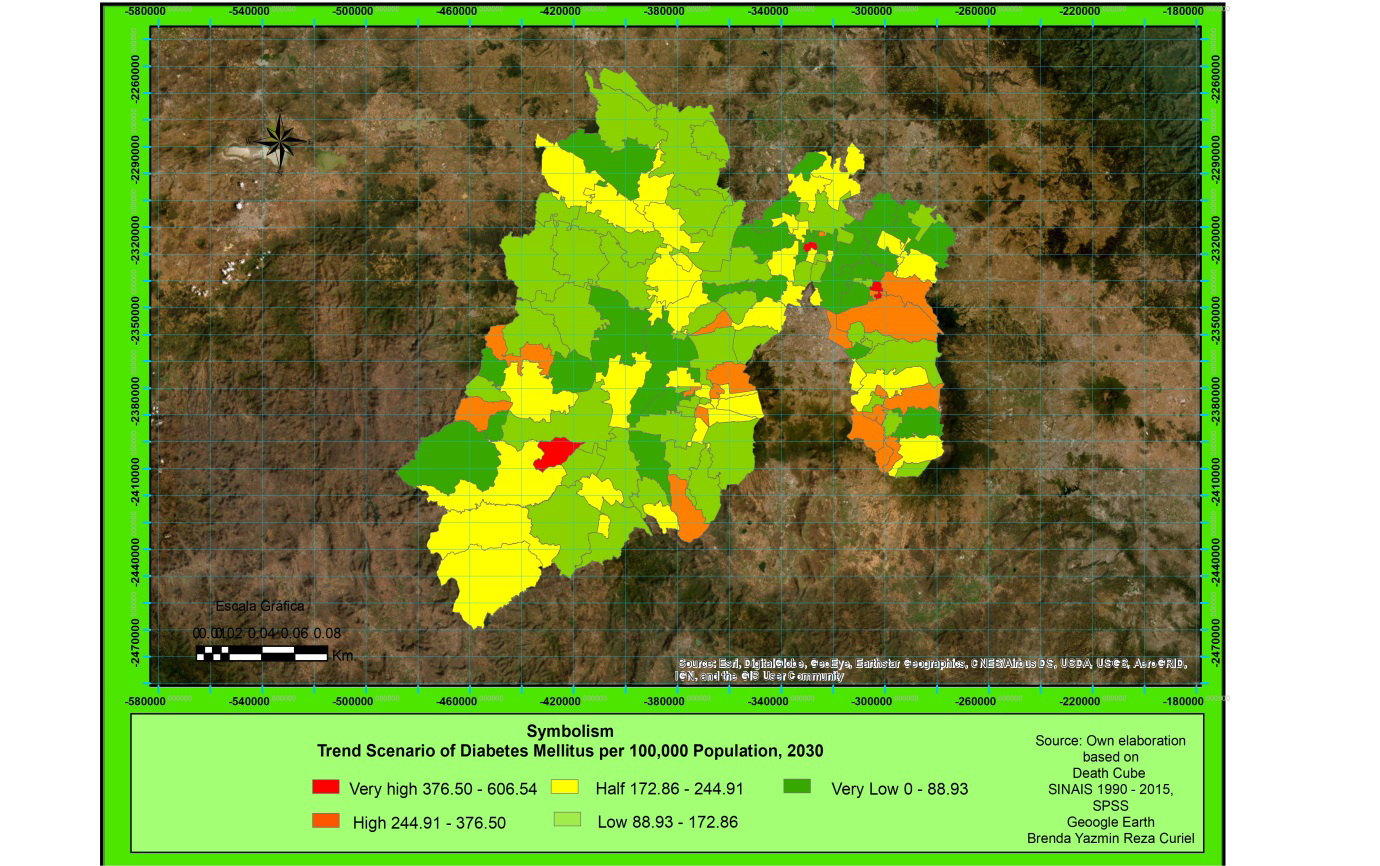
Trend Scenario for the Year 2030
The projected trend scenario for the year 2030 reveals very high mortality rates, located in range 5, with values between 376.50 and 606.54 per 100,000 inhabitants in 3 municipalities, representing 2.4% of the total. These municipalities, located in the northeast and southwest of the State of Mexico, include San Simon de Guerrero, Melchor Ocampo and Chiautla.
Rank 4 comprises high mortality rates, ranging from 244.91 to 376.50 per 100,000 inhabitants, distributed among 19 municipalities, which is equivalent to 15.2%. The municipalities in this category are located in the northeast, southeast and southwest of the State of Mexico, and some of them are: Tepetlaoxtoc, Texcoco, Ocoyoacac, Tlalmanalco, Zumpahuacán and Otzoloapan.
In rank 3, there is an average mortality rate that ranges between 172.86 and 244.91 per 100,000 inhabitants, covering 31 municipalities, which represents 24.8% of the total. The municipalities included in this range are located in the northeast, northwest, southeast and southwest of the State of Mexico, among them: Temascalcingo, Atlacomulco, Jiquipilco, Zinacantepec, Tejupilco, Amatepec and Tlatlaya.
Rank 2 includes municipalities with low mortality rates, which vary between 88.93 and 172.86 per 100,000 inhabitants, distributed in 43 municipalities, equivalent to 34.4%. These municipalities are located in the northeast, northwest, southeast and southwest of the State of Mexico, and include: Polotitlán, San Felipe del Progreso, Sultepec, Malinalco, Tenancingo, Ocuilan and Ixtapaluca.
Finally, rank 1 refers to municipalities with very low mortality rates, with values ranging from 0 to 88.93 per 100,000 inhabitants, distributed in 29 municipalities, which corresponds to 23.2% of the total. These municipalities are located in the northwest, northeast, southwest and southeast of the State of Mexico, and include Acambay, Tepotzotlán, Tecamac, Villa Guerrero, Luvianos, Toluca and Amecameca [7].
The results for the 2030 trend on ranking and spatial distribution are presented in Table 5 and Figure 4, respectively.
| Classification | Color in cartography | Standard Deviation | Range | Rate per 100,000 inhabitan | Number of Municipalities | % of Municipalities |
|---|---|---|---|---|---|---|
| Very high | >+1 | 5 | 376.50 to 606.54 | 3 | 2.4 | |
| High | 0.5 to 1 | 4 | 244.91 to 376.50 | 19 | 15.2 | |
| Half | 0 to <0.5 | 3 | 172.86 to 244.91 | 31 | 24.8 | |
| Low | -0.5 to <0 | 2 | 88.93 to 172.86 | 43 | 34.4 | |
| Very Low | <-1 | 1 | 0 to 88.93 | 29 | 23.2 |
Table 5: Projection of Mortality from Diabetes Mellitus, State of Mexico: 2030.
Correlation with the Economic Sector, 1990, 2000, 2010 and 2015
A correlation analysis was performed with the available records from 1990, 2000, 2010 and 2015 of people who reported suffering from the disease and who were linked to some of the most important economic sectors of the State of Mexico, in order to study their possible association with the trend scenarios of TDM due to diabetes mellitus. The complete results are shown in Table 6.
The Agricultural sector showed a low negative correlation with the mortality rate due to diabetes mellitus, indicating that an increase in participation in this sector is associated with a decrease in the mortality rate due to diabetes mellitus. Similarly, the Construction sector also showed a low negative correlation, suggesting that an increase in construction activity is related to a reduction in the mortality rate due to diabetes mellitus.
| Diabetes Mellitus Mortality Rate / Economic Sector | Pearson Correlation 1990 | Pearson Correlation 2000 | Pearson Correlation 2010 | Pearson Correlation 2015 |
|---|---|---|---|---|
| Agriculture | -0.24 | -0.33 | -0.37 | -0.23 |
| Manufacturing Industry | 0.37 | 0.43 | 0.23 | 0.04 |
| Construction | -0.22 | -0.34 | ---- | ---- |
| Restaurants and Hotels | 0.25 | ---- | 0.29 | 0.25 |
Table 6: Pearson Correlation Values between the Diabetes Mellitus Mortality Rate and the Employed Population by Economic Sector [
In contrast, the Industrial Manufacturing sector revealed a low positive correlation, meaning that a higher level of activity is associated with an increase in the mortality rate due to diabetes mellitus. Similarly, the Restaurant and Hotel Services sector showed a low positive correlation, implying that an increase in activity in this sector is associated with an increase in diabetes mellitus mortality rates.
Conclusion
The results of this study confirm the relevance of the postulates of the theories of demographic, epidemiological and health transition, which explain the spatial and temporal evolution of important chronic degenerative comorbidities. In the case study of diabetes mellitus in the State of Mexico between 1990 and 2015, a considerable increase in mortality rates was observed, particularly between the years 2000 and 2010. Although a slight decrease was detected between 2010 and 2015, this behavior was not uniform. Some municipalities registered increases greater than 100% in this last period, which classifies them as priority areas for public health intervention. The analysis suggests that the disease is migrating from urban to rural areas, which highlights the need for differentiated strategies based on the socioeconomic and geographic characteristics of each region.
In this regard, our statistical analyses have shown that the trend scenarios for the years 2020, 2025 and 2030 present a fluctuating pattern of behavior, as a reduction in high rates is anticipated for 2025, followed by a new rebound in 2030. This dynamic behavior highlights the need to maintain constant monitoring and the implementation of adaptive interventions that can respond to changes in the incidence of the disease.
The correlation analysis between diabetes mellitus mortality and economic sectors suggests that populations involved in the industrial and restaurant/hotel service sectors, where poor eating habits are observed, are particularly vulnerable. This reinforces the need to address not only biological factors, but also social factors in the design of preventive and long-term care policies.
Additionally, a comparison of the projected diabetes mellitus mortality rates with public data from the National Institute of Geriatrics [10] was made, confirming the consistency of the results obtained in this research. While our projection indicated a range of 128.30 to 168.46 per 100,000 inhabitants with a high classification in range 4, SIESDE reported a rate of 151.8 per 100,000 inhabitants, thus validating our trend scenarios obtained.
For future research, it is recommended to further analyze the socioeconomic factors, and incorporate environmental and cultural factors that influence the prevalence and mortality from diabetes mellitus in the state of Mexico. In particular, a focus on municipalities with high rates would allow for the identification of specific patterns and offer targeted recommendations. Factors such as poverty, access to health services, education, and local customs may be relevant in the evolution of the disease, and their inclusion in the detailed analysis would provide a comprehensive understanding of the underlying causes.
In addition, the analysis of data from local cohorts and local longitudinal studies would allow directing actions around diabetes mellitus prevention and treatment strategies, improving the effectiveness of state public health policies. The possibility of monitoring changes over time in mortality and prevalence rates would offer a dynamic view of the problem, facilitating an adaptive rather than reactive response. For these studies, it would be essential to process information from additional databases, such as national health records, economic censuses and demographic surveys, which would complement the data used in this study, offering a more complete and multidimensional overview.
Taken together, these results underline the importance of continuing research in this area, not only to project trend scenarios, but also to implement health policies that mitigate the impact of diabetes mellitus and improve the quality of life of affected populations.
References
-
Estenoz N, Gonzalez N (2006) The Family as a Means of Intervention for the Control and Prevention of Diabetes (first research report). UAEM, Toluca, Mexico.
-
(2017) World Health Organization.
-
Hernandez AM, Gutierrez JP, Reynoso NN (2013) Diabetes Mellitus in Mexico. Status of the Epidemic. Salud Publica Mex 55(2): S129-S136.
-
Omran AR (1971) The Epidemiologic Transition: A Theory of the Epidemiology of Population Change. The Milbank Memorial Fund Quarterly 49(4): 509-538.
-
Santana G (2011) Distribution and Trends of Diabetes Mellitus in the State of Mexico, using Geographic Information Systems. Master’s Degree in Spatial Analysis and Geoinformatics, UAEMex, Toluca, Mexico.
-
(2018) 2 Description of the State of Mexico. Min Environ Sus Dev pp: 1-25.
-
(2024) Deaths Mortality. Nat Health Infor System.
-
Reza C (2018) Spatial Distribution Patterns of Diabetes Mellitus in the State of Mexico and its relationship with socioeconomic factors from 1990 to 2015. In: Master’s Thesis, Autonomous University of the State of Mexico, Toluca, Mexico.
-
Economy and Productive Sectors. Instituto Nacional de Estadistica y Geografia INEGI.
-
(2018) Christus Health International Centre of Excellence and Innovation. Strategic Information System on Health, Functional Dependency and Aging SIESDE.
- Origin, Evolution, and Functional Impact of Short Insertion- Deletion Variants in Human Genomes: A Review
- Harnessing Molecular Glues for Next-Generation Vaccine, Cancer and Cardiovascular Disease Drug Development: A Comprehensive Review
- Lateral Cervical Epidermal Inclusion Cyst in a Paediatric Patient: A Rare Case Report
- Malarial Plasmodium Falciparum with Hepatitis B and C Virus Infections among Blood Donors in Ife Central Local Government Area, Ile Ife, Osun State, Nigeria
- Withanolides and Withaferin A- What’s next in Ashwagandha Research
- Designing of Dual Pulse Photoacoustic Tomography for Imaging of Drug-Response and Tumor Growth