Control of Cardiac Biomarkers Concentrations, Central Hemodynamics and Their Correlation During Gastrointestinal Bleeding
We did not observe high values of cardiac markers and changes in central hemodynamic parameters in patients with acute gastrointestinal bleeding (AGIB) and a correlation between them, this led to the decision to conduct a study. Clinical materials of 457 patients diagnosed with GIB were analyzed. Cardiac pathology was detected in 150 patients. Dynamic changes in cardiac biomarkers and central hemodynamic indicators in patients were studied in 3 stages. Phase I, period included in ICU; Stage II - 24 hours after admission to the ICU; the third stage covers the next 48 hours. The concentration troponin, BNP, myoglobin and CK-Mb was studied in the patients and it was found that although the concentration of these biomarkers was high in the first stage, these concentrations decreased and reached normal levels in the later stages of the dynamics against the background of the treatment. Dynamic changes of central hemodynamic indicators (CHI): stroke volume, cardiac minute volume, peripheral vascular resistance and myocardial oxygen demand were studied in 3 stages. It was found that although SV was low, it dynamically increased in the later stages and did not reach the normal level. This is a clear example of continued hypovolemia. Peripheral vascular resistance (PVR) from blood loss from the gastrointestinal tract was greater than normal in all three phases. PVR remained high and was statistically honest because the volume of circulating blood was not fully corrected despite the treatments. Also, the correlation between central hemodynamic indicators and cardiac markers was studied, showing that in stage I, there is a strong contrast between CMV and CK-MB; Strong straight between PVR and BNP; In stage II, strong contrast between CMV and BNP; Strongly flat between PVR and CK-MB; In stage III, the average level is between CMV and myoglobin; We proved that there is a moderate inverse correlation between PVR and cTn and it is statistically honest. Thus, although CHI was slightly less than the norm in the initial period, it normalized in the later stages, but PVR remained high in all stages. This caused a sharp increase in PVR as a compensatory response to the decrease in circulating blood volume during acute GIB. Among the cardiac markers, we associate the rise of troponin during the bleeding period with damage to postanemic, hypoxic myocardial muscles. Among the cardiac markers, a sharp increase in BNP is an indicator of the development of left ventricular failure and is associated with a sharp increase in PVR, and we also proved that there is a strong direct relationship between them.
Introduction
As the volume of circulating blood decreases during gastrointestinal bleeding (GIB), a pressure difference occurs in the heart and blood vessels, which is considered an important parameter for cardiovascular function. As blood perfusion is disrupted during bleeding from various departments of the gastrointestinal tract, it causes delays in the transport of oxygen and other important elements to each organ. This has a different effect on the blood flow in vital and auxiliary organs, causing significant disturbances in central and peripheral hemodynamic indicators [1]. Also, a decrease in the volume of circulating blood, an increase in the oxygen demand of the myocardium, is the reason that leads to acute coronary syndrome and heart failure. During our observations, we also found an increase in the concentration of cardiac markers in patients with GIB. Although cardiac biomarkers are informative markers in heart diseases, sometimes their concentration in the blood can increase due to the effects of a number of acute and chronic diseases and intoxication. Acute GIB causes disturbances in the cardiovascular system by damaging cardiomyocytes and disrupting their regulation. We did not find disturbances in central hemodynamics during GIB, changes in the concentration of cardiac biomarkers and correlative relationships between them, and we decided to study it.
Purpose
Our goal is to share our achievements by studying central hemodynamic disturbances, changes in the concentration of cardiac biomarkers and their correlations during gastrointestinal bleeding. The co-authors were given permission to write articles by the Ethics Committee based on patient histories and laboratory test statistics, while maintaining the anonymity of the patients. We are aware of the decision of the Ministry of Health of the Republic of Azerbaijan dated December 29, 2011 No. 137 on the Rules for the ethical conduct of doctors.
Materials and Methods
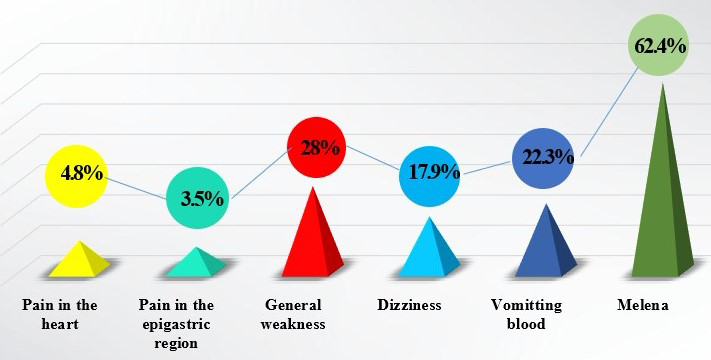
We did not find extensive information on the influence of gastrointestinal bleeding on the dynamics of cardiac biomarkers and central hemodynamic indicators and their correlative relationships in the literature we examined, and we decided to share the results obtained by studying this scientific research work. Clinical materials of 457 patients diagnosed with GIB were analyzed. History of 215 (47.04%) patients from 2015 to 2019; From 2020 to 2023 Clinical materials of 242 (52.96%) patients were retrospectively analyzed. Cardiac pathology was detected in 150 (32.82%) patients. 306 patients (66.95%) were men, 151 patients (33.05%) were women. 24 patients aged 20 to 40 years; 82 people aged 41-50 years; 136 people aged 51-60 years; 151 people aged 61-79 years; in total there were 64 people ˃80 years old. Of these, 14 patients aged 20 to 40 years took steroidal and non-steroidal drugs orally due to a history of rheumatoid arthritis and bronchial asthma. Of the 457 patients, only 210 patients (45.95%) underwent EChO; the heart rate fraction was 41.13±9.66%. In 28 (13.33%) patients who underwent EChO, hypokinesia of the posterior wall of the myocardium was noted, in 14 (6.66%) there were areas of akinesia, in 4 (1.91%) there was tricuspid insufficiency (SPAP-46 mm Hg). Patients with GIB came to the hospital with various complaints. Patients complained of melena, bloody vomiting, epigastric and cardiac pain, general weakness, and the frequency of symptoms is shown in Figure 1.
Of the 457 patients examined, 42.23% had duodenal ulcer; gastric ulcer in 22.32%; varicose veins of the esophagus in 4.6%; 15.75% had a malignant gastric ulcer; peptic ulcer of the anastomosis after gastric resection using the Billroth II method - in 5.25%; Mallory-Weiss syndrome – in 6.13%; In 1.1%, necrotic damage to the mucous membranes after a chemical burn of the esophagus, and in 2.62%, a rupture of the lower third of the esophagus caused GIB. Of the 457 patients, 194 (42.45%) had a history of medication use. Thus, antiplatelet agents were used by 180 people (39.38%), steroids-8 people (1.75%), non-steroidal drugs-6 people (1.31%). In addition, 292 patients (63.89%) had concomitant diseases. Of the 292 patients, only 150 (51.37%) had heart defectso of the patients, 369 (80.74%) patients were diagnosed with EFGDS immediately upon admission to the hospital, and 88 (19.26%) patients received appropriate therapeutic treatment. The acidity of the stomach was also studied and it was PH-6.11±0.81.
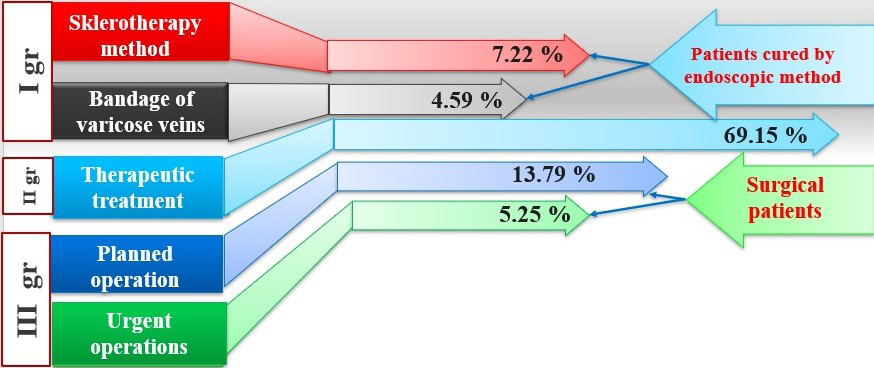
Depending on the choice of treatment tactics, patients were divided into 3 groups (Figure 2). Patients underwent EFQDS, Forest 1b was detected in 54 patients, electrocoagulation was applied to 33 patients by endoscopic method; In 21 patients, a ligature was placed on the bleeding varicose veins and these patients were classified as group-I. In 316 patients, taking into account the presence of Forest 2c and concomitant diseases, the patients were cured by conservative treatment and these patients were classified as II group. 87 of the patients underwent surgery and these patients were classified as group III. 24 of III group patients had Forest 1a, so it was urgent; 63 people had Forest 2a and planned surgery was performed. PH of the stomach was 6.11±0.81.
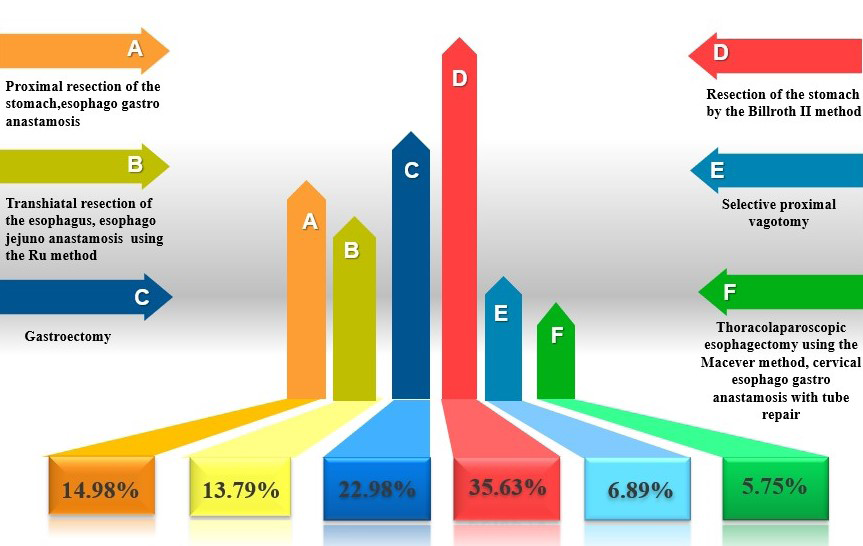
31 people of the patients underwent resection of the stomach by the Billroth II method, 13 people underwent proximal resection of the stomach, esophagogastroanastamosis, 6 people underwent selective proximal vagotomy, 12 people underwent transhiatal resection of the esophagus, esophagojejunoanastamosis using the Ru method, 5 people underwent thoracolaparoscopic esophagectomy using the Macever method, cervical esophagogastroanastamosis with tube repair, and 20 people underwent gastroectomy in Figure 3.
Statistical processing of the obtained numerical data: using the U-Wilcoxon (Mann-Whitney) rank test of quantitative indicators in the EXCEL-2010 spreadsheet, the average values and average statistical errors of the obtained parameters were calculated, and the results were summarized in tables and charts.
Results and Discussion
Dynamic changes in cardiac biomarkers and central hemodynamic indicators in patients were studied in 3 stages. Stage I, period included in ICU; Stage II - 24 hours after admission to the ICU; the third stage covers the next 48 hours. Cardiac biomarkers and enzymes in the blood can increase for various reasons: stress, inflammation, hypoxia during perfusion. Since the specificity of elevated myoglobin is low, and creatine kinase (CK-MB), cardiac troponin (cTn), the study of brain natriuretic peptide (BNP) in the early prognosis of heart failure is of great diagnostic value, which is reflected in Figure 4.
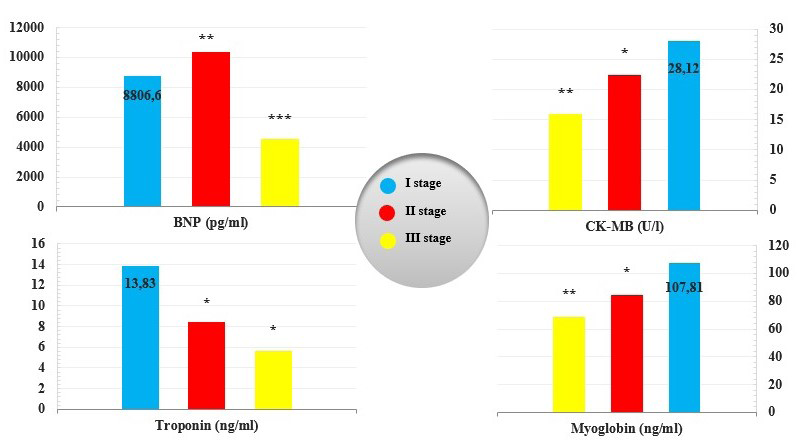
Note: The statistical integrity of the difference between indicators in patients at different stages: compared to stage I *- p1<0.05; - p1<0.01; *- p1<0.001.
We determined the concentration of brain natriuretic peptide (BNP) in blood plasma for the purpose of early diagnosis of heart failure during gastrointestinal bleeding. The concentration of BNP is normally 100-500 pg/ml. BNP in stage I was 8806.6±1328.55 pg/ml, which was 17.6 times higher than the upper limit of normal. Although the concentration of BNP increased by 1.18 times (p1<0.01) compared to stage I in stage II, this indicator decreased by 1.95 times (p1<0.001) in stage III compared to stage I, but remained 9 times higher than the upper limit of normal. CK- MB is an auxiliary cardiac marker in the diagnosis of acute myocardial infarction, with a normal range of 5-25 IU/L. In stage I, it was 28.12±3.82 pg/ml, which was 1.12 times higher than the upper limit of the norm. 1.25 times in stage II compared to stage I (p1<0.05); In stage III, it decreased by 1.4 times (p1<0.01) and reached the normal level. Troponin, specific to skeletal and cardiac muscle fibers, is released due to cardiac damage in unexpected situations such as a heart attack. Troponin (cTn) increases in the blood during heart disease and related damage. Normal is <1 ng/ml. In stage I, the troponin concentration was 13.83±2.07 ng/ml, which was 14 times higher than normal. In stage II, the cTn concentration decreased by 1.64 times (p1<0.05) during treatment, but remained 8.4 times higher than normal. Although the cTn concentration at stage III decreased by 2.45 times (p1<0.05) compared to stage I, it remained 5.6 times higher than normal and was statistically significant.
Myoglobin is considered a potential marker of cardiac muscle damage and assessment of cardiac function. Normal blood myoglobin values are 25-72 ng/ml. Myoglobin in stage I was 107.81±8.71 ng/ml, which was 1.49 times higher than the upper limit of normal. At stage II, compared to stage I, the dynamics decreased by 1.28 times (p1<0.05), but remained above the upper limit of normal by 1.17 times. At stage III, the cTn concentration decreased 1.57 times (p1<0.01) compared to stage I and was within the normal range, which is statistically significant. Acute blood loss during GIB, as with any sufficiently massive bleeding, leads to the development of a discrepancy between the reduced mass of circulating blood and the volume of the vascular bed, which leads to a decrease in total peripheral vascular resistance (PVR), cardiac minute volume (CMV) and caused a decrease in the index accent, disturbance of central hemodynamics, sharp increase in myocardial oxygen demand (MOD) (Table 1).
| Indicators | I stage | II stage | III stage |
|---|---|---|---|
| Stroke volume (ml) | 42.73±10.29 | 54.22±13.49** | 58.05±15.92* |
| Cardiac minute volume (l/min) | 3.01±1.08 | 4.53±1.38* | 5.36±1.59*** |
| Peripheral vascular resistance (din x min x cm-5) | 1630±333,35 | 1818±411,6** | 2026±544,25*** |
| Myocardial oxygen demand (CU) | 19.2 ±11.2 | 12.22 ±2.34** | 9.2 ±1.2* |
Table 1: Dynamics of central hemodynamic indicators in patients with GIB.
Note: The statistical integrity of the difference between the indicators in different stage in patients: compared to stage I *- p1<0.05; - p1<0.01; *- p1<0.01.
In cardiovascular physiology, stroke volume (SV) is the volume of blood pumped from the left ventricle per beat, normally 70-120 ml. In stage I, SV was -42.73±10.29 ml, which was 2.81 times less than the upper limit of the norm. 1.27 times SV dynamics in stage II compared to stage I (p1<0.01); Although it increased 1.36 times (p1<0.05) in stage III, it did not reach the normal level. Cardiac minute volume (CMV) is the portion of the minute volume of blood that is ejected from the heart as a result of its contraction, normally 3.5-5 l/m. CVM in stage I was 3.01±1.08 l/min. 1.5 times in stage II compared to stage I (p1<0.05); In stage III, it was 1.78 times more (p1<0.001). Peripheral vascular resistance (PVR) is 900-1500 din x min x cm-5, which creates blood pressure and blood flow in the circulatory system, and is also a component of heart function. In stage I, it was 1630±333.35, which was 1.1 times higher than the upper limit of the norm. Compared to stage I, PVR in stage II dynamics is 1.2 times (p1<0.001); In stage III, it increased by 1.25 times (p1<0.01) and remained 1.35 times higher than the upper limit of the norm and is statistically honest.
During acute GIB, as the amount of blood directed by the coronary arteries decreases, the oxygen supply to the myocardium also decreases and causes an increase in demand. Myocardial oxygen demand (MOD) is the amount of oxygen required to maintain optimal heart function and is normally 8-10 conventional units. In stage I, the indicator of MOD was 19.2±11.2 CU, which was 1.92 times higher than the upper limit of the norm. As a result of the measures taken, compared to the first stage, the MOD decreased by 1.57 times (p1<0.01) in the second stage, but remained 1.2 times higher than the upper limit of the norm. Already in the III stage, compared to the I stage, it decreased 2.1 times (p1<0.05) and reached the normal level. Correlation between central hemodynamic indicators and cardiac markers in patients was also studied. It was found that in stage I, there is a strong contrast between SV and CK-MB (r= - 0.94; t=2.7; p1<0.01) (P1); There is a strong linear correlation between PVR and BNP (r= 0.87; t=2.4; p1<0.01) (P2) and is statistically honest.
Strong contrast between SV and BNP in stage II (r= -0.7; t=2.8; p1<0.01) (P3); There is a strong linear correlation between PVR and CK-MB (r=0.82; t=2.5; p1<0.01) (P4) and is statistically honest. In the III stage, the average level between CMV and myoglobin (r=0.62; t=9.8); A moderate inverse correlation (r=-0.5; t=23.3) was found between PVR and cTn and is shown in Figure 5.
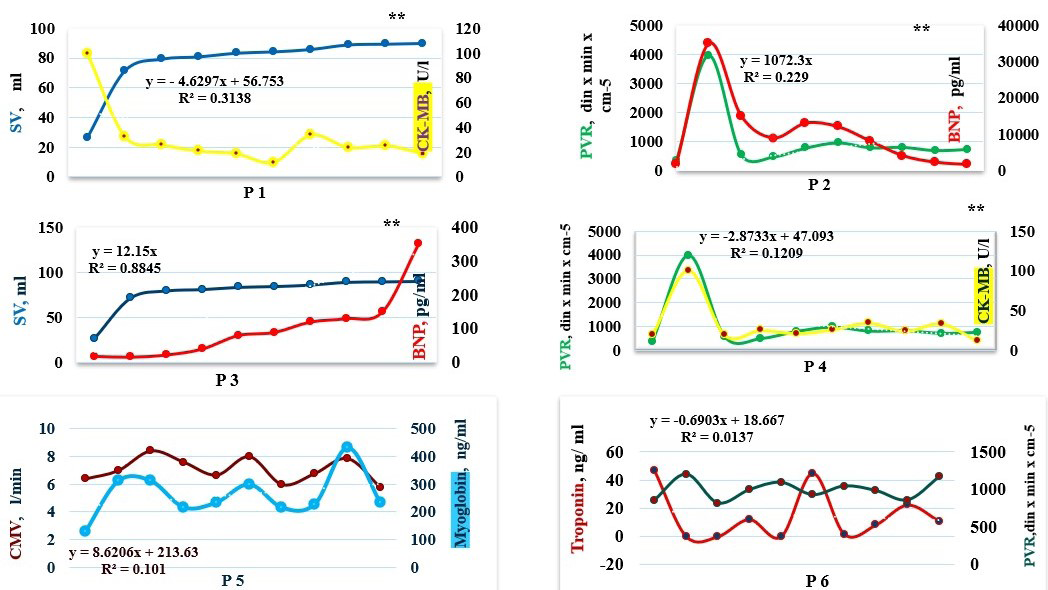
Note: Correlation coefficient between central hemodynamic indicators and cardiac biomarkers in patients at stage I and the statistical integrity of the difference between them: *-p˂0.05; -p˂0.01; *-p˂0.001. Straight weak (r=0- 0.5); straight average (r=0.5-0.7); straight strong (r=0.7- 1.0). Reverse weak (r=0-(-0.5)); reverse mean (r=-0.5-(- 0.7));reverse strong (r=- 0.7-(-1.0)).
Results
Although the concentration of cardiac markers: troponin, BNP, myolobin and CK-Mb was high in the first stage, these concentrations decreased and reached the normal level in the later stages of the dynamics against the background of the treatment. Among the central hemodynamic indicators, SV was 2.81 times less than the upper limit of the norm in the I stage, 1.27 times in the II stage dynamics, and 1.36 times in the III stage, but did not reach the normal limit. This is a clear example of continued hypovolemia. Peripheral vascular resistance (PVR) from blood loss from the gastrointestinal tract was greater than normal in all three stages. Peripheral vascular resistance remained elevated (p1<0.001) and statistically significant because the circulating blood volume was not fully corrected despite the treatments. Due to the decrease in HB, which transports oxygen, due to the decrease in circulating blood volume during GIB, the oxygen supply to the myocardium also decreased and led to an increase in demand. Also, the correlation between central hemodynamic indicators and cardiac markers was studied, that in stage I, a strong contrast between SV and CK-MB; Strong flat between PVR and BNP; In stage II, a strong contrast between SV and BNP; Strongly flat between PVR and CK-MB; In stage III, the middle is flat between CMV and myoglobin; We proved that there is a moderate inverse correlation between PVR and cTn and it is statistically honest.
Discussion
Miaomiao Li, Yıldız T. and co-authors studied the concentration of cardiac biomarkers: BNP, troponin CK- MB and lactate dehydrogenase when admitted to the hospital with the diagnosis of cirrhotic ascites, acute GIB and acute chronic liver failure. Despite the absence of heart disease in the patients, initially the concentration of these biomarkers was much higher than normal [2, 3]. Lindahl B and co-authors prove in their research that if a high level of troponin concentration is accidentally detected in the blood during any disease and no change in ST segments is detected in the patient’s ECG, it should be considered myocardial damage as a complication of the disease [4]. Peetz D, proved in his research that ischemic heart disease was 50% of mortality in patients with chronic renal failure on long-term hemodialysis. If troponin is high in patients with chronic renal failure undergoing long-term hemodialysis, this is already a sign of coronary heart disease [5]. Thus, although cardiac biomarkers were high in the initial stage, they decreased in dynamics in the later periods. Also, although CHI was slightly less than normal in the first four, but normalized in later stages, PVR remained high in all stages. This led to a sharp increase in PVR as a compensatory response to the decrease in circulating blood volume during acute GIB. Elevation of cardiac markers troponin during bleeding is associated with damage to postanemic, hypoxic myocardial muscles. Among the cardiac markers, a sharp increase in BNP is an indicator of the development of left ventricular failure and is associated with a sharp increase in PVR, and we have proven a strong direct relationship between them.
References
-
Scully CG, Daluwatte C, Marques NR, Khan M, Salter M, et al. (2016) Effect of hemorrhage rate on early hemodynamic responses in conscious sheep. Physiol Rep 4(7): e12739.
-
Li M, Guo Z, Zhang D, Xu X, Romeiro FG, et al. (2020) Correlation of Serum Cardiac Markers with Acute Decompensating Events in Liver Cirrhosis. Gastroenterol Res Pract, pp: 4019289.
-
Yıldız R, Yıldırım B, Karincaoğlu M, Harputluoğlu M, Hilmioğlu F (2005) Brain natriuretic peptide and disease severity in patients with nonalcoholic cirrhosis. Journal of Gastroenterology and Hepatology 20(7): 1115-1120.
-
Lindahl B, Venge P, Wallentin L (1998) The FRISC experience with troponin T. Use as decision tool and comparison with other prognostic markers. Eur Heart J 19(Suppl N): N51-N58.
-
Peetz D, Schütt S, Sucké B, Faldum A, Wandel E, et al. (2003) Prognostic value of troponin T, troponin I, and CK-MBmass in patients with chronic renal failure. Med Klin (Munich) 98(4): 188-192.
- Editorial on Multimodal Analgesia
- Surgical Incision Site Local Anaesthetic Infiltration and Superior Hypogastric Plexus Block in Total Abdominal Hysterectomy Under General Anaesthesia- A Placebo-Controlled, Randomized Clinical Trial
- Supraglottic Airway Insertion in Semi Fowler Position Due to Severe Thoracic Hyperkyphosis: A Case Report
- Anaesthetic Management of Cardiac Myxoma Patient with Systemic Involvement: A Case Report
- Current Problems in Pulmonary Respiratory Distress Syndrome (Literature Review)
- Evolution of Perioperative Hemodynamic Monitoring from the Hand on Pulse to Hypotension Prediction Index