Carbohydrate Deficient Transferrin (CDT) as a Biomarker to Assess Drinking in High-Risk Drink Drivers
The diagnostic value of biomarkers of alcohol consumption differs dependent upon the population under investigation. In this regard, clarification is needed in the choice of biomarker used to aid the medical assessor support a return to driving after a drink-driving offence. Blood samples were collected (5mL serum and 3.5mL whole blood EDTA) to measure carbohydrate deficient transferrin (%CDT) as a biomarker of alcohol consumption compared to gamma glutamyl transferase (GGT), mean corpuscular volume (MCV), aspartate aminotransferase (AST), and alanine aminotransferase (ALT). Subjects were recruited to reflect the characteristics of a high-risk drink driving community in the United Kingdom. The ICD-10 or the Alcohol Use Disorders Identification Test (AUDIT) was used to diagnose an alcohol use disorder. 358 participants were recruited: 165 seeking treatment for harmful use or alcohol dependence: 142 seeking treatment for liver, diabetes or obesity problems: and 51 social drinkers (controls). %CDT was able to identify drinking indicative of excessive alcohol intake significantly more accurately than other biomarkers (Z=-9.017, p<0.001). The positive predictive value for %CDT (+ve PPV 0.88) demonstrated the best diagnostic power when tested compared to GGT (+ve PPV 0.69), inclusive of confounders. When the whole study population was taken into account the sensitivity and specificity of %CDT for the diagnosis of excessive alcohol use remained unchanged (area under curve 0.91) whereas the diagnostic power of GGT was poorer (area under curve 0.80). %CDT was superior to GGT as a marker of excessive alcohol consumption (continuous drinking) when tested against a population that included diabetic, obese and patients with non-alcoholic liver disease: a data set which bests mimics those seen in the high-risk drink driving population.
Introduction
Driving a motor vehicle is a complex multifunctional task involving visual search and recognition, vigilance, information processing under variable demand, decision- making, risk-taking and enough sensory-motor control to carry out all these activities correctly [1]. Driving has become a daily activity for most people in developed countries and although traffic accidents have many different causes, most cases involve human factors, the most common being ‘driving under the influence’ (DUI) of alcohol [2, 3, 4]. Large proportions of apprehended drivers are often repeat offenders and the prevalence of heavy drinkers is high amongst repeat offenders [5]. Identification of continuous drinking in high-risk drivers therefore has important traffic-safety, health, social, legal and economic ramifications for both the individual and society [6, 7, 8, 9, 10]. Owing to judicial issues, alcohol consumption is not always accurately reported and evidence of voluntarily under-reporting has been documented [11].
Although biomarkers are often considered to be an objective, gauge of alcohol consumption [8, 12, 13] they vary in efficacy according to different parameters, the individual concerned and the collection site, such that a gold standard for the identification of continuous drinking has to date been elusive. The diagnostic sensitivity of biomarkers depends on the time since the last drink. Problematic alcohol consumption is usually diagnosed on the basis of clinical history; self-reported or collateral information about alcohol consumption and biomarker tests.
Disqualified drink-drivers in the UK are placed on a high-risk offender scheme (HRO) and must attend an independent medical assessment for re-licensing. Four biomarkers are commonly used to aid assessment of continuous drinking in high risk drink-drivers: gamma glutamyl transferase (GGT); mean cell volume (MCV); aspartate aminotransferase (AST); and alanine aminotransferase (ALT). Problems exist in the interpretation of these biomarkers since medical and life- style factors (non-alcoholic liver disease, smoking, excess body weight and low physical activity) are known to confound the test results [14]. Carbohydrate deficient transferrin (%CDT) has been identified as a potential alternative measure [15, 16, 17, 18, 19].
In this study we sought to determine, the diagnostic efficacy (sensitivity and specificity) of %CDT compared to GGT, MCV, ALT and AST as a biomarker for the detection of continued alcohol consumption in sub-populations characteristic of those wishing to apply for a new license after a drink-driving offence.
Materials and Methods
The methods section includes participants, definitions, procedures, analysis of biomarkers and statistical analysis.
Participants
Participants were recruited from clinics for the treatment of alcohol problems (2 inpatient units for severely alcohol dependent individuals (unit 1 and 2) and 2 specialist out-patient, drug and alcohol services (unit 3 and 4) for those with problematic alcohol use) based at the South London & Maudsley NHS Foundation Trust (SLaM), London, UK. Patients were also recruited from 3 distinct hospital populations within King’s College Hospital (KCH) NHS Foundation Trust, London to investigate the extent to which medical factors might confound the test results: unit 5 (the Institute of Liver Studies) a referral centre for hepatobiliary disease, autoimmune liver disease, viral hepatitis and hepatic cancer; unit 6 (the Diabetic Clinic) providing treatment for either Type 1 or Type 2 diabetes and; unit 7 (the obesity clinic) providing treatment for morbidly obese (BMI of ≥40) patients. A control group of social drinkers was also recruited who volunteered through a dedicated recruitment service based at King’s College London. The study was approved by the local Research Ethics Committee at SLaM/IOP and KCH and all subjects gave informed written consent.
Definitions
Subjects were recruited according to the following criteria: Social drinkers: individuals drinking ≤ 2-3 units of alcohol/day and who did not become intoxicated. Recruits would typically drink below weekly limits set at ≤14 units for females and ≤21 units for males and included binge drinkers defined as whose consuming ≥8 units at one time for males and ≥6 units at one time for females in a single session [20, 21]. Hazardous Drinkers (increased risk drinking): individuals drinking above safe levels but below those defined for harmful drinkers. This pattern of alcohol consumption is not a diagnostic term. Harmful drinkers (high-risk drinking): individuals drinking over the medically defined limits i.e., > 50 units Wolff K, et al. Carbohydrate Deficient Transferrin (CDT) as a Biomarker to Assess Drinking in High-Risk Drink Drivers. Adv Clin Toxicol 2019, 4(3): 000160.
(400g) of alcohol/week for males and 35 units (280g)/week for females [22]. Dependent drinkers: individuals who displayed a compulsion to drink and showed evidence of physical dependence (tolerance) and an inability to stop drinking despite harm to self [22, 23]. Drivers become high-risk drink drivers for the following offences:
High-risk drink drivers
Individuals convicted of two drink-driving offences within 10 years; driving with an alcohol concentration of ≥ 87.5 mg/100 mL breath, 200 mg/100 mL blood, or 267.5 mg/100 mL urine and; refusal to give a sample of breath, blood or urine to test for alcohol at the roadside or for evidential testing.
Procedures
Bespoke self-report questionnaires were designed for the study incorporating both tailored questions and standardised measures and were used for all recruitment units, to gather socio-demographic data, driving and drug- use history, as well as recent alcohol consumption. Each subject provided measurements in order to establish the Body Mass Index (BMI): calculated as weight in kilograms divided by the square of the height in meters (kg/m2). For the laboratory investigations a blood sample (including 5mL serum and 3.5mL whole blood EDTA) was collected from patients and from the volunteers during the day at a pre-specified test site. Blood samples were transported to KCH for routine analysis.
Analysis of Biomarkers
The following biomarkers of alcohol consumption were determined for all subjects using standard laboratory methods on the Advia 2400 analyser (Siemens Medical Diagnostics, Frimley, UK): GGT with assay imprecision being 4.4% at 31 IU/L and 1.4% at 128 IU/L (reference range 1-55 IU/L); AST with imprecision being 4.9% at 58 IU/L and 4.5% at 115 IU/L (reference range 10-50 IU/L); ALT laboratory imprecision was 3.7% at 25 IU/L and 1.1% at 137 IU/L (reference range 5-55 IU/L); MCV an index of red blood cell size, reference range 79-96 fL, was measured using the Advia 2120 analyser (Siemens Medical Diagnostics, UK) and %CDT was measured using an automated capillary electrophoresis method (Sebia Ltd, Camberley, UK) [7, 24, 25]: <2.1%CDT low alcohol intake, 2.2-2.9% CDT high alcohol intake, >3% CDT excessive alcohol intake.
Statistical Analysis
All data were coded and analysed using the statistical programme SPSS for Windows (version 22.1.4). For continuous data, means and standard deviations (SD) were presented except when the data was not normally distributed, in which case medians and ranges were given. Independent t-tests were used when comparing means for normally distributed continuous data, the Mann- Whitney test was used when the distribution appeared skewed and 95% CI was given for the difference in means. For categorical data, Chi-square test was used. ANOVA, t- tests, and chi-squared analyses were used on demographic and other key variables. Kruskal-Wallis ANOVA differences were calculated between the subject groups for all the analytes tested (p<0.001). We constructed ROC (receiver operating characteristics curves) curves and calculated the area under the ROC curve (AUC) to compare the specificity and sensitivity of the different biomarkers. We calculated the predictive value (PV) for a positive test result (PPV) that is the percentage of all positive results that are true positives and the PV for a negative result (NPV), as the percentage of all negative results that are true negative. Likelihood ratios (LRs) were used to express the odds that a given finding (test result) would occur in a given subject with, as opposed to without, a particular condition. The LR for a given test result is given by, LR+ve = sensitivity/ (1- specificity) and LR-ve = specificity/(1-sensitivity).
Results and Discussion
In Table 1 the demographics for the entire study population are presented.
Demographics
It is well established that biomarker measurements are an important aid to assess recent alcohol consumption and are valuable for the identification of problematic drinking behaviour in known drinking populations [26, 27, 28, 29]. However, in the general population some biomarkers are less effective because of confounding factors, which affect biomarker results such as obesity, diabetes and hypertension: Conditions which are commonly found in the general population from which drink drivers emerge. For instance, the National Health Interview Survey in America in 2011 reported that 52% of adults were current regular drinkers, whereas based on estimates of body mass index, 28% were obese, 24% of adults had hypertension and, 9% had been diagnosed with diabetes [30].
Wolff K, et al. Carbohydrate Deficient Transferrin (CDT) as a Biomarker to Assess Drinking in High-Risk Drink Drivers. Adv Clin Toxicol 2019, 4(3): 000160.
In our study we sought to recruit participants to replicate a general population. A total of 408 participants were recruited, of which 38 were excluded (incomplete questionnaires or insufficient blood for analysis) leaving 358 subjects: 165 with a diagnosis of harmful or dependent alcohol use currently in treatment services and 51 social drinkers (controls). The 358 subjects had a mean age of 45.7 years (range 18.7 – 81.7 years), half were male (53.1 %) and were mainly of white British ethnicity (77.9 %). Male and female subjects were matched for age, ethnicity (using 2 groups, black British and white), and BMI, if subjects from the obesity clinic were excluded (Table 1). The subjects also included those with conditions known to increase the risk of false positive test results with liver function tests: 142 currently seeking treatment for liver, diabetes or obesity problems.
| Parameter | Descriptor a | Whole Sample – All units | ||||||
|---|---|---|---|---|---|---|---|---|
| Age | Years | 45.7 (14.0) | ||||||
| Gender | Male (%) | 190 (53.1) | ||||||
| Female (%) | 168 (46.9) | |||||||
| Ethnicity* | White (%) | 279 (78.8) | ||||||
| Black (%) | 50 (14.1) | |||||||
| Other (%) | 25 (7.0) | |||||||
| Cigarette Smokers | Number of smokers (%) | 157 (43.5) | ||||||
| Mean No cigarettes per day | 22.8 (15.4) | |||||||
| BMI | Mean | 27.1 (9.0) | ||||||
| Range | 14.4-75.4 |
Table 1: Demographics for the entire population of participants (all sites).
*4 missing questionnaire responses *The data are expressed as the mean (SD), unless noted otherwise.
Driving Behaviour
Just over a third of the total subject population (38.8%) were current drivers and had car insurance (32.1%) although more, about half (49.2%) held a driver’s licence. Questions on driving offences revealed that 19% (n=68) of the group had at some time been banned from driving, and of these 31% (n=21) reported driving whilst banned. One third (31.6%) of our sample had been breathalysed between 1 and 5 times. Twenty percent of subjects had had a positive breath test (n = 70) and of these, all but 7 (90%) had been convicted of drink-driving (range 1-10 times); the most recent conviction occurring nine years previously. Of the entire sample, 30% had ever been in a car accident, 30 of whom reported that this accident was as a result of drink-driving. Over half of the subjects who had been in a car accident were recruited from the alcohol treatment populations (54%). Subjects from the alcohol treatment sites were significantly more likely to have been convicted of drink-driving (χ2 = 84.3, p<0.001); to have had an accident as the result of drink- driving (χ2 = 35.6, p<0.001) and to have had a positive breathalyser test (χ2 = 82.2, p<0.001). The provision of education on drinking and driving to alcohol treatment populations is clearly an area that merits future attention.
Drinking Behaviour
A 2007 report from the North West Public Health Observatory (NWPHO) estimated that 1.55 million people in England consume alcohol at harmful levels and a further 6.3 million drink at hazardous levels [31]. Drinking behaviour across the three key populations: the alcohol subjects (G1), the control group of social drinkers (G2) and the special general hospital groups (G3) was significantly different as intended. Compared to the social drinkers and the special hospital treatment groups the alcohol treatment subjects drank alcohol on significantly more days (χ2 = 310.3, p<0.001) and consumed significantly more units of alcohol on an average day (χ2 = 287.7, p <0.001) in the preceding month. The alcohol treatment subjects drank significantly more than the social drinkers; drinking on twice as many days per month (29.9±0.79 days out of 30, t = 7.67, p< 0.001) and almost 7 times as many units (36.4 ± 19.4 units/day, Z =- 10.67 p < 0.001). Within the alcohol subjects (G1) there was no difference in the number of days that alcohol was consumed in the preceding month (range 20 - 30 drinking days/month for each clinic). However, there was a significant difference in the amount (number of units) of alcohol consumed in an average drinking day (F = 4.7, p<0.01), with subjects from the inpatient units drinking Wolff K, et al. Carbohydrate Deficient Transferrin (CDT) as a Biomarker to Assess Drinking in High-Risk Drink Drivers. Adv Clin Toxicol 2019, 4(3): 000160.
significantly more (42.6 ± 17.6 units/day) than those from the community-based units (26.7 ± 18.4 units/day). Within the special general hospital populations, there was also a significant difference between groups with the liver patients least likely to drink alcohol at all (F = 4.2, p<0.05) and the diabetes subjects drinking on significantly more days in the preceding month compared to the obesity group.
Biomarkers of alcohol use
Without exception each of the biomarkers was significantly elevated above the normal reference range in the alcohol treatment subjects compared to the social drinkers: AST and ALT (Z = -7.791, P<0.001 and Z = - 8.850, P <0.001, respectively) and; GGT (Z =-8.984, P<0.001). MCV was marginally raised when compared to the normal reference range (79-96 fL), but values were significantly different from the social drinkers (Table 2).
| Biomarker | Group | Mean (SD) | Median | Range | Test | P | ||||||||||||||
|---|---|---|---|---|---|---|---|---|---|---|---|---|---|---|---|---|---|---|---|---|
| AST (IU/L) | G1 | 118.6 (141.3) | 61.8 | 18 – 831 | ˇ Z= -8.850 | <0.001 | ||||||||||||||
| G2 | 23.9 (9.3) | 21.4 | 14-62 | |||||||||||||||||
| G3 | 39.3 (32.6) | 28.5 | 10 – 220 | ¨ 2 - 114.1 | < 0.001 | |||||||||||||||
| ALT (IU/L) | G1 | 68.1 (67.1) | 46.7 | 9 – 604 | ˇ Z= -7.791 | <0.001 | ||||||||||||||
| G2 | 21.5 (13.9) | 18 | 10 – 96 | |||||||||||||||||
| G3 | 41.1 (44.2) | 29.5 | 12 – 375 | ¨2 = 78.5 | <0.001 | |||||||||||||||
| GGT (IU/L) | G1 | 405.8 (600) | 157 | 9 – 3408 | ˇ Z=-8.984 | <0.001 | ||||||||||||||
| G2 | 27.3 (33.6) | 18.2 | 6 – 190 | |||||||||||||||||
| G3 | 91.9 (159.8) | 43.5 | 8 – 1349 | ¨2 = 117.6 | <0.001 | |||||||||||||||
| %CDT | G1 | 5.4 (3.4) | 4.4 | 1.6 – 20.2 | ˇ Z=-9.017 | <0.001 | ||||||||||||||
| G2 | 2.0 (0.5) | 1.84 | 1.2 – 3.5 | |||||||||||||||||
| G3 | 2.1 (0.7) | 1.9 | 1.4 – 5.4 | ¨2 - 178.3 | <0.001 | |||||||||||||||
| MCV (fL)* | G1 | 96.8 (6.7) | 97 | 68.6 – 131.5 | ˇ T=9.92 | <0.001 | ||||||||||||||
| G2 | 89.1 (4.1) | 89.3 | 77.4 – 99 | |||||||||||||||||
| G3 | 87.6 (7.2) | 87.2 | 63.9 – 106.6 | ¨F = 28.1 | <0.001 |
Table 2: Comparison of the measurement of biological markers of alcohol consumption for the alcohol subjects (G1) and social drin
*Equal variances not assumed; ˇ Comparisons for Group 1 vs. Group 2; ¨Comparison for all groups, 1, 2 and 3.
GGT is a sensitive marker of excessive alcohol consumption and historically widely used as an indicator of continuous alcohol uses [32, 33, 34, 35], although variability in the response to alcohol use has been recognised more recently [36]. We found plasma GGT activity was significantly raised (Z=-8.984, P<0.001) in G1-alcohol treatment subjects (except out-patient unit 4) compared to the control group of social drinkers (G2). However, GGT is a non-specific indicator of liver damage and cannot differentiate between liver disease originating from alcohol or non-alcohol-related origins. Accordingly, we observed participants with acute and chronic hepatitis and pancreatitis had elevated GGT concentrations (median GGT 75.5 IU/L).
The validity of GGT in the identification of continuous drinking in a general population has long-since been queried because of confounding conditions such as when patients are prescribed anticonvulsant drugs, due to enzyme induction [37]. False positive results for GGT have also been linked to obesity, hypertension, Type 2 diabetes and signs of steatosis [38, 39]. GGT concentrations in our obesity clinic subjects (mean BMI >48.9) and in the diabetic clinic where some subjects were obese (mean BMI 31.4) were within the normal range, although GTT concentrations were elevated in the overweight subjects from the liver clinic (mean BMI 27.1), but this was likely influenced by non-alcoholic liver disease.
GGT values were significantly elevated above the normal reference range in the alcohol dependent subjects (inpatient Unit 1, mean 477 IU/L and Unit 2 mean 477 IU/L respectively; and community-based Unit 3 mean 122 IU/L and unit 4 mean 326 IU/L). They were also raised in Wolff K, et al. Carbohydrate Deficient Transferrin (CDT) as a Biomarker to Assess Drinking in High-Risk Drink Drivers. Adv Clin Toxicol 2019, 4(3): 000160.
the Liver clinic (mean 165 IU/L). Figure 1 (Box Blot 1) shows GGT concentrations were significantly higher than the median from the diabetic and obesity subjects and the median GGT for the social drinkers (controls) was significantly lower than that of any of the other groups. In Figure 1 (Box Plot 2) the median %CDT was increased in the drinking treatment populations (Inpatient unit 1, mean 6.0 %CDT, unit 2, mean 5.1 and the community- based unit 3, mean 6.4 %CDT) but was within the normal reference range for all other participants.
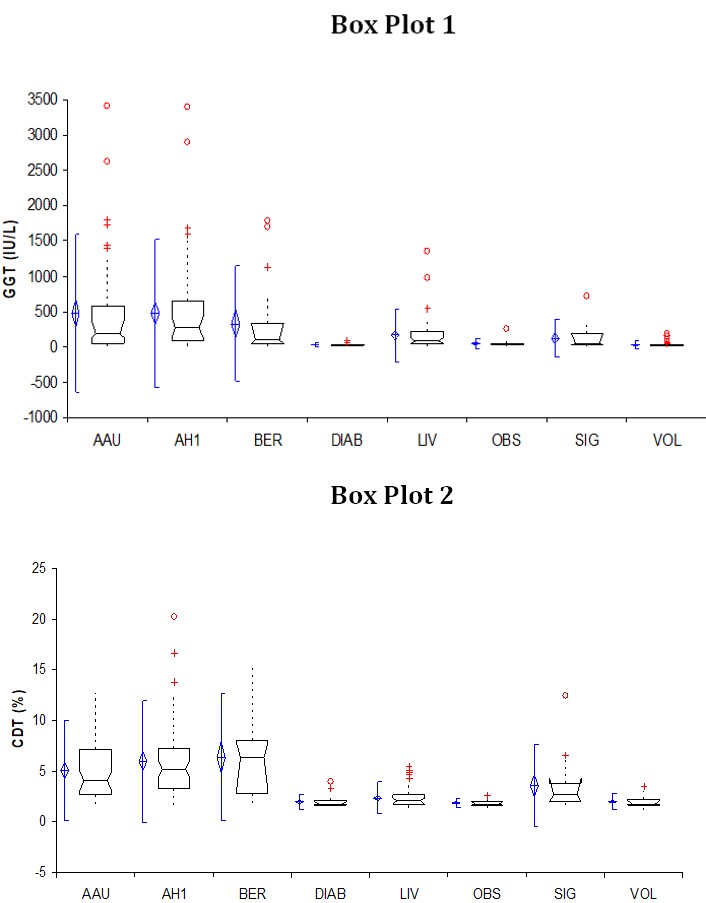
Figure 1: Box Plot 1 and 2 visualises the results for GGT and %CDT across the different sub populations, respectively: ° denotes outliers, denotes the mean and standard deviation, ‡ multiple results, …… denotes subjects outside the 25th or 75th inter quartile range, the box denotes the median and the lower (25th ) and upper (75th ) inter quartile range.
Key: AAU, unit 2; AH1, unit 1; BER, unit 3; DIAB, Diabetes clinic; LIV, Liver clinic; OBS, Obesity clinic; SIG, unit 4 and; VOL, social drinkers (control group) Our results indicate that MCV as a biomarker of continued drinking was poor (0.57) when compared to GGT (0.73) and %CDT (0.76). These findings confirmed earlier work that highlighted the high risk of false positive findings with this biomarker, although more recent research suggest alcohol metabolic genotypes may play a role in its performance [40, 41]. MCV was found to have good specificity (0.96) for the identification of an alcohol use disorder when the alcohol treatment and the social drinking groups were compared. Our findings suggest that MCV cannot be recommended as a sole primary screening test for high risk drink-drivers. It is noteworthy that MCV had a positive predictive value of 0.83 and should be seen as complementary to %CDT, particularly for female populations.
AST was significantly raised above the reference range in our participants recruited from G1-alcohol treatment subjects (except out-patient unit 4) but was within normal ranges for the control group of social drinkers (G2) and the special general hospital groups (G3). This was predicted: AST is present in cytosolic and mitochondrial forms whilst ALT is cytosolic and alcohol is believed to result in functional damage to hepatic mitochondria [42]. Aminotransferase elevations are frequently the first finding in hepatocellular reactions to drugs and toxic agents. Indeed AST tends to be raised in drug users (especially those who use crack cocaine) due to underlying muscle myopathy [43]. The use of crack cocaine may well have been a contributing factor for the high AST (73.0 IU/L) value reported for Unit 2 participants and could be an important confounder in young male high risk drivers. Both ALT and AST were elevated with increased alcohol consumption but these biomarkers did not demonstrate sufficient sensitivity (0.42 and 0.59) to be used as sole indicators of continuous drinking.
Research suggests that %CDT is a potentially valuable tool to use in alcohol treatment and problematic drinking in adolescents. It has been recently suggested as an effective monitoring tool to indicate changes over time in binge drinking [44]. In our study, %CDT concentrations in the alcohol treatment groups was significantly higher compared to the other sub-groups (Z=-9.017, p<0.001) reflecting excessive alcohol intake (%CDT >3 %), (Table 2).
Predictive value
The predictive value (PV) was used to determine how each biomarker would perform in our participants (selected to represent a normal general population from Wolff K, et al. Carbohydrate Deficient Transferrin (CDT) as a Biomarker to Assess Drinking in High-Risk Drink Drivers. Adv Clin Toxicol 2019, 4(3): 000160.
which high-risk drink driver emerge). The risk of false positive test results (positive predictive value (+ve PPV)) was comparable for %CDT (negative predictive value (+ve PPV), 0.98) and GGT (+ ve PPV 0.95). Similarly, the Table 3, 3a, 3b: Comparison of the sensitivity and specificity of different biomarkers in identifying alcohol consumption: in the alcohol treatment groups (G1) and the social drinkers (control) (G2). In Table 3a, the whole population, G1, G2, and G3 combined, and in Table 3b, in the alcohol treatment groups (G1) and the specialist general hospital groups (liver, obesity and diabetes) (G3).
percentage of all negative results that were true negatives for %CDT and GGT (-ve PPV 0.41 versus –ve PPV 0.54) were alike (Table 3).
| Biochemical Test | S | ensitivit | y | S | pecificit | y | Positive Predictive Value | Negative Predictive Value | L | R +V | E | L | R-V | E | ||||||
|---|---|---|---|---|---|---|---|---|---|---|---|---|---|---|---|---|---|---|---|---|
| AST | 0.59 | 0.94 | 0.97 | 0.42 | 10.1 | 0.43 | ||||||||||||||
| ALT | 0.42 | 0.96 | 0.97 | 0.34 | 0.97 | 0.34 | ||||||||||||||
| GGT | 0.73 | 0.92 | 0.95 | 0.54 | 6.49 | 0.22 | ||||||||||||||
| %CDT | 0.76 | 0.88 | 0.98 | 0.41 | 14.55 | 0.45 | ||||||||||||||
| MCV | 0.55 | 0.96 | 0.98 | 0.41 | 13.81 | 0.47 | ||||||||||||||
| Table 3a | ||||||||||||||||||||
| AST | 0.59 | 0.85 | 0.78 | 0.71 | 4.09 | 0.47 | ||||||||||||||
| ALT | 0.42 | 0.89 | 0.75 | 0.64 | 3.65 | 0.66 | ||||||||||||||
| GGT | 0.73 | 0.69 | 0.67 | 0.75 | 2.38 | 0.39 | ||||||||||||||
| %CDT | 0.76 | 0.88 | 0.85 | 0.81 | 6.41 | 0.27 | ||||||||||||||
| MCV | 0.57 | 0.9 | 0.83 | 0.71 | 5.62 | 0.48 | ||||||||||||||
| Table 3b | ||||||||||||||||||||
| AST | 0.59 | 0.82 | 0.8 | 0.64 | 3.37 | 0.49 | ||||||||||||||
| ALT | 0.42 | 0.86 | 0.77 | 0.56 | 2.96 | 0.68 | ||||||||||||||
| GGT | 0.73 | 0.61 | 0.69 | 0.66 | 1.88 | 0.43 | ||||||||||||||
| %CDT | 0.76 | 0.88 | 0.88 | 0.76 | 6.38 | 0.27 |
Predictive value (PV) is the ability of a test to identify a specific condition depends on the prevalence of the condition in the population being studied. PPV+ve, the PV for a positive result, is the percentage of all positive results that are true positives and PPV-ve, the PV for a negative result, is the percentage of all negative results that are true negatives. Likelihood ratio’s (LRs) used to express the odds that a given finding (test result) would occur in a given subject with, as opposed to without, a particular condition. The LR for a given result is given by LR+ve = sensitivity/(1- specificity) and LR-ve = specificity /(1- sensitivity) However, when the whole population was considered (G1, G2 and G3) %CDT exhibited the same diagnostic power across all groups whereas GGT showed a distinct fall in specificity and positive predictive value (Table 3a). Additionally, when comparing the alcohol treatment sub- population groups with the special general hospital sub- populations (liver, diabetes and obesity), %CDT exhibited the same diagnostic power, whereas GGT showed a distinct fall in specificity (0.88 vs. 0.61) and positive predictive value (+ve PPV 0.95 vs. +ve PPV 0.69) (Table 3b). An important apparent benefit of %CDT is that the percentage of false positives was relatively low (high specificity) compared to other biomarkers. %CDT retained diagnostic power when used as an indicator of alcohol consumption against the whole subject population (+ve PPV = 0.85 for %CDT vs 0.67 for GGT). In recent years, %CDT has been recognised as a reliable state marker of high alcohol consumption [45]. We have shown that %CDT would be suitable for the medical examiner tasked with the need to confirm ‘fitness-to-drive’ in a high-risk drink-driving offender.
Sensitivity and specificity
The specificity and sensitivity of a biomarker is crucial particularly when used to aid assessment as part of the process leading to a decision to reinstate driving entitlement at the end of the disqualification period for those drink-drivers whose conviction places them within the high risk offender category: those drink-drivers who are thought to pose a particularly high risk to other road users.
Wolff K, et al. Carbohydrate Deficient Transferrin (CDT) as a Biomarker to Assess Drinking in High-Risk Drink Drivers. Adv Clin Toxicol 2019, 4(3): 000160.
When the G1-alcohol subjects were pooled with G3- the special general hospital groups there was little difference in the sensitivity or the specificity of %CDT and GGT tests (0.76 vs 0.73% and 0.88 vs 0.92%), respectively. Our findings indicate that the sensitivity and the specificity of GGT activity for the identification of excessive alcohol consumption are good in circumstances where the status of the drinker is known. The sensitivity of GGT was 0.73 (%CDT 0.76) and specificity was 0.92 (%CDT 0.88) when G1 treatment population was compared to G2 social drinkers. However, when the two tests were compared against our whole sample population the diagnostic power of GGT was significantly reduced with specificity falling for GGT to 0.69 (0.88 for %CDT): thus in a high risk drinking populations where liver disease, obesity and diabetes are common [46] the specificity of GGT to detect chronic heavy drinking may be reduced.
We have confirmed the high specificity of %CDT but this is quite well established, whereas its sensitivity has been less well defined. In our study %CDT was able to identify drinking indicative of excessive alcohol intake (>3 %CDT) significantly more accurately than other biomarkers (Z=-9.017, p<0.001). The greater diagnostic power of %CDT was seen when data was combined from the whole sample set (G1, G2 and G3). The sensitivity and specificity of %CDT for the diagnosis of excessive alcohol use remained unchanged (AUC 0.91) whereas the diagnostic power of GGT was poorer (AUC 0.80).
The AUC of a ROC curve confirmed the greater sensitivity and specificity of %CDT when compared to GGT for the detection of excessive alcohol consumption ROC Curve
within a population consisting of subjects with different drinking behaviours and medical conditions. The ROC curve was constructed using the full data set from all population groups, which included the diabetic and obese subjects and was synonymous with those observed in high-risk drink-driving populations. The sensitivity and specificity of %CDT for the diagnosis of excessive alcohol consumption was 0.91 (AUC), whereas the diagnostic power of GGT was poorer (area under curve 0.80) as shown in Figure 2.
The test result variable(s): GGT, %CDT, MCV, AST, ALT have at least one tie between the positive actual state group and the negative actual state group: a) Under the nonparametric assumption, b) Null hypothesis: true area = 0.5. AUC (Std error, asymptotic 95% CI): GGT 0.798 (0.024, 0.751-0.845); %CDT 0.906 (0.016, 0.875-0.937);
Wolff K, et al. Carbohydrate Deficient Transferrin (CDT) as a Biomarker to Assess Drinking in High-Risk Drink Drivers. Adv Clin Toxicol 2019, 4(3): 000160.
MCV 0.848 (0.021, 0.807-0.889); AST 0.803 (0.023, 0.757- 0.849); ALT 0.723 (0.028, 0.669-0.777).
Conclusion
This study was carried out to determine if the diagnostic efficacy (sensitivity and specificity) of %CDT was suitable for the detection of continued alcohol consumption in high-risk drink drive offenders. Our findings demonstrate that %CDT provides an objective tool for more accurate decision making and contributing to the evidence based practices in road safety. %CDT is a better diagnostic tool in populations where confounders for common biomarkers of alcohol consumption are present.
Recommendations
- %CDT may be used to assess drivers for relicensing purposes since elevated %CDT is not confounded by common medical and life-style factors that confound other biomarkers.
- %CDT provides an effective sole marker for recent alcohol use in banned drink-drivers wishing to return to driving, because of the higher positive predictive value compared to other biomarkers.
Acknowledgments
We acknowledge the clinical teams of the Addiction Directorate of the South London & Maudsley NHS Foundation Trust (SLaM) and from King’s College Hospital NHS Foundation Trust, London, UK for their clinical support and assistance with participant recruitment. We also acknowledge funding for this study from the Department for Transport (DfT), UK Government. Grant Ref. T601C: Medical Aspects of Fitness to Drive. DfT played no role in the design of study, choice of enrolled patients, review and interpretation of data, preparation, approval or the decision to submit the manuscript for publication.
References
-
Carmen del Rio M, Alvarez FJ (2001) Illicit drugs and fitness to drive: assessment in Spanish Medical Driving Test Centres. Drug Alcohol Depend 64(1): 19- 25.
-
Carmen del Rio M, Gomez J, Sancho M, Alvarez FJ (2002) Alcohol, illicit drugs and medicinal drugs in fatally injured drivers in Spain between 1991 and 2000. Forensic Sci Int 127(1-2): 63-70.
-
Voas RB, Tippetts AS, Fell J (2000) The relationship of alcohol safety laws to drinking drivers in fatal crashes. Accid Anal Prev 32(4): 483-492.
-
Collier A, Watts M, Ghosh S, Rice P, Dewhurst N (2015) Alcohol dependence and driving: knowledge of DVLA regulations. BJPsych Bull 39(1): 35-38.
-
Gjerde H, Morland J (1987) Concentrations of carbohydrate-deficient transferrin in dialysed plasma from drunken drivers. Alcohol Alcohol 22(3): 271- 276.
-
Jones AW, Eklund A, Helander A (2000) Misleading results of ethanol analysis in urine specimens from rape victims suffering from diabetes. J Clin Forensic Med 7(3): 144-146.
-
Bortolotti F, Paoli GD, Pascali JP, Trevisan MT, Floreani M, et al. (2005) Analysis of carbohydrate- deficient transferrin: comparative evaluation of turbidimetric immunoassay, capillary zone electrophoresis, and HPLC. Clin Chem 51(12): 2368- 2371.
-
Brinkmann B, Beike J, Kohler H, Heinecke A, Bajanowski T (2002) Incidence of alcohol dependence among drunken drivers. Drug Alcohol Depend 66(1): 7-10.
-
Scheen AJ (2019) [Alcohol and car driving]. Rev Med Liege 74(5-6): 258-264.
-
Smailovic E, Lipovac K, Pesic D, Antic B (2019) Factors associated with driving under the influence of alcohol. Traffic Inj Prev 20(4): 343-347.
-
Arndt T, Korzec A, Bar M, Kropf J (2002) Further arguments against including trisialo-Fe2-transferrin in carbohydrate-deficient transferrin (CDT): a study on male alcoholics and hazardous drinkers. Med Sci Monit 8(6): CR411-418.
-
Bortolotti F, Micciolo R, Canal L, Tagliaro F (2015) First Objective Association between Elevated Carbohydrate-Deficient Transferrin Concentrations and Alcohol-Related Traffic Accidents. Alcohol Clin Exp Res 39(11): 2108-2114.
-
Madhubala V, Subhashree AR, Shanthi B (2013) Serum carbohydrate deficient transferrin as a Wolff K, et al. Carbohydrate Deficient Transferrin (CDT) as a Biomarker to Assess Drinking in High-Risk Drink Drivers. Adv Clin Toxicol 2019, 4(3): 000160. sensitive marker in diagnosing alcohol abuse: a case - control study. J Clin Diagn Res 7(2): 197-200.
-
Nivukoski U, Niemela M, Bloigu A, Bloigu R, Aalto M, et al., Impacts of unfavourable lifestyle factors on biomarkers of liver function, inflammation and lipid status. PLoS One 14(6).
-
Daeppen JB, Anex F, Favrat B, Bissery A, Leutwyler J, et al. (2005) Carbohydrate-deficient transferrin measured by capillary zone electrophoresis and by turbidimetric immunoassay for identification of young heavy drinkers. Clin Chem 51(6): 1046-1048.
-
Legros FJ, Nuyens V, Minet E, Emonts P, Boudjeltia K, et al. (2002) Carbohydrate-deficient transferrin isoforms measured by capillary zone electrophoresis for detection of alcohol abuse. Clin Chem 48(12): 2177-2186.
-
Whitfield JB (2002) Transferrin isoform analysis for the diagnosis and management of hazardous or dependent drinking. Clin Chem 48(12): 2095-2096.
-
Rainio J, Ahola S, Kangastupa P, Kultti J, Tuomi H, et al. (2014) Comparison of ethyl glucuronide and carbohydrate-deficient transferrin in different body fluids for post-mortem identification of alcohol use. Alcohol Alcohol 49(1): 55-59.
-
Helander A, Wielders J, Anton R, Arndt T, Bianchi V, et al., (2017) Reprint of Standardisation and use of the alcohol biomarker carbohydrate-deficient transferrin (CDT). Clin Chim Acta 467: 15-20.
-
Royal Colleges (1995) Alcohol and the Heart in Perspective: Sensible Drinking Reaffirmed. Report of a Joint Working Group of the Royal College of Physicians, the Royal College of Psychiatrists and the Royal College of General Practitioners, R.C.o. Physician, London.
-
Office for National Statistics. (2018). Adult drinking habits in Great Britain, 2017. [Online] Available at: https://www.ons.gov.uk/peoplepopulationandcomm unity/healthandsocialcare/drugusealcoholandsmoki ng/bulletins/opinionsandlifestylesurveyadultdrinkin ghabitsingreatbritain/2017. [Accessed 2 January 2019].
-
Department of Health. Sensible drinking: report of an inter-departmental working group. London, UK, 1995.
-
Royal College of Physicians. Royal College of Physicians’ written evidence to the Science and Technology Select Committee Inquiry on alcohol guidelines. London, UK: Royal College of Physicians, 2011.
-
Helander A, Wielders JP, Te Stroet R, Bergstrom JP (2005) Comparison of HPLC and capillary electrophoresis for confirmatory testing of the alcohol misuse marker carbohydrate-deficient transferrin. Clin Chem 51(8): 1528-1531.
-
Bortolotti F, Tagliaro F, Cittadini F, Gottardo R, Trettene M, et al. (2002) Determination of CDT, a marker of chronic alcohol abuse, for driving license issuing: immunoassay versus capillary electrophoresis. Forensic Sci Int 128(1-2): 53-58.
-
Anton RF (2001) Carbohydrate-deficient transferrin for detection and monitoring of sustained heavy drinking. What have we learned? Where do we go from here? Alcohol 25(3): 185-188.
-
Conigrave KM, Degenhardt LJ, Whitfield JB, Saunders JB, Helander A, et al. (2002) CDT, GGT, and AST as markers of alcohol use: the WHO/ISBRA collaborative project. Alcohol Clin Exp Res 26(3): 332-339.
-
Golka K, Wiese A (2004) Carbohydrate-deficient transferrin (CDT)-a biomarker for long-term alcohol consumption. J Toxicol Environ Health B Crit Rev 7(4): 319-337.
-
Kilo S, Hofmann B, Eckert E, Goen T, Drexler H (2016) Evaluation of biomarkers assessing regular alcohol consumption in an occupational setting. Int Arch Occup Environ Health 89(8): 1193-1203.
-
Schiller JS, Lucas JW, Peregoy JA. Summary health statistics for U.S. adults: National Health Interview Survey, 2011. National Center for Health Statistics. Vital Health Stat 10(256). 2012.
-
Observatory NWPH (2007) Indications of public health in the English regions-alcohol, NWPH. Observatory, Liverpool, UK.
-
Helander A, Carlsson AV, Borg S (1996) Longitudinal comparison of carbohydrate-deficient transferrin and gamma-glutamyl transferase: complementary markers of excessive alcohol consumption. Alcohol Alcohol 31(1): 101-107. Wolff K, et al. Carbohydrate Deficient Transferrin (CDT) as a Biomarker to Assess Drinking in High-Risk Drink Drivers. Adv Clin Toxicol 2019, 4(3): 000160.
-
Helander A, Tabakoff B (1997) Biochemical markers of alcohol use and abuse: experiences from the Pilot Study of the WHO/ISBRA Collaborative Project on state and trait markers of alcohol. International Society for Biomedical Research on Alcoholism. Alcohol Alcohol 32(2): 133-144.
-
Hietala J, Koivisto H, Anttila P, Niemela O (2006) Comparison of the combined marker GGT-CDT and the conventional laboratory markers of alcohol abuse in heavy drinkers, moderate drinkers and abstainers. Alcohol Alcohol 41(5): 528-533.
-
Andresen-Streichert H, Muller A, Glahn A, Skopp G, Sterneck M. Alcohol. Biomarkers in Clinical and Forensic Contexts. Dtsch Arztebl Int 2018 May 4; 115 (18): 309-315
-
van Beek J, de Moor MHM, Geels LM, Sinke MRT, de Geus EJC, et al. (2014) The association of alcohol intake with gamma-glutamyl transferase (GGT) levels: evidence for correlated genetic effects. Drug Alcohol Depend 134: 99-105.
-
Rosalki SB, Tarlow D, Rau D (1971) Plasma gamma- glutamyl transpeptidase elevation in patients receiving enzyme-inducing drugs. Lancet 2(7720): 376-377.
-
Puukka K, Hietala J, Koivisto H, Anttila P, Bloigu R, et al. (2006) Additive effects of moderate drinking and obesity on serum gamma-glutamyl transferase activity. Am J Clin Nutr 83(6): 1351-1354.
-
Koller T, Kollerova J, Hlavaty T, Huorka M, Payer J, et al. (2010) Prevalence of liver disease markers among patients with metabolic risk factors. Vnitr Lek 56(3): 183-189.
-
Chick J, Kreitman N, Plant M (1981) Mean cell volume and gamma-glutamyl-transpeptidase as markers of drinking in working men. Lancet 1(8232): 1249- 1251.
-
Pavanello S, Snenghi R, Nalesso A, Sartore D, Ferrara SD, et al. (2012) Alcohol drinking, mean corpuscular volume of erythrocytes, and alcohol metabolic genotypes in drunk drivers. Alcohol 46(1): 61-68.
-
Tang C, Liang X, Liu H, Guo L, Pi R, et al. (2012) Changes in mitochondrial DNA and its encoded products in alcoholic cirrhosis. Int J Clin Exp Med 5(3): 245-250.
-
Kanel GC, Cassidy W, Shuster L, Reynolds TB (1990) Cocaine-induced liver cell injury: comparison of morphological features in man and in experimental models. Hepatology 11(4): 646-651.
-
Deas D, Johnson N, Thomas S (2019) Carbohydrate deficient transferrin (CDT) predicts heavy drinking in adolescents with alcohol dependence. Alcohol.
-
Schellenberg F, Humeau C (2017) Standardization of the capillary electrophoresis procedures Capillarys(R) CDT and Minicap(R) CDT in comparison to the IFCC reference measurement procedure. Ann Biol Clin (Paris) 75(3): 319-326.
-
Zakhari S (2013) Bermuda Triangle for the liver: alcohol, obesity, and viral hepatitis. J Gastroenterol Hepatol 28(1): 18-25. Wolff K, et al. Carbohydrate Deficient Transferrin (CDT) as a Biomarker to Assess Drinking in High-Risk Drink Drivers. Adv Clin Toxicol 2019, 4(3): 000160.
- Evaluation of Skin Aging Preventive Effects of Cherry Blossom Petal Extracts Through Antioxidant and Anti-Glycation Activities
- Is Cell Death Responsible for False Positive Results of In Vivo Comet Assay?
- Pattern of Gonadal Hormones in Oral Testosterone-Supplimented Male Wistar Rats with Diabetes-Induced Hypogonadism
- Re-Evaluation of the Genotoxicity of Currently Used Food Dyes in Mouse Multiple Organs Via Continuous Administration by Drinking Using the Comet Assay
- Pharmacogenetics of Type 2 Diabetes Mellitus: Linking Genetic Variability to Drug Efficacy and its Cardiovascular Outcomes
- Exploratory Proteomic Profiling of SARS-CoV-2 Infected THP-1 Macrophages Reveals Alterations in Inflammatory Response and Cellular Metabolism