Evaluation of Gait Parameters after Cerebrovascular Accident
One of the main issues for stroke victims is restoring normal walking function, which necessitates a large amount of time being devoted to relearning how to walk. The aim of the study was to evaluate the walking efficiency of patients who Cerebrovascular accident (CVA) post of 2 months of Stroke by using specialized camera program to take angles during walking. The study was focus on patients who have Cerebrovascular accident (CVA) two months prior to the study and have received the international protocol for physical therapy in this period, 7 patients were undergo examination using the Kinovea capture system, and they were analyze the data generated from the system, the results issued by two physical therapists were be evaluated, and after completing this examination, the 7 patients were be given a Stroke Specific Quality Of Life Scale (SS-QOL) and filled out. The results were be achieved in the routine methods by checking some variables. Then we were come up with the results to achieve the aim of this study. According to the study, (57%) of the patients were female and (43%) were male. The results of the capture system are shown there are no significant statistical differences in limb swing time between the affected lower extremity and the intact lower extremity (p = 0.082), and, there are no significant statistical differences in limb stance time between the affected lower extremity and the intact lower extremity (p=0.141), and, there are no significant statistical differences in step length between the affected lower extremity and the intact lower extremity in patients with cerebrovascular accident (p = 0.383) , and, there are no significant statistical differences in stride length between patients with cerebrovascular accident (CVA) after 2 months of regular physical therapy sessions and normal stride length (p = 0.176).
Abbreviations
CVA: Cerebrovascular Accident; UE: Upper Extremity.
Introduction
A cerebrovascular accident (CVA), or stroke, is a neurological condition caused by a blockage in the blood vessels. This blockage can be due to brain clots that obstruct arteries or cause blood vessels to burst, leading to bleeding. The sudden death of brain cells occurs when the arteries to the brain are ruptured during a stroke, due to a lack of oxygen. A stroke can also lead to dementia and depression [1]. More than 80% of people who have had a stroke afterward experience chronic walking difficulties People with stroke are more likely to sustain injuries from falls and frequently need intensive rehabilitation during the subacute and chronic phases of the disease. Early stroke rehabilitation aims to reestablish a patient’s capacity for ADLs including walking, eating, and using the restroom. One of the main issues for stroke victims is restoring normal walking function, which necessitates a large amount of time being devoted to relearning how to walk [2, 3].
The severity of stroke depends on the location and extent of the region involved. The most common symptom is hemiparesis, which limits walking and balance and causes muscle weakness in the upper and lower limbs, on the side of the body opposite the brain lesion. There are restrictions on the sit-to-stand and stand-to-sit positions, typical weight bearing, and walking motions. In general, the body’s movement in daily life is impacted [4].
Stroke patients often experience decreased muscle strength on the paralyzed side, leading to reduced movement and difficulty in performing daily activities. This results in abnormal muscle mobilization on the non-paralyzed side, which can worsen gait problems and increase the risk of falls. These patients also struggle with maintaining static balance while sitting and standing. Furthermore, they may have issues with dynamic balance, particularly when transitioning from sitting to standing or vice versa, leading to reduced postural stability during both static and dynamic standing [4, 5].
This study was focused on the gait parameters of the lower limbs, recent studies emphasize the importance of incorporating also the trunk and upper limbs, particularly in post-stroke gait analyses, since this information adds to the understanding of balance control, energy expenditure and functional ability. In addition, post-stroke gait analyses that include more than the lower limbs can identify deviations in other body parts and their possible underlying causes or consequences [6].
Many neurological doctors impersonate their ability to apply the wonderful application to convince the patient of his ability to walk almost after 2 months, which may be misleading for them, hence the justification of the study by conducting an evaluation of these measures through the kinovea capture system to study the changes that occur after 2 months .The purpose of this study was to analyze the gait parameters with CVA after 2 months.
Methodology
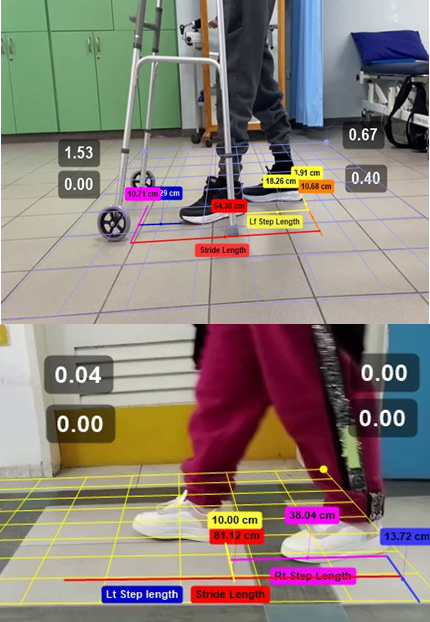
A quasi-experimental study was be conducted at Bethlehem Arab Society for Rehabilitation and Almezan Hospital in March 2023 to May 2023. The study was evaluate 7 patients who had a stroke two months prior to the study. Two months after the injury and undergoing regular physiotherapy sessions in this period, a camera capture system intervention was be performed for patients while walking and standing, using the Kinovea program.
The entire group was be sampled, the patients was be examined, the results was be presented, and the outcomes was be compared to each patient’s healthy limb. The two outcomes was then be mutually evaluated for each patient, the efficacy of the surgical treatment and the international physiotherapy protocol for the target patients. This study was being organized at Bethlehem Arab Society for Rehabilitation at Bethlehem and Al-mezan Hospital at Hebron.
A convenient random sampling method was be used to randomly select study samples, avoiding any bias in the process. The study included individuals who had strokes two months ago in Bethlehem Arab Society for Rehabilitation and participated in physiotherapy sessions during this period.
Inclusion criteria were as follows:
- Patients who had a stroke two months ago are now able to walk, aged 40-60 years, who underwent regular physical therapy sessions.
- All participants are male and female.
- The international Physiotherapy Protocol was used to treat patients for two months.
- All patients undergo a Kinovea capture system.
Exclusion criteria were as follows:
- Patients who are unable to walk.
- Patients with musculoskeletal problems such as degenerative osteoarthritis and ligament injuries.
- Patients with postural malalingment of the spine and pelvis.
- Patients with walking problems prior to injury.
- Patients with recurrent stroke.
Instrumentation Kinovea Capture System is a free 2D motion analysis software for computers that can be used to measure kinematic parameters and is a video annotation tool designed for sport analysis. It features utilities to capture, slow down, compare, annotate and measure motion in videos [7].
Stroke Specific Quality of Life Scale (SS-QOL) is a patient-centered outcome measure intended to provide an assessment of health-related quality of life specific to patients with stroke consisting of 49 items in the 12 domains of energy, family roles, language, mobility, mood, personality, self-care, social roles, thinking, upper extremity (UE) function, vision, and work/productivity. The domains are scored separately, and a total score is also provided [8].
Results
A total of 7 patients with 2 months stroke cerebrovascular accident have participated in this study. In respect to gender distribution of the sample, 43% of the patients are males, where 57% of them are females. With regards to geographical allocation of the participants, 57% of them are from Hebron Governorate, 29% are from Bethlehem Governorate, and 14% from Ramallah Governorate.
Respecting the age of the participants, the data analysis revealed that the average age of the participants is 55.8 ±3.5 years, which is in the study range of 45-65. The mini- mum age of the patients was 52 and the oldest patient was 62 years old. Additionally, the data analysis shows that the participants males were older than female participants. The average of the males was 58±5 and the average age of the females was 55±2 years.
In order to study the effect of regular physical therapy sessions on stroke patient’s gait, the researcher used four gait parameters that have been assessed by Kinovea capture system. The four parameters are: lower extremity swing time by seconds, lower extremity stance time by seconds, lower extremity step length in cm and lower extremity stride length in cm.
The researchers used the Mann-Whitney U Test to investigate the impact of regular physical therapy sessions on the swing time of the lower extremities in stroke patients. The test compared the average swing time (in seconds) between the affected and intact limbs. The test was run under the null hypothesis that there are no significant statistical differences in swing time between the affected and intact lower extremities in stroke patients after two months of regular physical therapy sessions.
The Mann-Whitney U Test produced a p value of 0.082 which is higher than α=0.05. Therefore, we accept the null hypothesis and conclude that there are no significant statistical differences in limb swing time between the affected lower extremity and the intact lower extremity in patients with cerebrovascular accident (CVA) after 2 months of regular physical therapy sessions (U = 11, p=0.082).
This means that the affected limb and the intact limb are on average swinging at the same pace in seconds. This also implies that the regular physical therapy sessions positively affect the lower extremity swing time in patients with cerebrovascular accident (CVA) after 2 months of regular sessions. The swing phase is estimated to be 40% of the gait cycle. By that we can deduce that regular physical therapy sessions have a significant effect on patients’ gait after 2 months of therapy. Tables 1 & 2 presents the Mann-Whitney Test results.
- Ranks of Swing Time by Seconds
- The side
- N
- Mean Rank
- Sum of Ranks
- Affected side
- 7
- 5.57
- 39
- Intact side
- 7
- 9.43
- 66
Table 1: Ranks of Swing Time by Seconds.
| Test Statisticsa | |
|---|---|
| Swing Time in Seconds | |
| Mann-Whitney U | 11 |
| Z | -1.74 |
| Sig. (2-tailed) | 0.082 |
Table 2: ** Mann-Whitney Test Results for Swing Time by Seconds. The researchers used the Mann-Whitney U Test to examine the effe
a Grouping Variable: The side Table 2: Mann-Whitney Test Results for Swing Time by Seconds. The researchers used the Mann-Whitney U Test to examine the effect of regular physical therapy sessions on lower extremity stance time on stroke patients. The Mann- Whitney U Test was applied to evaluate the average difference of lower extremity stance time (in seconds) between the intact limb and the affected limb among the study patients.
The test was implemented using the null hypothesis that says that there are no significant statistical differences in limb stance time between the affected lower extremity and the intact lower extremity in patients with cerebrovascular accident (CVA) after 2 months of regular physical therapy sessions.
This indicates that the affected limb and the intact limb on average have the same stance time in seconds. This also implies that the regular physical therapy sessions positively affect the lower extremity stance time in patients with cerebrovascular accident (CVA) after 2 months of regular sessions. The stance phase of gait begins when the foot first touches the ground and ends when the same foot leaves the ground. The stance phase makes up approximately 60% of the gait cycle. Hence, we deduce that regular physical therapy has a significant effect on patients’ gait after 2 months of the sessions. Tables 3,4 presents the Mann-Whitney Test results.
- Ranks of Stance Time by Seconds
- The side
- N
- Mean Rank
- Sum of Ranks
- Affected side
- 7
- 9.14
- 64
- Intact side
- 7
- 5.86
- 41
Table 3: Ranks of Stance Time by Seconds.
| Test Statisticsa | |
|---|---|
| Stance Time in Seconds | |
| Mann-Whitney U | 13 |
| Z | -1.471 |
| Sig. (2-tailed) | 0.141 |
Table 5: ** Mann-Whitney Test Results for Stance Time by Seconds.
aGrouping Variable: The side Table 4: Mann-Whitney Test Results for Stance Time by Seconds.
The researchers used the Mann-Whitney U Test to study the effect of regular physical therapy sessions on the step length of the lower extremities in stroke patients. The test compared the average step length (in centimeters) between the affected and intact limbs. The null hypothesis was that there are no significant statistical differences in step length between the affected and intact lower extremities in stroke patients after two months of regular physical therapy sessions.
A p value of 0.383 was produced by the Mann-Whitney U Test. This value is higher than α=0.05. Consequently, we accept the null hypothesis and conclude that there are no significant statistical differences in step length between the affected lower extremity and the intact lower extremity in patients with cerebrovascular accident (CVA) after 2 months of regular physical therapy sessions (U = 17, p=0.383).
The study indicates that regular physical therapy sessions can improve the step length in stroke patients, making it similar between the affected and intact limbs. Step length, defined as the distance between the initial contact points of opposite feet, is typically similar in a normal gait. After two months of regular therapy, the step length of the affected side in stroke patients was found to be enhanced, matching that of the intact side. This suggests that regular physical therapy has a significant positive impact on a patient’s gait. Tables 5,6 presents the Mann-Whitney Test results.
- Ranks of Step Length in Cm
- The side
- N
- Mean Rank
- Sum of Ranks
- Affected side
- 7
- 6.43
- 45
- Intact side
- 7
- 8.57
- 60
Table 7: Ranks of Step Length in Cm.
| Test Statisticsa | |
|---|---|
| Step Length in Cm | |
| Mann-Whitney U | 17 |
| Z | -0.985 |
| Sig. (2-tailed) | 0.383 |
Table 4: ** Mann-Whitney Test results For Step Length in Cm.
aGrouping Variable: The side Table 6: Mann-Whitney Test results For Step Length in Cm.
The stride length is the distance between two successive placements of the same foot. It consists of two step lengths, left and right, each of which is the distance by which the named foot moves forward in front of the other one. The normal stride length ranges from 63.00 cm to 7.20cm (On average 70 cm for step). Accordingly, to test the effect of regular physical therapy sessions on lower extremity stride length, the researcher used One Sample Sign Non Parametric test. The test was executed using the null hypothesis that states that there are no significant statistical differences in stride length between patients with cerebrovascular accident (CVA) after 2 months of regular physical therapy sessions and normal stride length (70).
The One Sample Sign Non Parametric test revealed a p value of 0.176 which is higher than α=0.05. Thus, we accept the null hypothesis and conclude that there are no significant statistical differences in stride length between patients with cerebrovascular accident (CVA) after 2 months of regular physical therapy sessions and normal stride length (70).
This means that patients with cerebrovascular accident (CVA) after 2 months of regular physical therapy sessions have the same stride length as non-patient people. This also implies that 2 months of regular physical therapy sessions positively affect stroke patients. The table 7 shows the test results.
| Null Hypothesis | Test | Sig. | Decision |
|---|---|---|---|
| The median of stride length equals 70.000 | One- Sample Wilcoxon Signed Rank Test | 0.176 | Retain the null Hypothesis |
Table 6: ** Hypothesis Test Summary.
Asymptotic significances are displayed. The significance level is .05. Table 7: Hypothesis Test Summary.
To study the relation between stroke patient’s gait and their quality of life measures, the researcher used four gait parameters that have been assessed by Kinovea capture system. The four parameters are: lower extremity swing time by seconds, lower extremity stance time by seconds, lower extremity step length in cm, and lower extremity stride length in cm.
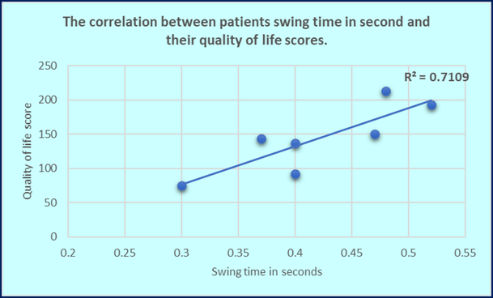
These parameters were compared with patients’ quality of life measurements. The researcher used a 2-tailed Pearson Correlation to examine the relationship be-tween swing time in seconds and patients’ quality of life measures. The test yielded an “r” value of 0.843, indicating a strong positive correlation between swing time and patients’ quality of life (r = 0.843, n=7, p= 0.017). This suggests that a longer swing time is associated with a higher quality of life score. Therefore, it can be concluded that there is a strong and positive linear relationship between a stroke patient’s limb swing time after 2 months of rehabilitation and their quality of life score. The Table 8 and the Figure 1 illustrate these findings.
| Correlation | ||
|---|---|---|
| Quality of Life Score Pearson Cor- 0.843 Swing Time relation in Seconds Sig. (2-tailed) 0.017 N 7 | ||
| Sig. (2-tailed) | 0.017 | |
| N | 7 |
Table 9: Correlation between lower extremity swing time in seconds and quality of life score.
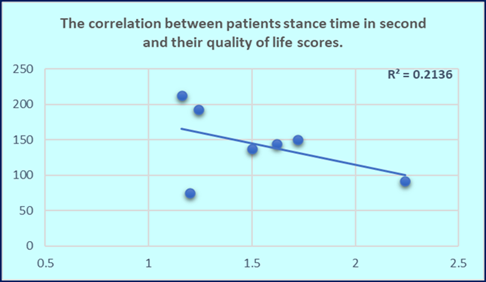
The researcher used a 2-tailed Pearson Correlation to detect the relationship between stance time in seconds and patients’ quality of life scores. The correlation test produced an “r” value of -0.462, indicating no significant correlation between lower extremity stance time and patients’ quality of life scores (r= -0.462, n=7, p= 0.296). The table 9 and the figure 2 illustrate these findings.
| Correlation | ||
|---|---|---|
| Quality of Life Score | ||
| Stance Time in Seconds | Pearson Correlation | -0.462 |
| Sig. (2-tailed) | 0.296 | |
| N | 7 |
Table 8: Correlation between lower extremity stance time in seconds and quality of life score.
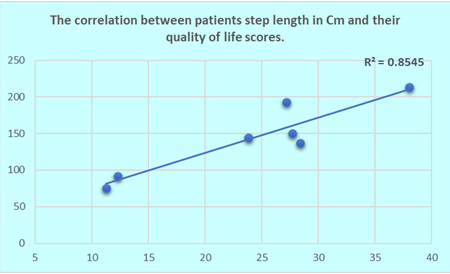
The researcher used a 2-tailed Pearson Correlation to detect the relationship between step length (in cm) and patients’ quality of life measures. The correlation test produced an “r” value of 0.924, indicating a strong positive correlation (r = 0.924, n=7, p= 0.003). This suggests that an increase in step length is associated with a higher quality of life score. Therefore, it can be concluded that there is a strong and positive linear relationship between the step length of stroke patients after two months of rehabilitation and their quality of life score. The table 10 and figure 3 illustrate these findings.
| Correlation | ||
|---|---|---|
| Quality of Life Score | ||
| Swing Time in Seconds | Pearson Correlation | 0.924 |
| Sig. (2-tailed) | 0.003 | |
| N | 7 |
Table 10: Correlation between lower extremity step length in Cm and quality of life score.
The researcher implemented a 2-tailed Pearson Correlation to detect this relationship. The test was executed between stride length in Cm and patients’ quality of life measures. The correlation test produced an “r” value of 0.016 which denotes that there is no association between lower extremity stride time in seconds and patients’ quality of life scores (r = 0.016, n=7, p= 0.97). The table 11 illustrates these findings.
| Correlation | ||
|---|---|---|
| Quality of Life Score Pearson 0.016 Correlation Stance Time in Seconds Sig. 0.97 (2-tailed) N 7 | ||
| Sig. (2-tailed) | 0.97 | |
| N | 7 |
Table 11: Correlation between lower extremity stride length in Cm and quality of life score.
Discussion
The current study suggests that regular physical therapy sessions enhance motor recovery and lower extremity functioning in stroke patients. After two months of therapy, there are no significant differences in swing time, stance time, step length, or stride length between the affected and intact limbs. This indicates that therapy significantly improves gait in stroke patients. There’s a strong positive correlation between patients’ quality of life score and both their swing time and step length. However, no correlation exists between the quality of life score and either stance time or stride time.
Evaluate the clinical efficacy of body weight supported treadmill training for acute post-stroke rehabilitation, relative to conventional therapy by Derek (2019). Forty patients were randomized to receive either treatment as part of standard care at a rehabilitation facility. Despite having a significantly lower admission Functional Independence Measure, the treadmill group had a longer stay and similar discharge scores to the conventional therapy group. Gait speed was the only significantly different outcome at discharge, being lower in the treadmill group. After accounting for admission score differences, both methods performed comparably, suggesting similar clinical efficacy [9].
Twenty-six healthy subjects and sixteen patients with post-stroke were recruited to investigate the validity and reliability of Odonate for gait analysis and examine its ability to discriminate abnormal gait patterns by Ying peng (2022). The study found high consistency in the repeatability tests of different raters and days. When compared with Vicon, Odonate showed high consistency in measuring gait velocity, cadence, step length, cycle time, and sagittal hip and knee joint angles. However, it showed slightly lower consistency in gait phase division and sagittal ankle joint angle. Despite these differences, Odonate was comparable to Vicon in identifying abnormal gait patterns in post-stroke patients. Therefore, Odonate has the potential to provide accessible and objective measurements for clinical gait assessment [10].
This study by Claudia (2021) focuses on the assessment of gait anomalies in stroke survivors using a single RGB-D sensor. The aim is to estimate gait patterns and parameters on a short walkway, which could be useful for monitoring changes in gait disorders in unsupervised settings like homes. The spatiotemporal parameters estimated by this method were compared with those from a gold standard system for 3D gait analysis. Preliminary results show good agreement, accuracy, and correlation between the two systems, suggesting that the proposed solution could be used for gait analysis in real-life contexts where gold standard systems are impractical [11].
Fifteen ambulatory individuals with chronic stroke wore instrumented insoles and performed two separate normal- pace walking assessments, including unobserved conditions during which participants were unattended and unaware of data collection, and observed conditions with an investigator present by Marzieh (2020). Gait analysis was conducted outside of a laboratory setting using instrumented insoles equipped with a 3D accelerometer and pressure sensors which captured the spatiotemporal kinematics, vertical ground reaction forces and foot acceleration. Data were compared using paired comparisons, with subsequent correlation and stepwise regression analyses to explore potential associations between Hawthorne-induced changes in walking strategies, gait speed and locomotor performance (daily stepping).
Except for cadence, other measures of spatiotemporal parameters and swing kinematics (acceleration) were not significantly different between observed vs unobserved conditions. However, analyses of ground reaction forces revealed significantly greater paretic limb loading (Δ1st peak = 1.5 ± 1.6 N/kg Δ2nd peak = 1.4 ± 1.8 N/kg; p < 0.01) and increases in weight bearing symmetry (11–24%, p < 0.01) during observed vs unobserved conditions. This potential Hawthorne effect was greater in those with slower walking speeds and shorter stride lengths but was not related to daily stepping.
The findings suggest that the biomechanical parameters of walking may be influenced by the presence of an observer. This highlights the importance of separately measuring locomotor capacity (gait speed) and performance (daily stepping) [12].
Limited literature has investigated the relationships between acceleration-based gait characteristics and kinematic information from motion analysis systems in gait analysis by Chu-Ling (2019). Seventeen patients’ trunk acceleration was measured with an accelerometer as they walked at a comfortable speed. The study found positive correlations between walking speed, harmonic ratios along the anteroposterior axis, and stride regularity along the vertical and antero-posterior axes. Harmonic ratios were associated with the stance phase percent on the unaffected side, while stride regularity was associated with the stance phase percent on both sides. Smaller inter-stride variability was linked to smaller peak ankle plantar flexion during both phases and greater peak ankle dorsiflexion during the swing phase. Stride regularity was positively associated with maximal knee flexion during the swing phase. These findings support the potential use of accelerometers for gait analysis in stroke patients [13, 14].
Conclusion
In fact, physiotherapy protocols have evolved in dealing with stroke patients in order to provide the best treatment and thus obtain the best result. In this study, it was proven that the patient is able to return to normal gait measurements two months after the injury and adhere to the physiotherapy sessions.
References
-
Shakir R (2018) The struggle for stroke reclassification. Nature Reviews Neurology 14(8): 447-448.
-
Gelaw AY, Janakiraman B, Teshome A, Ravichandran H (2019) Effectiveness of treadmill assisted gait training in stroke survivors: A systematic re-view and meta- analysis. Global Epidemiology 1: 100012.
-
Henderson CE, Fahey M, Brazg G, Moore JL, Hornby TG (2022) Predicting Discharge Walking Function With High-Intensity Stepping Training During Inpatient Rehabilitation in Nonambulatory Patients Poststroke. Arch Phys Med Rehab 103(7): 189-196.
-
Dai S, Piscicelli C, Lemaire C, Christiaens A, Schotten MT, et al. (2022) Recovery of balance and gait after stroke is deteriorated by confluent white matter hyperintensities: Cohort study. Ann Phys Rehabil Med 65(1): 101488.
-
Alarab A, Talahma I, Awwad H, Sharawi A, Amro O, et al. (2022) Mulligan technique versus McKenzie technique on patients with non- specific neck pain. Journal of Palestine Ahliya University for Research and Studies 1(2).
-
Wee SK, Hughes AM, Warner MB, Burridge JH (2022) Longitudinal analysis of the recovery of trunk control and upper extremity following stroke: An individual growth curve approach. Top Stroke Rehabil 29(1): 58- 73.
-
Puig-Diví A, Escalona-Marfil C, Padullés-Riu JM, Busquets A, Padullés-Chando X, et al. (2019) Validity and reliability of the Kinovea program in obtaining angles and distances using coordinates in 4 perspectives. PLoS One 14(6): e0216448.
-
Sallam SA, Al-Khamis FA, Muaidi QI, Abdulla FA (2019) Translation and validation of the stroke specific quality of life scale into Arabic. NeuroRehabilitation 44(2): 283- 293.
-
Lura DJ, Venglar MC, van Duijn AJ, Csavina KR (2019) Body weight supported treadmill vs. overground gait training for acute stroke gait rehabilitation. Int J Rehabil Res 42(3): 270-274.
-
Wang Y, Tang R, Wang H, Yu X, Li Y, et al. (2022) The Validity and Reliability of a New Intelligent Three- Dimensional Gait Analysis System in Healthy Subjects and Patients with Post-Stroke. Sensors (Basel) 22(23): 9425.
-
Ferraris C, Cimolin V, Vismara L, Votta V, Amprimo G, et al. (2021) Monitoring of Gait Parameters in Post-Stroke Individuals: A Feasibility Study Using RGB-D Sensors. Sensors (Basel, Switzerland), 21(17): 5945.
-
Ardestani MM, Hornby TG (2020) Effect of investigator observation on gait parameters in individuals with stroke. J Biomech 100: 109602.
-
Yen CL, Chang KC, Wu CY, Hsieh YW (2019) The relationship between trunk acceleration parameters and kinematic characteristics during walking in patients with stroke. J Phys Ther Sci 31(8): 638-644.
-
Azzam A, Ratib RA, Muntaser MS (2023) Muscle contraction exercise for low back pain. Hong Kong Physiother J 43(1): 53-60.
- Electrolyte Considerations for Athletes
- Comprehensive Rehabilitation in Adults with Diabetic Peripheral Neuropathy: A Literature Review on Frequency, Intensity, and Duration Parameters
- Exercise Duration and Its Association with ADHD Symptom Severity in Children and Adolescents: A Parent-Reported Survey Study
- Adaptation of the Adult Neurophysiology of Pain Questionnaire for Use in Pediatrics
- A Non-Pharmacological Multidisciplinary Pain Program within a Hospital Wellness Program: A Mixed Methods Study
- The Effect of Frenkel's Exercise with PNF on Functional Reach in Stroke Survivors: A Randomized Control Trial