Bioequivalence of a Preparation of Tulathromycin in Cattle
Introduction
The determination of the bioequivalence (BE) of veterinary drug formulations has been set as a goal in most regulatory agencies worldwide [1]. Yet, BE studies are costly and require close monitoring from regulatory officials to ensure their adequacy for a given active principle. The compulsory implementation of BE studies awaits completion in most Latin-American countries. For a new drug- preparation to be considered bioequivalent (BE), its plasma drug-concentrations and the key pharmacokinetic values must be statistically similar to the pioneer or reference brand i.e., maximum plasma concentration (Cmax); area under the concentration curve vs. time (AUC), and elimination half- life (T½el), having administered both drug-preparations, through the same route and at the same dose [2, 3]. The degree of similarity between two plasma concentration profiles to be considered BE is when the confidence interval for untransformed data should lay within a range of 80–120%, and for logarithmically transformed data, the confidence interval is generally 80–125% [4, 5]. Attainment of these targets is not always a straightforward goal and this adds considerable investment of the pharmaceutical company sponsoring the new drug preparation, and this is particularly so for the long-acting pharmaceutical preparations such as tulathromycin (TTM).
This macrolide antibiotic is used to treat bovine respiratory disease (BRD) in cattle associated with Mannheimia haemolytica, Pasteurella multocida, Histophilus somni and Mycoplasma bovis [6, 7]. It is a triamilide antibiotic that exists as an equilibrium mixture of two isomeric forms, tulathromycin A (90%) and B (10%) [7]. Individual treatment of BRD-affected steers with TTM is effective, but metaphylactic treatment has been postulated as a more rational approach to control BRD because, from the herd’s health perspective, significantly more TTM-treated cattle remained healthy throughout their production cycle as compared to tilmicosin-treated, or saline-treated cattle, in commercial herds [7]. Furthermore, a meta‐analysis carried out with randomized clinical trials reporting treatment with TTM or tilmicosin resulted in an approximately 50% reduction in the risk of treatment or re‐treatment for BRD, compared with those animals treated with tilmicosin [8]. Also, a single dose of TTM resulted effective for the treatment infectious bovine keratoconjunctivitis [9]. As a concentration-dependent antibacterial drug it is reasonable to assume that part of the referred efficacy is due to its prolonged stay in the body [7, 8, 9, 10]. Hence, the need to carry out BE for preparations containing TTM. Another reason is to control bacterial resistance. A recent study showed that the administration of TTM induced significant changes in the nasopharyngeal and fecal microbiota, supporting an increase in the relative abundance of antibiotic resistance determinants [11].
Hence, verification of the existence of BE and consequently the maintenance of the pharmacokinetics /pharmacodynamics (PK/PD) ratios for TTM should be warranted i.e, that the plasma concentrations of this antibacterial drug are maintained above the minimum inhibitory concentration (MIC) values required for the targeted pathogens for the longest possible time between dosing intervals (T>MIC) [12, 13].
Motivated by the therapeutic success of the reference preparation of tulathromycin, a new pharmaceutical preparation of this macrolide drug has been made available in parts of the Latin-American market, and considering the importance of this drug in the cattle industry, a study was carried out to evaluate whether or not the pretending generic drug (Pisadrax®) is BE to the reference brand, Draxxin®.
Material and Methods
Chemicals and Reagents Drug-preparations
Animals and housing: All study procedures and animal care activities were carried out following the Institutional Committee for Research, Care, and Use of Experimental Animals of the National Autonomous University of Mexico (UNAM), per Official Mexican Regulation NOM-062- ZOO- 1999 [14].
Experimental Design
The sample size for this BE study was set at twelve young Charolais/Brahman steers per group based on GPower® software [15], to obtain a 0.95 test-power. Steers were randomly assigned into either the reference preparation and the experimental group with mean weights of 357 ± 12 and 368 ± 14, respectively. In the former, a single injection of tulathromycin as in Draxxin® (Zoetis, Mexico) (DRAX group) at a dose of 2.5 mg/kg was injected SC in the lateral view of the neck, utilizing 18 gauge needles 2.5 cm long and a mean volume of 8.7 mL [16]. Similarly, steers from the experimental group were injected with the preparation of tulathromycin manufactured by PiSA Agropecuaria S.A. de C.V., Mexico (Pisadrax®) (PISADRAX group).
Assisted by technicians, blood samples were taken by jugular puncture, collecting 8 mL in Vacutainer tubes with heparin as an additive, at the following times: just before injection, and at 15 min, 1, 2, 4, 8, 12, 24 h the first day and then every 24 h until day 10 (240 h), complying, as far as therapeutic plasma concentrations of the drug are concerned, with Nowakowski, et al. [17] and considering the expected concentration profile vs. time, proposed by EMA 2004 [18].
Sample treatment: Plasma was recovered from blood samples after centrifuging them (4° C; 3500 rpm/ 5 min) and immediately stored and fully identified by freezing at -20° C until analyzed.
Analytical Chemistry
The analytical method was adapted from the one reported by Scheuch, et al. [19] as briefly described below.
Sample preparation: Roxithromycin was added as an internal standard to 0.25 mL aliquots of either the study plasma samples, the TTM-primed plasma samples utilized for the calibration curve, and to the quality control samples. The analytical markers were extracted from the plasma through protein precipitation with 1 mL of acetonitrile. Then, the organic phase was separated and evaporated to dryness under a stream of nitrogen at -40°C. The residue was re-dissolved with 500 µL of a solution of 45:45:10 (v/v) acetonitrile: water ammonium hydroxide solution. From this solution, 10 µL was injected into the chromatographic/mass- spectrometry apparatus.
Chromatographic system: The liquid chromatography system with mass spectrometry (LC-MS/MS) consisted of a Waters-Acquity UPLC chromatograph and a Waters TQD- Electrospray Ionization Detector (ESI), mass spectrometer. The chromatographic separation was carried out with an Acquity UPLC BEH C18 column, using as mobile phase 10 mM ammonium formate with 0.1% formic acid (v/v) in acetonitrile, with a run time of 3 min and a flow of 0.3 ml/min. The mass spectrometer was used in Multiple Reaction Mode (MRM) of positive ions with a transition of 806.68-576.96 m/z for TTM and 837.71- 678.96 m/z for roxithromycin.
The validation study was performed in terms of linearity, specificity, selectivity, accuracy, precision (repeatability and within-laboratory reproducibility), stability, matrix effect, and robustness. The decision limit (CCa), detection capability (CCb), the limit of detection (LOD), and limit of quantification (LOQ) were also estimated as shown in the results section.
Pharmacokinetics and statistical analysis: Data was run through compartmental and non-compartmental models using the programs: PKAnalyst (Micromath Scientific Software, SLM, USA), Phoenix WinNonlin (Certara, USA), and using Origin Pro® (MA, USA) for graphing. Data were indistinguishable considering either model. Pharmacokinetic parameters obtained were: AUC0-240 (µg/mL/h) = area under the concentration vs time curve; AUMC (µg/mL/h) = area under the moment curve; AUC0-∞ (µg/mL/h) = area under the curve extrapolated to infinity; K½el (h) = elimination
200 Plasma concentration (ng/mL)
100 Generic tulathromycin
Reference tulathromycin
24 48 72 96 120 144 168 192 216 240 10
Time (h)
constant; Cmax (µg / mL) = maximum plasma concentration; Tmax (h) = time to achieve Cmax; MRT (h) = mean residence time; Fr (%) = relative bioavailability = AUC0-240 of Pisadrax /AUC0-240 Drax x 100. The area under the concentration-time curve (AUC0-
240), area under the moment curve (AUMC), and AUC0-∞ were calculated using the trapezoidal rule, with extrapolation to infinity using Cmin/λ, where Cmin is the plasma concentration at the last measurable time-point. AUMC/AUC resulted in the mean residence time (MRT). The apparent volume of distribution for AUC0-240 (VdAUC) was calculated as VdAUC = total dose/ VdAUC0-240
- λ , and the total body clearance (ClB) was calculated as ClB = VdAUC
- λ.
After a washout period of 21 days, a crossover maneuver was carried out, following the same conditions as above. Pharmacokinetic parameters were evaluated utilizing ANOVA and Bonferroni t-test using JMP software. The tested preparation (Pisadrax®) was considered bioequivalent if AUC0-240, K½el, and CMAX did not vary more than 20% as compared with the reference preparation (Draxxin®, Zoetis México; group Drax), and with a CI > 90%.
Results
The implemented method presented an average recovery rate of 78.35 % (range 70.45 -89.83 %), with a linearity between 20.0 and 1200.0 ng/mL (r2 > 0.988), with a detection limit of 5.0 ng/mL, a quantification limit of 20.0 ng/mL and an intra-assay and inter-assay error of -12.12 and 13.5 % respectively. (Figure 1) shows mean ± 1SD plasma concentrations of tulathromycin for both groups studied, and up to 240 h post-injection.
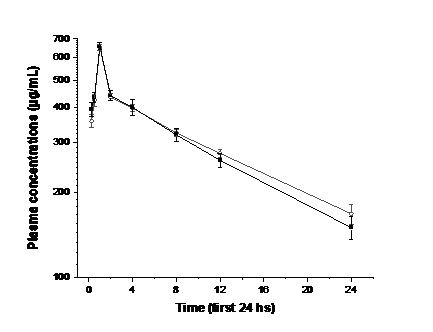
Presenting tulathromycin plasma profiles during the crossover phase was avoided as their remarkable similarity with the first one, was considered redundant. Pharmacokinetic data are summarized in (Table 1 & Table 2) shows the statistical comparison between the pharmacokinetic parameters obtained for Draxxin® and the experimental preparation Pisadrax® by t-tests, with untransformed data. For Tmax, K½el, and MRT, the comparison was made through the Wilcoxon test.
| Parameter | Draxxin® | Pisadrax® |
| C (ng/mL) max | 695 ± 18 | 688 ± 21 |
| T (h) max | 1.8 ± 1.52 | 1.4 ± 1.31 |
| AUC (h· ng/mL) 0-240 | 78,567 ± 2307 | 77,979 ± 2125 |
| AUC (h· ng/mL) 0-∞ | 84,597 ± 2334 | 85,143 ± 2111 |
| AUMC (h· ng/mL) | 82456 ± 1687 | 82354 ± 1452 |
| λ (h-1) z | 0.0034 ± 0.0003 | 0.0034 ± 0.0004 |
| T½λ (h) | 152 ± 10.88 | 153.7 ± 13.62 |
| MRT (h) 0-240 | 167 ± 7.25 | 170 ± 11.79 |
| Vd (L/kg) AUC | 3.75 ± 0.29 | 3.70 ± 0.19 |
| Cl (mL/kg/h) B | 0.11 ± 0.03 | 0.12 ± 0.04 |
Table 1: Mean ± 1 SD pharmacokinetic parameters of tulathromycin obtained from non-compartment analysis of plasma concentration v
Table 1: Mean ± 1 SD pharmacokinetic parameters of tulathromycin obtained from non-compartment analysis of plasma concentration vs. time of tulathromycin after the subcutaneous administration of 2.5 mg/kg of either Draxxin® or Pisadrax to Charolais/Brahman steers. η = 12 steers per group. Cmax, maximum plasma concentration; Tmax, time to reach Cmax; AUC0-240, area under the plasma concentrations versus time curve from 0 to 240 h; AUC0-∞ area under the serum concentrations versus time curve from 0 to infinity; AUMC, area under the moment curve; lz, the slope of the elimination phase; T½λ, elimination half-life; MRT0-240, mean residence time from 0-240 h; VdAUC, apparent volume of distribution as calculated for AUC, after non-intravenous administration; ClB, Total clearance of the drug from the body after SC administration.
| t value | P value | Significance | Difference | 95% Inferior limit | 95% Upper limit | |
|---|---|---|---|---|---|---|
| Cmax(ng/mL) | -1.27 | 0.233 | NS | -173.79 | -478.59 | 131 |
| Tmax(h) | 15 | 0.684 | NS | NA | NA | NA |
| AUC0-240(h·ng/mL) | -0.15 | 0.885 | NS | -228.78 | -3 671.28 | 3 213.72 |
| AUC0-∞(h·ng/mL) | -0.08 | 0.937 | NS | -156.03 | -4 456.36 | 4 144.29 |
| AUMC(h·ng/mL) | -0.09 | 0.94 | NS | -201.5 | -4 212.35 | 3 895.50 |
| λx(h-1) | 0.62 | 0.549 | NS | 0 | 0 | 0.01 |
| T1/2λ(h) | 20 | 0.81 | NS | NA | NA | NA |
| MRT0-240(h) | 7 | 0.093 | NS | NA | NA | NA |
| VdAUC(L/kg) | 0.03 | 0.978 | NS | 0.05 | -3.82 | 3.91 |
| ClB(L/h) | -0.07 | 0.944 | NS | 0 | -0.05 | 0.05 |
Table 2: Statistical values obtained after Student t-tests, non-parametric Wilcoxon test, and confidence intervals when comparing
Table 2: Statistical values obtained after Student t-tests, non-parametric Wilcoxon test, and confidence intervals when comparing pharmacokinetic parameters obtained for tulathromycin after a single SC injection of Draxxin® or Pisadrax® in Charolais/ Brahman steers at a dose of 2.5 mg/kg. η = 12 steers per group. Cmax, maximum plasma concentration; Tmax, time to reach Cmax; AUC0-240, area under the plasma concentrations versus time curve from 0 to 240 h; AUC0-∞ area under the serum concentrations versus time curve from 0 to infinity; AUMC, area under the moment curve; lz, the slope of the elimination phase; T½λ, elimination half-life; MRT0-240, mean residence time from 0-240 h; VdAUC, apparent volume of distribution as calculated for AUC, after non-intravenous administration; ClB, Total clearance of the drug from the body after SC administration. NS = not statistically significant; NA = does not apply Based on the serum profiles of both preparations of tulathromycin, and their pharmacokinetic data obtained, it is possible to conclude that the preparations tested can be regarded as having statistically indistinguishable key pharmacokinetic parameters in cattle i.e., AUC0-240, MRT, and K½el, with confidence intervals higher than 95%, and is therefore bioequivalent.
Discussion
Antimicrobial resistance has the potential to affect almost all sustainable production goals in food-producing animals. Among the many factors that are causing this problem, the poor quality of antibacterial pharmaceutical preparations often used in veterinary medicine, contributes in a significant manner, to heighten bacterial resistance [20]. Apart from good manufacturing practices, pharmacovigilance, and regulatory constraints to use antibacterial drugs, bioequivalence studies are very important if properly manufacture pharmaceutical preparations are going to enter the food-producing market. However, these tests can be very costly, and carry a high financial risk for manufacturers as often the results obtained turn out to be insufficient to consider a pharmaceutical preparation a truly generic treatment alternative. Hence demonstration of BE must be part of the registration file submitted to a given regulatory agency. This is usually not requested from manufacturers in most Latin American countries. Also, an important methodological issue is that BE studies must include an ideal number of participating animals according to the species and that a rational number of blood samples is to be obtained. In this context statistical power of the test should always be part of the research protocol. In this context, G*Power (version 3.1.9.7) is a tool to compute statistical power analyses for many different t-tests, F tests, χ2 tests, z tests, and others [15]. The statistical power of this test showed to be 0.95. The crossover procedure including the number of sampling times and animals converted the power of the test to 0.99. In this study, the plasma concentration profiles of tulathromycin and the PK data derived indicate that the experimental preparation of TTM in test (Pisadrax®) was statistically indistinguishable from the reference one when injected in cattle. Cmax values of 695 ± 18 ng/mL and 688 ± 21 ng/mL for the reference and the generic preparation were not statistically different beyond the 20%, the value required to declare non- bioequivalent a given drug preparation (CI = 98%). However, if TTM is studied as a time-dependent antibacterial drug [10, 11, 12, 21, 22]. The absence of differences in the Cmax would have been inconsequential, and also Tmax would have been important if differences between the experimental and the reference preparations would have been considerable. In this context, it is safe to state that it is unlikely that Cmax and Tmax could have been substantially different if the number of blood samples during the first hours of the sampling period would have been more numerous. This was also the case for T½λ as a lack of statistically significant differences between Draxxin® and Pisadrax® was also (P > 0.8), and is unlikely that increasing the number of sampling times could reveal an important difference. It is also important to underline that apart from some minor differences in the results obtained when comparing the results here obtained with other studies on the pharmacokinetics of TTM in bovine species [17, 23, 24, 25], parameters found in this study comply well with them. Differences are understandable if methodological differences are considered i.e., age of the experimental subjects, pharmacokinetics software, analytical chemistry, to mention a few.
Considering that the relative bioavailability of the generic brand and its MRT values were very similar to the corresponding ones observed in the reference preparation (see Table 3), the PK/PD ratio of T ≥ CMI would be also indistinguishable. This is of utmost importance to warrant the clinical efficacy of tulathromycin [12, 26]. Thus, given the K½el, AUC0-240, and MRT differences observed in this trial between the reference preparation and the generic product, it is feasible to conclude that the preparations tested can be declared BE. Furthermore, because BE can be seen as the absence of a significant difference in the rate and extent to which the active ingredient reaches either the bloodstream or tissues in a given pharmaceutical equivalent(s), clinical efficacy is likely to be comparable [27]. Yet, this latter observation requires further characterization, as in rare occasions molecular differences, such as chirality of the active principle can affect its pharmacodynamics [28, 29].
Susceptibility testing of tulathromycin to find out breakpoints for field isolates indicate that most important respiratory pathogens exhibit MIC50 values that range from 0.125 to 4 µg/mL) [22]. Given the large VDAUC found in this trial and by other authors [17], plus its immunomodulatory and anti-inflammatory actions [30] it can be assumed that drug concentrations at the target site are adequate, as meta- analysis has shown for clinical efficacy [26].
Concluding, the study of BE here presented between the reference preparation of TTM (Draxxin®) and the experimental preparation (Pisadrax®) showed absence of statistically significant differences in the key PK values, and predictably in their key PK/PD ratio (T ≥ CMI), with a power of the test > 0.95.
Acknowledgements
This study was supported by a grant from PAPIIT IT200117, National Autonomous University of Mexico, and CONACyT, National Problems 203.
Conflict of Interest
The authors confirm that they do not have any conflict of interest.
References
-
Martinez MN, Hunter RP (2010) Current challenges facing the determination of product bioequivalence in veterinary medicine. J Vet Pharmacol Therap 33(5): 418- 433.
-
FDA (2006) Department of Health and Human Services, Center for Veterinary Medicine (CVM). Guidance for Industry. Bioequivalence Guidance US, pp: 2-28.
-
FDA (2015) Bioavailability and Bioequivalence Requirements. Department Of Health And Human Services 21(5).
-
EMA (2011) Guideline on the Conduct of Bioequivalence Studies for Veterinary Medicinal Products, pp: 2-30.
-
Toutain PL, Koritz GD (1997) Veterinary drug bioequivalence determination. J Vet Pharmacol Ther 20(2): 79-90.
-
Villarino N, Brown SA, Martín-Jiménez T (2013) The role of the macrolide tulathromycin in veterinary medicine. Veterinary Journal 198(2): 352-357.
-
Mladenov D, Yordanov S, Dimitrova A (2020) Tulathromycin – a semi-synthetic macrolide antibiotic. II Usage in veterinary medicine. Bulgarian Journal of Veterinary Medicine, pp: 1-11.
-
Kilgore WR, Nutsch RG, Spensley MS, Rooney KA, Sun F, et al. (2005) Clinical effectiveness of tulathromycin, a novel triamilide antimicrobial for control of respiratory disease in cattle at high risk for developing bovine respiratory disease. Veterinary Therapeutics 6(2): 136- 142.
-
Lane VM, George LW, Cleaver DM (2006) Efficacy of tulathromycin for treatment of cattle with acute ocular Moraxella bovis infections. J Am Vet Med Assoc 229(4): 557-561.
-
McKellar QA, Sanchez-Bruni SF, Jones DG (2004) Pharmacokinetics/pharmacodynamics relationship of antimicrobial drugs used in veterinary medicine. J Vet Pharmacol Ther 27(6): 503-514.
-
Crosby S, Credille B, Giguère S, Berghaus R (2018) Comparative efficacy of enrofloxacin to that of tulathromycin for the control of bovine respiratory disease and prevalence of antimicrobial resistance in Mannheimia haemolytica in calves at high risk of developing bovine respiratory disease. J Anim Sci 96(4): 1259-1267.
-
Papich MG (2014) Pharmacokinetic-pharmacodynamic (PK-PD) modeling and the rational selection of dosage regimes for the prudent use of antimicrobial drugs. Veterinary Microbiology 171(3-4): 480-486.
-
Holman DB, Yang W, Alexander TW (2019) Antibiotic treatment in feedlot cattle: a longitudinal study of the effect of oxytetracycline and tulathromycin on the fecal and nasopharyngeal microbiota. Microbiome 7(1): 86.
-
MOS (1999) Technical Specifications for the Production, Care and Use of Laboratory Animals. Department of Agriculture, Livestock, Rural Development, Fisheries and Food. United Mexican States.
-
Faul F, Erdfelder E, Lang AG, Buchner A (2007) G*Power 3: A flexible statistical power analysis program for the social, behavioral, and biomedical sciences. Behavior Research Methods 39(2): 175-191.
-
Letavic MA, Bronk BS, Bertsche CD, Casavant JM, Cheng H, et al. (2002) Synthesis and activity of a novel class of tribasic macrocyclic antibiotics: The triamilides. Bioorganic & Medicinal Chemistry Letters 12(19): 2771- 2774.
-
Nowakowski MA, Inskeep PB, Risk JE, Skogerboe TL, Benchaoui HA, et al. (2004) Pharmacokinetics and lung tissue concentrations of tulathromycin, a new triamilide antibiotic, in cattle. Veterinary therapeutics 5(1): 60-74.
-
EMEA VM, I (2004) Committee for Veterinary Medicinal Products Tulathromycin Summary Report (2). European Medicines Agency, Veterinary Medicines and Inspections, UK, pp: 2-9.
-
Scheuch E, Spieker J, Venner M, Siegmund W (2007) Quantitative determination of the macrolide antibiotic tulathromycin in plasma and broncho-alveolar cells of foals using tandem mass spectrometry. J Chromatogr B Analyt Technol Biomed Life Sci 850(1-2): 464-470.
-
Clifford K, Desai D, Prazeres da Costa C, Meyer H, Klohe K, et al. (2018) Antimicrobial resistance in livestock and poor quality veterinary medicines. Bulletin of the World Health Organization 96(9): 662-664.
-
Toutain PL, Lees P (2004) Integration and modeling of pharmacokinetic and pharmacodynamic data to optimize dosage regimens in veterinary medicine. J Vet Pharmacol Ther 27(6): 467-477.
-
Godinho KS, Wolf RM, Sherington J, Rowan TG, Sunderland SJ, et al. (2005) Efficacy of Tulathromycin in the Treatment and Prevention of Natural Outbreaks of Bovine Respiratory Disease in European Cattle. Veterinary Therapeutics 6(2): 122-135.
-
Tohamy MA, El-Gendy AAM, Attia TA (2011) Some pharmacokinetic aspects of tulathromycin in Fresian cattle calves. Journal of American Science 7(5): 651-655.
-
Mzyk DA, Bublitz CM, Hobgood GD, Martinez MN, Smith GW, et al. (2018) Effect of age on the pharmacokinetics and distribution of tulathromycin in interstitial and pulmonary epithelial lining fluid in healthy calves. Am J Vet Res 79(11): 1193-1203.
-
Mzyk DA, Bublitz CM, Martinez MN, Davis JL, Baynes RE, et al. (2019) Impact of bovine respiratory disease on the pharmacokinetics of danofloxacin and tulathromycin in different ages of calves. PLoS One 14(6): e0218864.
-
Wellman NG, O’Connor AM (2007) Meta‐analysis of treatment of cattle with bovine respiratory disease with tulathromycin. J Vet Pharmacol Ther 30(3): 234-241.
-
Nagadurga DH (2019) Bioavailability and Bioequivalence Studies. Pharmaceutical Formulation Design. Recent Practices.
-
Hutt AJ, O’Grady J (1996) Drug chirality: a consideration of the significance of the stereochemistry of antimicrobial agents. J Antimicrob Chemother 37(1): 7-32.
-
Elder FC, Feil EJ, Snape J, Gaze WH, Kasprzyk-Hordern B (2020) The role of stereochemistry of antibiotic agents in the development of antibiotic resistance in the environment. Environment International 139: 105681.
-
Fischer CD, Beatty JK, Duquette SC, Morck DW, Lucas MJ, et al. (2013) Direct and Indirect Anti-Inflammatory Effects of Tulathromycin in Bovine Macrophages: Inhibition of CXCL-8 Secretion, Induction of Apoptosis, and Promotion of Efferocytosis. Antimicrob Agents Chemother 57(3): 1385-1393.
- Effects of 5-HTP and Melatonin on the Sleep Cycle of Medical Students
- Adsorption of Bisphenol A on NH4OH- Modified Rice Husk and Sugar Cane Bagasse Biochar
- Comparative Assessment of the Reinforcement Efficiency of Palm Fruit Fibre and Coconut Fibre in High Density Polyethylene (HDPE) Matrix Composite
- Importance of Bio Compounds Naturally Present in Food with Functionality in Animal Metabolism
- Sub-Acute Study on the Cardiotoxic Effects of Monosodium Glutamate Ingestion in Albino Rat
- Weight Management and Its Natural Solutions: A Review