Correlation of Fructosamine and HbA1c (Glycosylated Haemoglobin) in Type 2 Diabetes Mellitus Patients with Chronic Kidney Disease
Background: In 2015, India had 69.2 million diabetes and 36.5 million impaired Glucose Tolerance (IGT) people (20-79yrs) which are expected to rise to 123.5 million and 63.6 million by 2040 respectively. Therefore need for assessing correct glycemic status of patients of Diabetes Mellitus as well as Diabetes Mellitus patients with CKD at correct time becomes necessary. Use of Fructosamine for the analysis of blood glucose levels might give better, comparatively fast results in these patients. Aims: The purpose of this study was to find out the correlation between Fasting Blood sugar, Fructosamine and HbA1c( Glycosylated haemoglobin) in patients of Type 2 Diabetes Mellitus with and without kidney disease Method: A total of 100 patients were taken and divided into 2 groups: Group A (n=50) – Patients with Diabetes Mellitus and Group B (n=50)- Patients with Diabetes Mellitus and Chronic Kidney Disease. 50 healthy controls (without DM and CKD) were taken. Result: Mean value of Fasting blood glucose in Group A – 186mg/dL SD- 52.2; Group B-182mg/dL, SD - 49.4. (t=0.781, p=0.437).The patients with DM and CKD (Group B) had lower levels of mean HbA1c (6.93%) as compared to Group A (DM), mean HbA1c -8.4%.There was significant difference between the groups (t=5.396, p<0.001). The mean of Fructosamine in Group A-439, SD-127 , Group B-421,SD-112.(t=0.757,p=0.451).Our study also showed that in different stages of CKD ,there was no statistical difference between Fructosamine and HbA1c (HbA1c Vs GFR: r= - 0, 038, p=0.817, Fructosamine Vs GFR :r= -0.057, p=0.726). Conclusion: Serum Fructosamine is superior to HbA1c in assessing blood glucose control in Diabetes Mellitus patients with CKD.
Introduction
The dysregulated metabolism which is associated with DM cause secondary pathophysiologic changes in multiple organ system that inflict immense load on the individuals with DM and on the health care system. CKD encircles a spectrum of pathophysiologic processes associated with progressive decrease in kidney functions and GFR. One of the leading cause of CKD is Diabetic Nephropathy [1, 2].
Handling of DM and DM with CKD go around achieving target glycemic control with the help of anti-diabetic medications or insulin. There are various methods to measure glycemic status of the patients like Short term methods like Fasting blood sugar level and Post prandial blood sugar levels, Medium term methods like Fructosamine and Long term methods like HbA1c.
HbA1c is often used as an indicator of glucose control over latest 2-3 months & is corresponds with the development of long - term diabetic complications [3, 4]. Glucose reacts covalently with the alpha – amino group of the beta chain of Haemoglobin and forms Schiff base, which undergoes reduction. This covalent reaction process is called Haemoglobin A1c or Glycosylated haemoglobin. Glycosylated haemoglobin levels are measured as a percentage of total haemoglobin. % levels that are greater than 6.5 are indicative of Diabetes Mellitus [5]. Although HbA1c has remained the standard biomarker for glycemic control, it has some pitfalls too. Any condition that reduces the life of erythrocyte or is associated with increased red cell turnover reduces the display of the cell to glucose, resulting in lower HbA1c levels. Conditions like haemolytic anaemia, acute and chronic blood loss & splenomegaly can cause falsely lower HbA1c levels [6]. Patients with End Stage Renal disease normally have false low HbA1c values because of lower Erythropoietin production and chronic anaemia with decreased red cell survival [6]. On the other hand measurement of Fructosamine is unaltered by RBC disease.
Serum Fructosamine is a non-enzymatic glycosylated protein that helps in the assessment of hyperglycaemia. As albumin is the most abundant serum protein, fructosamine is predominantly a measure of Glycated albumin. Regarding Haemoglobin whose life span in red blood cells is 90-120 days. Non immunoglobin serum proteins has much lower half life, approx. 14-21 days. Thus, Fructosamine gives glycemic status of 2-3weeks [7].
Aims
In this study we have done the correlation of Fasting blood sugar, HbA1c and Fructosamine in patients of with Type 2 DM with and without CKD. We have also correlated HbA1c and Fructosamine with GFR in Group B patients (DM with CKD) to find out their status in various stages of CKD. Our purpose was to improve the appropriate use of Fructosamine in clinical practice.
Materials and methods
Our study was an Analytical cross sectional study that was carried out in Maharani LaxmiBai Medical College, Jhansi in which we took 100 patients, out of which 50 patients with Diabetes Mellitus were kept in Group A and 50 patients that had Diabetes Mellitus with CKD were kept in Group B. 50 healthy controls were taken (without DM and CKD). This study was conducted over a period of 1 year and 2 months from September 2021 to November 2022 and it comprised of Type 2 Diabetes Mellitus patients attending the Internal Medicine and Nephrology outdoor patient department and indoor patients requiring assessment of glycemic control. All the Diabetes Mellitus patients attending the Internal Medicine Department and Department of Nephrology OPD and IPD and consenting to be part of study were enrolled in the study. The preliminary details of the patients like Age, Gender and Duration of Diabetes Mellitus were entered in the questionnaire. The patients who were advised for Laboratory evaluation of: Complete blood count, Kidney Function Test, Fructosamine, Fasting Blood sugar, HbA1c and Urinary protein were followed up. HbA1c was measured with Bio-Rad D10 and Fructosamine was analysed by using blood serum in fully automated biochemistry analyser-Selectra Pro M. The patients were also enquired for CKD and its duration.
FRUCTOSAMINE normal range - 122-236 micro mole/L (Randox -Fructosamine Enzymatic Assay rx DAYTONA kit) GFR was calculated using MDRD (Modification of Diet in Renal Disease): GFR in mL/min per 1.73 m2 = 175 x serum Cr (mg/dL)- 1.154 x age (years) - 0.203 x 1.212(if patient is black) x0.742(if female)
Inclusion Criteria
- The type 2 Diabetes Mellitus patients who are willing to be part of the study and give consent were included in the study.
- Patients of type 2 diabetes mellitus with chronic kidney disease were included.
- Age group - > 21 years
- Patients on oral hypoglycemic drugs or insulin therapy
- Chronic Kidney Disease patients with various stages ( Staging is done by estimating GFR ) G1 - Normal or high, >= 90 G2 - Mildly decreased, 60 - 89 G3a - Mildly to moderately decreased, 45-59 G3b- moderately to severely decreased, 30-44
G4 – Severely decreased, 15-29 G5 – Kidney Failure, <15
Exclusion criteria
- Those patients who had Type 1 diabetes
- Pre-diabetics
- Those who were not on any Hypoglycemic drugs or Insulin.
- Those who did not have Chronic kidney disease.
Statistical analysis
The categorical variables like gender and presence of CKD were summarised as frequency and percentages while the laboratory parameters were summarised using Mean and Standard Deviation. The association between CKD and laboratory parameters (continuous variables) was assessed using Student’s T test. Correlation between laboratory parameters was assessed using Pearson’s correlation coefficient. p value of <0.05 was taken as significant. Graphical representations were used where applicable. All analysis was done using SPSS 20.0.
Result
In both the groups (group A and group B) majority of patients belonged to the age group between 41 - >60 [Group A: 41-50 years (28%), 51- 60yrs (30%), >60 years (38%) ; Group B : 41- 50 (22%) , 51-60 (20%) , >60 years (40%)] .There was no significant difference between the groups in terms of distribution of age (p=0.157).
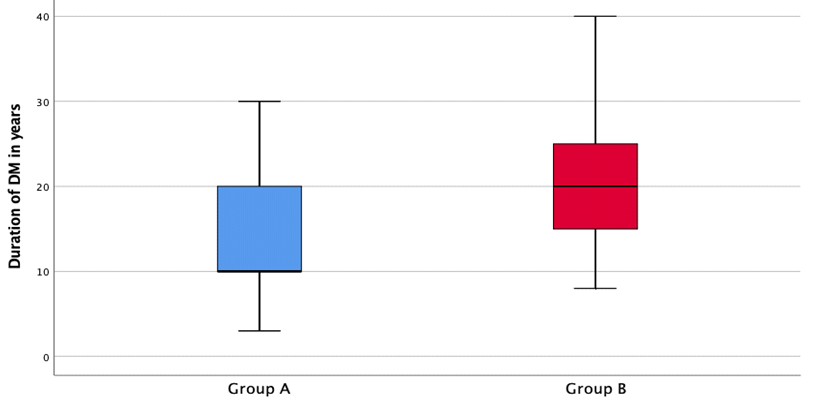
In both the groups, there was predominance of Male patients (Group A – 60%, Group B – 74%).There was no significant difference between the groups in terms of gender (p =0.137). Mean value of Fasting blood glucose in Group A – 186mg/dl SD-52.2 ; Group B- 182 mg/dl , SD-49.4.There was no significant difference between the two groups in terms of Fasting blood glucose (mg/dl) (t= 0.781 , p= 0.437).The mean (SD) of Duration of DM in Group A was 14.2 SD –7.04 years .While , the mean (SD) of Duration of DM in Group B was 19.2 SD – 7.66 years .There was significant difference between 2 groups (t=3.86,p<0.001) . The Box – Whisker plot depicts the distribution of duration of DM in the 2 groups (Figure 1).
The patients with Diabetes mellitus and CKD (Group B) had lower levels of mean HbA1c ( 6.93 %) as compared to patients in Group A (without CKD) (mean HbA1c – 8.4%). There was a significant difference between the two groups (t =5.396, p< 0.001).
The mean (SD) of Fructosamine in Group A- 439 (127), Group B – 421 (112).There was no significant difference between the two groups in terms of Fructosamine levels (t= 0.757, p = 0.451).
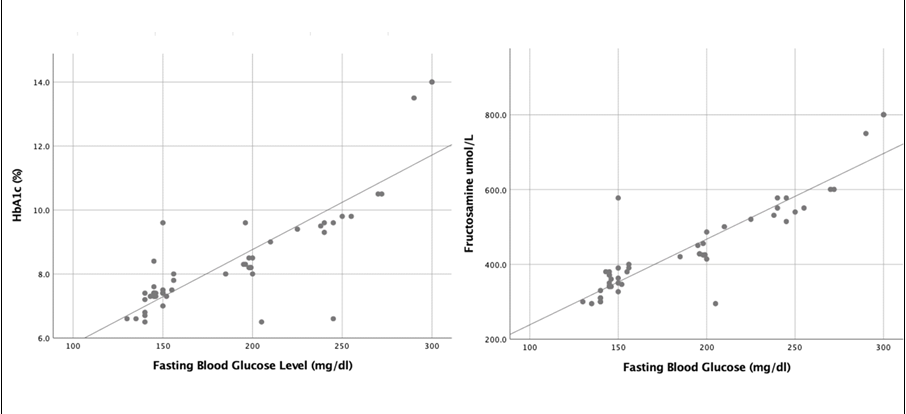
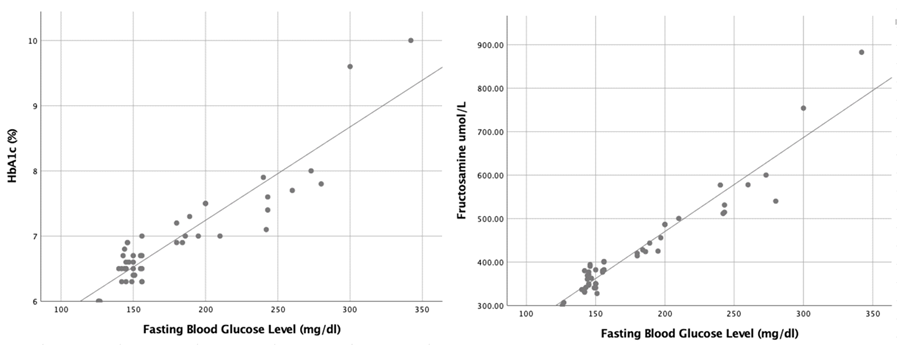
Among the Group A patients, there was a strong positive correlation between fasting blood glucose (mg/ dL) and HbA1c (%) [r=0.918, p<0.001], HbA1c (%) and Fructosamine (micro mole/L) [r=0.966, p<0.001] , and also between Fasting blood glucose(mg/dL) and Fructosamine (micro mole/L ) (r=0.961, p<0.001) (Figure 2). Among the Group B patients, there was a strong positive correlation between Fasting blood glucose (mg/dL) and HbA1c [r=0.835, p<0.001], HbA1c (%) and Fructosamine (micro mole/L) [r=0.942, p<0.001] and also between Fasting blood glucose (mg/dL) and Fructosamine (micro mole/L) [r=0.903, p<0.001] (Figure 3). Although significant, these coefficients were lower as compared to Group A patient. The values of Fructosamine were better correlated with Fasting blood glucose in comparison to correlation between HbA1c and Fasting blood glucose.
Our study also showed that patients with Diabetes Mellitus with CKD (group B) were anaemic in comparison to group A (DM without CKD). There was a significant difference between the two groups in terms of Haemoglobin (t= 6.628, p < 0.001). To the best of our knowledge, HbA1c levels could be affected by Haemoglobin variability because of low erythropoietin secretion and haemolysis, thus giving False Low values. In Group B patients, Serum albumin (gm/dL) versus HbA1c had a negative correlation (r=-0.100, p=0.506 and Serum albumin (mg/dL) versus Fructosamine (micro mole/L) had a negative correlation (r=-0.172, p=0.243). We found that, the number of patients with +1, +2 and +3 urine protein were 19, 23 and 8 respectively (N=50, Group B). The highest mean Fructosamine level was in those with +1 urine protein. The mean difference between these 3 groups in terms of Fructosamine level was not statistically significant indicating that there exists no association between urine protein and Fructosamine level (Table 1).
- Urine Protein
- Number of patients n (%)
- Mean±SD
- F-value p-value
- +1
- 19 (38.0)
- 446.5±131.3
- 1.141
- +2
- 23 (46.0)
- 396.2±83.1
- +3
- 8 (18.0)
- 421.7±111.6
Table 1: Mean difference in Fructosamine level in micro mole/L in Group B patients categorised as per urine protein level.
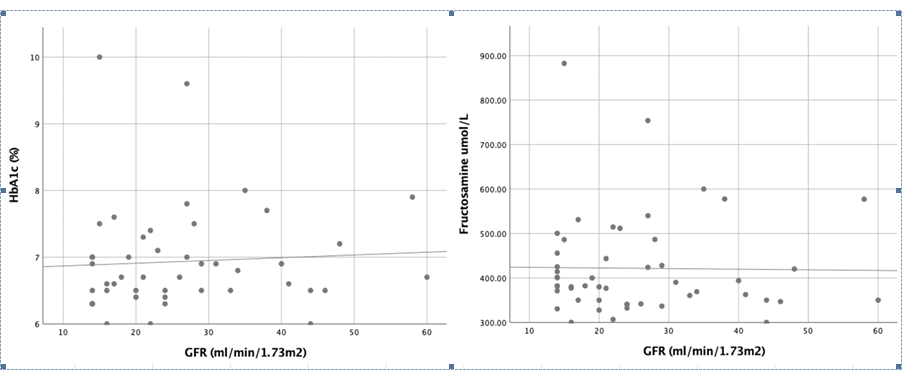
Our study showed that in different stages of CKD, there was no statistical significant difference between fructosamine and HbA1c. There was non- significant negative correlation between HbA1c and GFR (r= - 0.038, p = 0.817).However, from Scatter plot we depicted that at low GFR there was more scattering at lower values of HbA1c (between 6.3- 7.3 %) (Figure 4, left side). There was non-significant negative correlation between Fructosamine and GFR (r =- 0.057, p = 0.726). (Figure 4, right side)
Among the healthy Controls (N=50), the majority of participants belonged to the age group of 26-30 years (50%). There was a predominance of males at 80%. There was a strong positive correlation between Fasting blood glucose and HbA1c, r=0.910, p<0.001, HbA1c and Fructosamine, r=0.952 , p<0.001 and also between Fasting blood glucose and Fructosamine, r=0.952 , p<0.001.
Discussion
Diabetes Mellitus is the leading cause of End Stage Renal Disease2. As there is reduced Erythropoietin production and haemolysis in patients of CKD, patients suffer from Anaemia. HbA1c, therefore gives false lower values .Alternative methods for estimating glycemic levels should be used, so that patients with Diabetes Mellitus with CKD can be treated properly. As Fructosamine is glycated protein and is unaltered by anaemia in patients of DM with CKD, it correctly estimates blood glycemic level. We found that HbA1c levels in patients with DM with CKD was comparatively lower, while Fructosamine levels in both the Groups was consistent and did not show any significant diversion, in contrast to the findings of Lubaina Presswala, et al [7]. A study done by Ladan Hosseini Gohari, et al [8] in which they found Fructosamine/ HbA1c ratio in DM-Hemodialysis patients was significantly higher than that in DM- NonHemodialysis patients, p=0.002.
Our study also showed that patients with Diabetes Mellitus with CKD (group B) were anaemic in comparison to group A (DM without CKD). There was significant difference between the two groups in terms of Haemoglobin (t =6.628, p< 0.001) to the best of our knowledge, HbA1c levels could be affected by haemoglobin variability, thus giving false low values. Similar findings were observed in a study conducted by I- ChingKuo, et al [9] and Ma J, et al [10]. Another study conducted by Michael S. Radin concluded that in patients with end stage renal disease, HbA1c tends to underestimate patients average glycemic and the clinician should consider using alternative index of glycemic control [11].
Our study also showed that in different stages of CKD, there was no statistical significant difference between Fructosamine and HbA1c. There was non-significant negative correlation between HbA1c VsGFR, r= -0.038,p=0.817. FructosamineVs GFR also showed non-significant negative correlation ,r=-0.057, p=0.726 (Figure 4) in contrast to the findings of Ting Gan, Xin Liu and Gaosi Xu [12], who observed that glycated protein is superior to HbA1c in depicting the correct glycemic levels in Advanced CKD.
Limitations of the study
This was a single-centered study.
Conclusion
Our findings imply that in individuals with Diabetes Mellitus and Chronic Kidney disease and increased Fasting
blood glucose, Fructosamine may potentially be a more trustworthy marker of glycemic levels. Thus Fructosamine can be used as an alternative to HbA1c in assessing blood glucose control in patients of Diabetes Mellitus with and without Chronic Kidney Disease. However, additional large scale studies are required to show whether Fructosamine predicts correct blood glycemic levels in patients with Diabetes Mellitus and CKD, above that of HbA1c.
Acknowledgment
The authors would like to thank Department of General Medicine and Department of Nephrology, Maharani Laxmi Bai Medical College, Jhansi, Uttar Pradesh.
References
-
Anjana RM, Pradeepa, Deepa M, Data M, Sudha, et al. (2011) Prevelanece of diabetes and pre diabetes (impaired fasting glucose and/or impaired glucose tolerance) in urban and rural India: Phase 1 results of the indian council of medical research – India diabetes (ICMR- INDIAB) study. Diabetologia 54: 3022-3027.
-
Harrison’s Internal Medicine21st edition
-
Boden G, Master RW, Gordon SS, Shuman CR, Owen OE (1980) Monitoring metabolic control in diabetic outpatients with glycosylated haemoglobin. Ann Intern Med; 92: 357-360.
-
Henry’s Clinical Diagnosis and Management by Laboratory Methods, 24th edn (2021)..
-
Zhu NA, Reichert S, Harris SB (2020) Limitations of hemoglobin A1c in the management of type diabetes mellitus. Can Fam Physician 66(2): 112-114.
-
Roohak HV, Zaidi ARA (2008) review of glycated albumin as an intermediate glycation index for controlling diabetes. JDiabetes Ski Techno 2(6): 1114-1121.
-
Pressswala L, Hong S, Harries Y, Romao I, Zhang M, et al. (2019) Continuous glucose monitoring and glycemic control in patients with Type 2 Diabetes Mellitus and CKD 1(5): 281-287.
-
Gohari LH, Moghadam F, Mahdi Y, Rajab A, Broumand B (2011) Fructosamine as a complementary fasting blood sugar test for glycemic control in diabetic patients on hemodialysis Laboratory Medicine 42(3): 168-170.
-
Kuo C, Lin HYH, Niu SW, Lee JJ, Chiu YW, et al. (2018) Anaemia modifies the prognostic value of glycatedhaemoglobin in patients with diabetic chronic kidney disease. PLoS One 13(6): e0199378.
-
Ma J, Dou Y, Zhang H, Thijssen S, Williams S, et al (2017) Correlation between inflammatory Biomarkers and Red Blood cell life span in Chronic Hemodialysis patients. Blood Purif 43(1-3): 200-205.
-
Radin MS, (2014) Pitfalls in HaemoglobinA1c Measurements: When Results may be Misleading. journal of General Internal Medicine 29 388-394.
-
Gan T, Liu X, Xu G (2017) Glycated albumin verses HbA1c in the evaluation of glycemic control in patients with Diabetes and CKD. Kidney Int Rep 3(3): 542-554.
- Genomic Landscape of Aggressive Penile Squamous Cell Carcinoma including TERT-p and NOTCH1 Mutations – An Institutional Experience
- Establishment of Baseline Haematological Values for Canine Population in North-Central Nigeria: A Cross-Sectional Study in the Federal Capital Territory
- Biochemical Assessment of Uroliths Extracted in Patients with Urolithiasis in a Tertiary Health Institution
- Update on Gastrointestinal Pecomas: Molecular Pathogenesis and Risk Stratification
- A Comparative Study of Serum C-reactive Protein Level Between Pre-eclampsia and Normal Pregnancy in Tertiary Level Hospital
- From Deformity to Alignment: Clinical Outcomes of the Schnepp Osteotomy in Hallux Valgus in 47 Feet