Temporal Analysis of COVID-19 Peak Outbreak
Intent of this research is to explore how mathematical models, specifically Susceptible-Infected-Removed (SIR) model, can be utilized to forecast peak outbreak timeline of COVID-19 epidemic amongst a population of interest starting from the date of first reported case. Till the time of this research, there was no effective and universally accepted vaccine to control transmission and spread of this infection. COVID-19 primarily spreads in population through respiratory droplets from an infected person’s cough and sneeze which infects people who are in proximity. COVID-19 is spreading contagiously across the world. If health policy makers and medical experts could get early and timely insights into when peak infection rate would occur after first reported case, they could plan and optimize medical personnel, ventilators supply, and other medical resources without overtaxing the infrastructure. The predictions may also help policymakers devise strategies to control the epidemic, potentially saving many lives. Thus, it can aid in critical decision-making process by providing actionable insights into COVID-19 outbreak by leveraging available data.
Introduction
Coronavirus is a large family of viruses causing illness in both animals and/or humans. Over last decade or so, several other coronaviruses are known to cause respiratory infections in humans, ranging from the common cold to more severe diseases such as Middle East Respiratory Syndrome (MERS) and Severe Acute Respiratory Syndrome (SARS). The recently discovered coronavirus causes coronavirus disease COVID-19. Today COVID-19 is causing a global pandemic affecting almost all countries [1].
Data from health organizations indicate that asymptomatic individuals can transmit the virus without themselves showing any signs of infection. Disease control organizations across the globe are investing in research on this topic and how often this happens. Recovery from novel coronavirus usually takes 14 days [2]. About 5%– 15% of patients with COVID-19 infection require intensive care surveillance and ventilator support [3]. This poses a challenge for health planners and administrators as to how to optimally plan and allocate medical staff and other resources such as ventilators etc. in a large sized country such as India. According to a joint report [4] by Princeton University and The Center for Disease Dynamics, Economics & Policy (CDDEP), most of the beds and ventilators in India are concentrated in seven States only. The report also mentioned that bed capacity was saturated at hospitals and any spike in COVID-19 cases would require drastic expansion of hospital beds and ventilators. This problem represents crux of the issue that the current research is trying to address by using mathematical modeling to predict peak COVID-19 outbreak timeline in various states across India.
Methodology
Model
For the purpose of this research, compartmental class of mathematical models is used in modelling COVID-19. Specifically, Kermack-McKendrick Susceptible-Infected- Removed (SIR) model [18] is employed which distributes population in 3 compartments with labels - S, I, or R at any point of time. S is the number of susceptible individuals, I is the number of individuals infected, R is the number of individuals who have recovered and developed immunity to the infection. The number of S, I and R individuals may vary over time, but total population remains constant. Model computes the predicted number of people infected with a contagious illness in a closed population over time. The model assumes fixed size homogeneous population with no social or spatial structure. An individual with COVID-19 is infectious for approximately 14 days [19]. Let’s assume during these 2 weeks period, they can potentially pass COVID-19 to approximately 5 people. These 2 parameters determine the model inputs viz γ, the recovery rate (= 14 days) and β, rate of infection (=1/5 = 0.2).
Using these parameters, the time to reach peak COVID-19 outbreak starting from first reported case is predicted by solving below system of three linked nonlinear ordinary differential equations in Python [20]: dS SI dt N dI SI I dt N dR I dt β = − β γ = − γ =
Data
COVID-19 statistics data till 15-August-2020 used in this research has been sourced from NDTV [21]. Population figures for the 10 largest states in India have been taken from Statistics Times [22]. Together these 10 states constitute more than 74% of total population in India (Table 1 & Figure 1).
| State | Population |
|---|---|
| Uttar Pradesh | 237,882,725 |
| Bihar | 124,799,926 |
| Maharashtra | 123,144,223 |
| West Bengal | 99,609,303 |
| Madhya Pradesh | 85,358,965 |
| Rajasthan | 81,032,689 |
| Tamil Nadu | 77,841,267 |
| Karnataka | 67,562,686 |
| Gujarat | 63,872,399 |
| Andhra Pradesh | 53,903,393 |
Table 1: 10 Largest States in India by Population.
Results
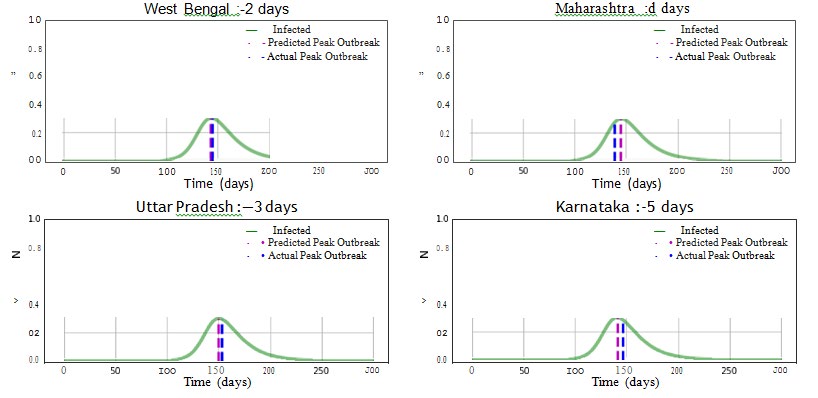
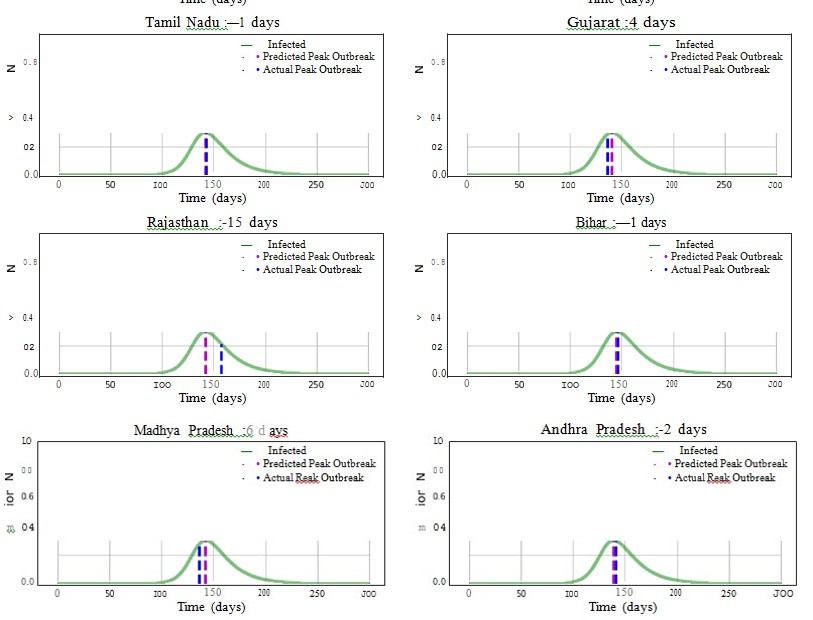
The SIR model predicted peak COVID-19 outbreak timelines for the states included in the research as presented in Table 2 below and corresponding figures.
| State | Actual Peak (Date) | Predicted Peak (Date) | Error (Days) |
|---|---|---|---|
| Uttar Pradesh | 15-Aug-20 | 12-Aug-20 | -3 |
| Bihar | 15-Aug-20 | 14-Aug-20 | -1 |
| Madhya Pradesh | 27-Jul-20 | 2-Aug-20 | 6 |
| Rajasthan | 10-Aug-20 | 8-Aug-20 | -2 |
| Tamil Nadu | 4-Aug-20 | 10-Aug-20 | 6 |
| Karnataka | 6-Aug-20 | 22-Jul-20 | -15 |
| Gujarat | 28-Jul-20 | 27-Jul-20 | -1 |
| Andhra Pradesh | 3-Aug-20 | 29-Jul-20 | -5 |
| Gujarat | 3-Aug-20 | 7-Aug-20 | 4 |
| Andhra Pradesh | 1-Aug-20 | 30-Jul-20 | -2 |
Table 2: Peak Outbreak Date Comparison (Actual vs Model Predicted).
Discussion
This research was conducted to evaluate the feasibility of application of SIR model to predict peak COVID-19 outbreak timeline from the date of first reported case for the 10 largest states in India which together constitute more than 74% or almost 3/4th of total population in India. The broader goal is to analyze and evaluate SIR model to provide early insights to public health agencies which in turn can expedite optimum response to COVID-19 epidemic.
The research results indicate that for 9 out of these 10 states, SIR model could predict peak COVID-19 outbreak timeline from the date of first reported case with error of +/-6 days or less, Standard Deviation (SD) in error = 5.83 days and Mean Absolute Deviation (MAD) in error = 4.1 days.
Conclusion
Aim of this research paper was to predict COVID-19 peak timeline in various Indian states using SIR model. For 9 out of 10 largest states in India included in the research, chosen SIR model could predict peak outbreak timeline from the date of the first reported case with error of +/-6 days or less and Standard Deviation (SD) in error = 5.83 day. These 9 states constitute over 70% of total population of India.
The model results present a potential opportunity for health policy makers and medical experts to gain early and timely insights into COVID-19 peak outbreak timelines for a large proportion of population in India. They could use these insights to plan and optimize medical personnel and equipment or to devise strategies to control the epidemic, well before it hits its peak. While SIR models have been extensively used, there is little research on validating their predictions. This research provided pragmatic validation of SIR models over a large population.
Limitations
Compartmental models are in many ways favorable to other exotic models due to their simplicity and minimal computational requirements. However, SIR models assume several assumptions [23] that do not exist in real world epidemic conditions. The SIR model assumes that there is homogeneous mixing of the infected and susceptible individuals and that the total population is constant in time. In the classic SIR model, the susceptible population decreases monotonically towards zero. However, these assumptions are not strictly valid in the case of COVID-19 outbreak, since new hot-spots spike at different times. Also, the effect of enforcing social distancing measures by respective government and health agencies has not been considered.
This research does not attempts to perform an exhaustive study because of lack of suitable data as well as uncertainty in different factors, namely, the degree of home isolation, restrictions in social contact, the initial number of infected and exposed individuals, variations in incubation and infectious periods, and the fatality rate.
Future Scope
Population density, geographic area, demographics such as age and effect of social isolation etc. are possibly some parameters to consider and include in building more advanced epidemiology models for predicting peak epidemic outbreak timeline. Disease spread models can also be used to predict number of infected individuals to better manage epidemics.
References
-
(2020) Coronavirus disease (COVID-19) pandemic. World Health Organization (WHO).
-
India Today magazine.
-
Möhlenkamp S, Thiele H (2020) Ventilation of COVID-19 patients in intensive care units (2020). Herz 45: 329- 331.
-
The Center For Disease Dynamics, Economics and Policy (CDDEP).
-
Chowell G, Miller MA, Viboud C (2007) Seasonal influenza in the United States, France and Australia: transmission and prospects for control. Epidemiol Infect 136(6): 852- 864.
-
Bootsma MC, Ferguson NM (2007) The effect of public health measures on the 1918 influenza pandemicin US cities. Proc Natl Acad Sci U S A 104(18): 7588-7593.
-
Chowell G, Ammon CE, Hengartner NW, Hyman JM (2006) Transmission dynamics of the great influenza pandemic of 1918 in Geneva, Switzerland: assessing the effects of hypothetical interventions. J Theor Biol 241(2): 193-204.
-
Mills CE, Robins JM, Lipsitch M (2004) Transmissibility of 1918 pandemic influenza. Nature 432: 904-906.
-
Vynnycky E, Edmunds WJ (2008) Analyses of the 1957 (Asian) influenza pandemic in the United Kingdomand the impact of school closures. Epidemiol Infect 136(2): 166-179.
-
Longini IM, Fine PE, Thacker SB (1986) Predicting the global spread of new infectious agents. Am J Epidemiol 123(3): 383-391.
-
Cauchemez S, Valleron AJ, Boelle PY, Flahault A, Ferguson NM (2008) Estimating the impact of school closure on influenza transmission from Sentinel data. Nature 452: 750-754.
-
Cuevas E (2020) An agent-based model to evaluate the COVID-19 transmission risks in fa-cilities.Computers in Biology and Medicine 121: 103827.
-
Waldherr A, Wijermans N (2013) Communicating Social Simulation Models to Sceptical Minds. Journal of Artificial Societies and Social Simulation 16(4): 13.
-
Kumar P, Ram KS, Nanda C, Kalita H, Patairiya S, et al. (2020) Forecasting COVID-19 impact in India using pandemic waves Nonlinear Growth Models. MedRxiv.
-
Prakash MK, Kaushal S, Bhattacharya S, Chandran A, Kumar A, et al. (2020) A minimal and adaptive prediction strategy for critical resource planning in a pandemic. MedRxiv.
-
Mondal S, Ghosh S (2020) Possibilities of exponential or sigmoid growth of Covid19 data in different states of India. MedRxiv.
-
Virk JS, Ali SA, Kaur G (2020) Recent update on COVID-19 in India: Is locking down the country enough?. MedRxiv.
-
Kermack WO, McKendrick AG (1927) A Contribution to the Mathematical Theory of Epidemics. Proc Roy Soc Lond 115(772): 700-721.
-
SciPy. https://docs.scipy.org/doc/scipy/reference/ generated/scipy.integrate.odeint.html
-
(2020) Coronavirus Outbreak Live Statistics. NDTV.
-
Statistics Times. http://statisticstimes.com/ demographics/population-of-indian-states.php
-
Beretta E, Takeuchi Y (1995) Global stability of an SIR epidemic model with time delays. Journal of Mathematical Biology 33: 250-260.
- Epidemiological Surveillance and Rumors on Social Media
- Awareness and Treatment of Uncontrolled Hypertension in US Overweight/Obese Youths Aged 16–24 Years, NHANES 2021–2023
- Strengthening EPI Through Parental Engagement: Lessons from Dhaka Slums for IA-2030
- Mothers Knowledge of the Prevalence, Causes, Effects, Prevention and Control of Diarrhoea among Children in Ife East Local Government Area, Ile Ife, Osun State, Nigeria
- Covid-19 Reinfections Case Series from October 2023 to October 2024 in A General Medicine Office in Toledo (Spain)
- Water Contact! One Risk Too Many: Risk Factors Associated with Schistosoma haematobium infection in Osun State, Nigeria