Evaluation of Health Education Material Used on Cigarette Packs for Anti-Smoking Campaigns
Objective: To assess the quality and effectiveness of visual/printed health education material on cigarette packs for the Colombian anti-smoking campaigns. Methods: Evaluative study, with a quantitative, descriptive, cross-sectional approach; 171 smokers assessed 21 warning images found on packs of cigarettes used in Colombia through an instrument of the Pan American Health Organization-PAHO. This study analyzed the arithmetic means for continuous and discontinuous variables, as well as proportions for the nominal or categorical variables with their corresponding confidence intervals (CI). In the analytical phase, a Pearson's Chi-Square parametric test was performed; A statistical significance of p <0.05 was accepted. Results: The smokers assessed that the images need reforms, indicating that the advertisement partially fulfills its objective as health education material. The 21 images are assessed as unattractive, accepted, and understood and they do not persuade people to stop smoking. There is a statistical association between the criterion of acceptance of the images and the gender of the participants in the study (p=0.05), as well as the criterion of induction to action of the images and the education level of the population intervened (p=0.03). Conclusion: Reforms to the educational material that is shown on cigarette packs are suggested; in such a way that they respond to the guidelines defined at an international level as well as achieving the objective of becoming an effective method in order to spread public health messages in terms of risk perception and real behavioral changes towards cigarette consumption.
Introduction
Cigarette smoking is one of the main public health issues in the world [1] since it affects not only people’s health, but it has significant economic and social costs [2]. Various cost- effective measures for the tobacco consumption control have been proposed, highlighting the prohibitions of direct and indirect tobacco advertising, increases in taxes and prices of tobacco products, creation of smoke-free spaces in public places and clear health messages on tobacco packages [3, 4]. The World Health Organization-WHO, within the Framework Convention on Tobacco Control-FCTC, establishes a series of guidelines for the implementation of advertisements in which “each unit packet and package of tobacco products and any outside packaging and labeling of such products also carry health warnings describing the harmful effects of tobacco use, and may include other appropriate messages”. These printed health warnings are an effective strategy to induce behavioral changes in smoking habits, so the population can receive significant information about the risks that this practice represents for people’s health, reducing the attractiveness of the package as well as the product, thus generating a benefit in terms of life expectancy, well-being, and the reduction in morbidity and mortality associated with smoking [5, 6].
Despite these guidelines, several member countries of the convention do not meet these minimum requirements [7]. In Colombia, article 11 of WHO-FCTC was implemented through the bill: Ley 1335 del 2009 and from that date until today, a series of images have been shown on cigarette packs, as a way to display the risks of cigarette smoking; nonetheless, there is little scientific evidence that this type of educational health material had been tested (pre-test) before its final elaboration and that its educational impact had also been measured through an evaluation or validation process, as it is defined normatively. The aim of this research was to evaluate the quality and effectiveness of the visual health education material used on the packages of cigarettes for the anti-smoking campaigns with a sample of people from the town of Paipa-Boyacá (Colombia).
Materials and Methods
An evaluative study, with a quantitative, descriptive, cross-sectional approach was developed; 21 images or pictograms displayed on the cigarette packages were evaluated, as part of the anti-smoking policy implemented in Colombia between the years 2009 and 2014. For the calculation of the sample, the Epidat® software was used, with a confidence level of 5% and reliability of 95%. The sample was calculated from the prevalence of cigarette consumption in the Department of Boyacá with a 12.9%, as reported on the national psychoactive substances study in Colombia, 2013 [8], yielding a sample of 171 people. The sampling of the target population was performed with a non- probabilistic method, and it was done with those who agreed to participate in the study through the informed consent as well as fulfilling all the requirements: residing in the town of Paipa, being in the life cycle of youth and adulthood (18-59 years) and they had to have smoked in the last month any number of cigarettes on a daily basis [9].
As evaluation tools, those suggested by the Pan American Health Organization – PAHO were used, in order to assess the health educational visual/printed material [10, 11], with some modifications and adaptations previously validated (Cronbach alpha 0,90). A 13-item questionnaire, with a scale value of 1 to 5 points, which evaluates 5 criteria: attraction, understanding, identification, acceptance, and induction to action were implemented. According to the sum of the scores, the decision in terms of value was determined as follows: Use as it is (50-65 points), Needs reforms (31-49 points) and Rejected (less than 30 points).
The instrument was completed by the target population, upon the completion of the informed consent by the participants and the approval from the Bioethics Committee of Universidad Autónoma de Manizales. For the data analysis, Kolmogorov-Smirnov tests for normality were implemented for each sample of the analyzed variables; the variables were evaluated descriptively and analytically according to the relationship of each of them; arithmetic means for continuous and discontinuous variables, proportions for categorical or nominal variables, with their respective confidence intervals (CI). During the analytical phase, in order to determine the statistical significance of the association of sociodemographic variables as well as the evaluation of the educational material criteria, the Pearson’s Chi-Square parametric test was used and a statistical significance of p <0.05 was accepted.
Results
Sociodemographic Aspects of the Sample
The average age of the target population was 34.4 years (SD ± 10.3) with a clear predominance of older adults between 30 and 60 years (72.5%). The majority of the target population was men (62.2%). Among the education levels, there are very few people who have a postgraduate degree and consume cigarettes (9.9%); there is a prevalence of population with basic education levels. Based on the socioeconomic stratum our participants belonged to the lower and middle class, in which, the consumption was higher in the lower strata (56.1%).
Evaluation of the Educational Material
Levels of attraction, understanding, identification/ acceptance, and induction to the action of educational material: According to the analysis of the instrument used, the 21 images assessed showed minimum scores of 13 and maximum scores of 65 according to the assessment scale, with a general average of 35 points (± SD 10.3) for all the images. It is highlighted that, from the 21 images, 12 of them obtained the highest score, while 6 showed the lowest score possible according to the assessment scale. Regarding the average score for each image, it was observed that image 4 has the lowest score (28 points) and number 10 and 11 have the highest score (38 points) (Tables 1 & 2). From the obtained scores for each image and according to the decision ranges of the instrument, it can be stated that 20 images located on the cigarette packages need reforms and 1 is rejected (Figure 1).
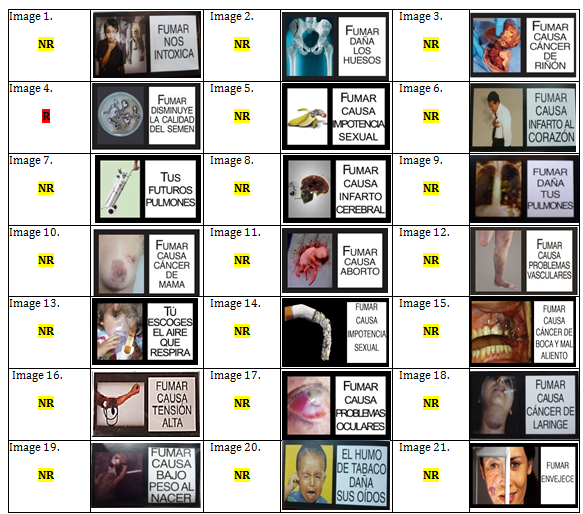
Source: research database. R: Rejected (Minus 30 points); NR: Needs reform (31-49 points); UCE: Use as is (Greater than 50 points). Figure 1: Coding of the decision for each image based on the scores obtained.
| n | % | DE± | IC (95%) | |
|---|---|---|---|---|
| Gender | ||||
| Male | 103 | 62.2 | (52 - 67) | |
| Female | 68 | 39.8 | (32 - 47) | |
| Stratus socioeconomic | ||||
| 1 | 11 | 6.4 | ( 2 - 10) | |
| 2 | 85 | 49.7 | ( 42 - 57) | |
| 3 | 72 | 42.1 | (34 - 49) | |
| 4 | 3 | 1.8 | ( 0 - 0) | |
| Stratus socioeconomic | ||||
| Low | 96 | 56.1 | ( 48 - 63) | |
| Medium | 75 | 43.9 | ( 36 - 51) | |
| Scholarship | ||||
| Primary | 22 | 12.9 | ( 7 - 18) | |
| high school | 44 | 25.7 | ( 19 - 32) | |
| Technology | 41 | 24 | ( 17 - 30) | |
| University | 47 | 27.5 | ( 21 - 34) | |
| Postgraduate | 17 | 9.9 | ( 5 - 14) | |
| Education | ||||
| Medium low | 107 | 62.6 | ( 55 - 70) | |
| High | 64 | 37.4 | ( 26 - 41) | |
| Age | ||||
| Young Adult (18 to 26 years old) | 47 | 27.5 | ( 21 - 34) | |
| Mature adult (27-60 years old) | 124 | 72.5 | ( 66 - 79) | |
| n | x | DE± | IC (95%) | |
| Age | 171 | 34.4 | ± 10.3 | (33 - 36) |
Table 1: Sociodemographic characteristics of the Population.
Source: research database Table 1: Sociodemographic characteristics of the Population.
| Minimum | Maximum | Mean | Standard deviation | |
|---|---|---|---|---|
| Image 1 | 18 | 63 | 35 | 10,8 |
| Image2 | 18 | 62 | 35 | 9,9 |
| Image 3 | 13 | 64 | 36 | 10,5 |
| Image 4 | 28 | 28 | 28 | ,000 |
| Image 5 | 17 | 63 | 36 | 10,2 |
| Image 6 | 17 | 65 | 36 | 10,8 |
| Image 7 | 13 | 65 | 36 | 10,9 |
| Image 8 | 15 | 62 | 35 | 10,7 |
| Image 9 | 13 | 65 | 36 | 11,0 |
| Image 10 | 13 | 65 | 38 | 12,1 |
| Image 11 | 17 | 65 | 38 | 11,8 |
| Image 12 | 17 | 65 | 37 | 11,2 |
| Image 13 | 17 | 62 | 35 | 9,9 |
| Image 14 | 16 | 65 | 35 | 10,2 |
| Image 15 | 15 | 65 | 35 | 11,0 |
| Image 16 | 17 | 60 | 35 | 10,0 |
| Image 17 | 15 | 64 | 36 | 11,1 |
| Image 18 | 16 | 65 | 35 | 11,3 |
| Image 19 | 13 | 65 | 36 | 10,7 |
| Image 20 | 13 | 65 | 34 | 10,9 |
| Image 21 | 15 | 65 | 34 | 12,7 |
Table 2: Means scores for each image.
Source: research database Table 2: Means scores for each image.
Regarding the evaluation frequencies of the sample in each one of the decision ranges for the 21 images, it is observed that according to the coherence of the average scores obtained for each of them, and the highest percentages are given under two categories: Needs to be reformed and rejected. The decision that the image needs reforms has frequencies in ranges between 52% to 64%, reaching the highest percentage as for this decision, images 7, 2 and 19;
for the decision of rejection the frequencies of opinion of the sample ranged from 31% to 100%, finding that the images with the highest percentage for this decision are 4, 21 and 1. It is possible to show that the evaluation of frequencies for the images used the way they are now are low (0% to 8.2%); Image 4 reports the lowest frequency of use (0%) and image 10 reaches the highest frequency in this decision (8.2%) (Table 3).
| IMAGE | Use as is | Needs Reforms | Rejected | ||||||
|---|---|---|---|---|---|---|---|---|---|
| n | % | IC95% | n | % | IC95% | n | % | IC95% | |
| Image 1 | 6 | 3,5 | (0,7 – 6,2) | 95 | 55,6 | (47 – 62) | 70 | 40,9 | (33 – 48) |
| Image 2 | 4 | 2,3 | (0,05 – 4,5) | 108 | 63,2 | (55 – 70) | 59 | 34,5 | (26 – 41) |
| Image 3 | 8 | 4,7 | (1,5 – 7,8) | 103 | 60,2 | (52 – 67) | 60 | 35,1 | (27 – 42) |
| Image 4 | 0 | 0,0 | (0 – 0) | 0 | 0,0 | (0 – 0) | 100 | 100 | (-) |
| Image 5 | 6 | 3,5 | (0,7 – 6,2) | 109 | 63,7 | (55 – 70) | 56 | 32,7 | (25 – 40) |
| Image 6 | 5 | 2,9 | (0,3 – 5,4) | 100 | 58,5 | (50 – 65) | 66 | 38,6 | (31 – 46) |
| Image 7 | 7 | 4,1 | (1,1 – 7,0) | 110 | 64,3 | (56 – 71) | 54 | 31,6 | (25 – 38) |
| Image 8 | 6 | 3,5 | (0,7 – 6,2) | 104 | 60,8 | (52 – 67) | 61 | 35,7 | (27 – 42) |
| Image 9 | 6 | 3,5 | (0,7 – 6,2) | 105 | 61,4 | (53 – 68) | 60 | 35,1 | (27 – 42) |
| Image 10 | 14 | 8,2 | (4,0 – 12,3) | 99 | 57,9 | (50 – 65) | 58 | 33,9 | (25 – 40) |
| Image 11 | 12 | 7,0 | (3,1 –10,8) | 104 | 60,8 | (52 – 67) | 55 | 32,2 | (25 – 38) |
| Image 12 | 9 | 5,3 | (1,9 – 8,6) | 107 | 62,6 | (54 – 69) | 55 | 32,2 | (25 – 38) |
| Image 13 | 4 | 2,3 | (0,05 – 4,5) | 99 | 57,9 | (50 – 65) | 68 | 39,8 | (32 – 47) |
| Image 14 | 2 | 1,2 | (-0,04 – 2,8) | 101 | 59,1 | (51 – 66) | 68 | 39,8 | (32 – 47) |
| Image 15 | 3 | 1,8 | (-0,01 – 3,7) | 107 | 62,6 | (54 – 69) | 61 | 35,7 | (27 – 42) |
| Image 16 | 1 | 0,6 | (-0,05 – 1,7) | 107 | 62,6 | (54 – 69) | 63 | 36,8 | (32 – 47) |
| Image 17 | 7 | 4,1 | (1,1 – 7,0) | 105 | 61,4 | (53 – 68) | 59 | 34,5 | (26 – 41) |
| Image 18 | 9 | 5,3 | (1,9 – 8,6) | 95 | 55,6 | (47 – 62) | 67 | 39,2 | (32 – 47) |
| Image 19 | 4 | 2,3 | (0,05 – 4,5) | 109 | 63,7 | (55 – 70) | 58 | 33,9 | (25 – 40) |
| Image 20 | 4 | 2,3 | (0,05 – 4,5) | 101 | 59,1 | (51 – 66) | 66 | 38,6 | (31 – 46) |
| Image 21 | 6 | 3,5 | (0,7 – 6,2) | 89 | 52,0 | (44 – 59) | 76 | 44,4 | (36 – 51) |
Table 3: Frequency of evaluation of the images according to the decision versus scores for each image. Source: research database.
According to the evaluation criteria the instrument takes into account: attraction, acceptance, understanding/ identification and induction to action; the highest opinion frequencies of the surveyed population are centered on the opinion that the 21 images are not attractive, are not accepted, are not understandable and do not induce to stop smoking (Table 4). The averages of evaluation frequencies for the 21 images, in the four criteria, are attraction 22.6%, no attraction 77.3%; acceptability 21.3% and non-acceptability 78.6%; understanding 19.8% and non-understanding 80.1%; induction to stop smoking 21.8% and non-induction to quit smoking 78.1% (Table 4).
| Imagen | Attraction | Acceptance | Understanding / identification | Induction to action | ||||||||||||
|---|---|---|---|---|---|---|---|---|---|---|---|---|---|---|---|---|
| Attractiveness | Not attractive | Acceptable | Not Acceptable | Understandable | Not understandable | Induces to quit smoking | Does not induce smoking cessation | |||||||||
| n | % | n | % | n | % | n | % | n | % | n | % | n | % | n | % | |
| Image 1 | 41 | 24,0 | 130 | 76,0 | 36 | 21,1 | 135 | 78,9 | 39 | 22,8 | 132 | 77,2 | 42 | 24,6 | 129 | 75,4 |
| Image 2 | 42 | 24,6 | 129 | 75,4 | 27 | 15,8 | 144 | 84,2 | 37 | 21,6 | 134 | 78,4 | 27 | 15,8 | 144 | 84,2 |
| Image 3 | 40 | 23,4 | 131 | 76,6 | 30 | 17,5 | 141 | 82,5 | 33 | 19,3 | 138 | 80,7 | 41 | 24,0 | 130 | 76,0 |
| Image 4 | 0 | 0 | 171 | 100 | 0 | 0 | 171 | 100 | 0 | 0 | 171 | 100 | 0 | 0 | 171 | 100 |
| Image 5 | 42 | 24,6 | 129 | 75,4 | 35 | 20,5 | 136 | 79,5 | 36 | 21,1 | 135 | 78,9 | 35 | 20,5 | 136 | 79,5 |
| Image 6 | 41 | 24,0 | 130 | 76,0 | 40 | 23,4 | 131 | 76,6 | 31 | 18,1 | 140 | 81,9 | 43 | 25,1 | 128 | 74,9 |
| Image 7 | 45 | 26,3 | 126 | 73,7 | 36 | 21,1 | 135 | 78,9 | 35 | 20,5 | 136 | 79,5 | 45 | 26,3 | 126 | 73,7 |
| Image 8 | 40 | 23,4 | 131 | 76,6 | 42 | 24,6 | 129 | 75,4 | 33 | 19,3 | 138 | 80,7 | 37 | 21,6 | 134 | 78,4 |
| Image 9 | 44 | 25,7 | 127 | 74,3 | 36 | 21,1 | 135 | 78,9 | 32 | 18,7 | 139 | 81,3 | 40 | 23,4 | 131 | 76,6 |
| Image 10 | 60 | 35,1 | 111 | 64,9 | 50 | 29,2 | 121 | 70,8 | 49 | 28,7 | 122 | 71,3 | 55 | 32,2 | 116 | 67,8 |
| Image 11 | 49 | 28,7 | 122 | 71,3 | 48 | 28,1 | 123 | 71,9 | 48 | 28,1 | 123 | 71,9 | 53 | 31,0 | 118 | 69,0 |
| Image 12 | 40 | 23,4 | 131 | 76,6 | 42 | 24,6 | 129 | 75,4 | 38 | 22,2 | 133 | 77,8 | 50 | 29,2 | 121 | 70,8 |
| Image 13 | 33 | 19,3 | 138 | 80,7 | 37 | 21,6 | 134 | 78,4 | 35 | 20,5 | 136 | 79,5 | 31 | 18,1 | 140 | 81,9 |
| Image 14 | 31 | 18,1 | 140 | 81,9 | 37 | 21,6 | 134 | 78,4 | 29 | 17,0 | 142 | 83,0 | 38 | 22,2 | 133 | 77,8 |
| Image 15 | 36 | 21,1 | 135 | 78,9 | 42 | 24,6 | 129 | 75,4 | 36 | 21,1 | 135 | 78,9 | 43 | 25,1 | 128 | 74,9 |
| Image 16 | 39 | 22,8 | 132 | 77,2 | 33 | 19,3 | 138 | 80,7 | 33 | 19,3 | 138 | 80,7 | 35 | 20,5 | 136 | 79,5 |
| Image 17 | 40 | 23,4 | 131 | 76,6 | 41 | 24,0 | 130 | 76,0 | 34 | 19,9 | 137 | 80,1 | 39 | 22,8 | 132 | 77,2 |
| Image 18 | 36 | 21,1 | 135 | 78,9 | 37 | 21,6 | 134 | 78,4 | 35 | 20,5 | 136 | 79,5 | 34 | 19,9 | 137 | 80,1 |
| Image 19 | 40 | 23,4 | 131 | 76,6 | 42 | 24,6 | 129 | 75,4 | 36 | 21,1 | 135 | 78,9 | 37 | 21,6 | 134 | 78,4 |
| Image 20 | 34 | 19,9 | 137 | 80,1 | 34 | 19,9 | 137 | 80,1 | 29 | 17,0 | 142 | 83,0 | 26 | 15,2 | 145 | 84,8 |
| Image 21 | 39 | 22,8 | 132 | 77,2 | 42 | 24,6 | 129 | 75,4 | 34 | 19,9 | 137 | 80,1 | 35 | 20,5 | 136 | 79,5 |
Table 4: Association of evaluation variables of educational material and sociodemographic aspects.
The image that reports the highest percentage of attraction is 10 (35.1%) and the image that reports the highest percentage of non-attraction is 4 (100%). The image with the highest percentage of acceptance is 10 (29.2%) and 2 reporting non-acceptance (84.2%). In terms of understanding/identification, images 10 and 11 are the most understandable (28%) and the least understandable images are 14 and 20 (83%). Regarding the induction to stop smoking, image 10 reported the highest percentage (32.2%) and images 2 and 20 have the highest percentage for non- induction to stop smoking (84.2%) (Table 4).
Association of Sociodemographic Variables and Receptivity of Educational Material
Data obtained in the association of sociodemographic variables with the levels of evaluation in the four criteria defined by the instrument, showed statistical significance between the criterion of acceptance of the images and gender of the participants in the study (p=0.05); likewise, association between the criterion induction to action and the educational level of the sample (p=0.03) was observed, as shown in Table 5.
| Attraction | Acceptance | Understanding / identification | Induction to action | |||||||||||||||||
|---|---|---|---|---|---|---|---|---|---|---|---|---|---|---|---|---|---|---|---|---|
| Attractive ness | Not attractive | Accept able | Not Accept able | Understa ndable | Not unders tandable | Induces to quit smoking | Does not induce smoking cessation | |||||||||||||
| n | % | n | % | P* | n | % | n | % | P* | n | % | n | % | P* | n | % | n | % | P* | |
| Gender | ||||||||||||||||||||
| Male | 32 | 31.1 | 71 | 68.9 | 0.59 | 23 | 22.3 | 80 | 77.7 | 0.05 | 32 | 31.1 | 71 | 68.9 | 0.59 | 21 | 20.4 | 82 | 79.6 | 0.86 |
| Female | 25 | 36.8 | 43 | 63.2 | 14 | 20.6 | 54 | 79.4 | 25 | 36.8 | 43 | 63.2 | 18 | 26.5 | 50 | 73.5 | ||||
| Age | ||||||||||||||||||||
| Young Adult (18 to 26 years old) | 25 | 53.2 | 22 | 46.8 | 11.5 | 17 | 36.2 | 30 | 63.8 | 8 | 24 | 51.1 | 23 | 48.9 | 9.1 | 16 | 34 | 31 | 66 | 4.6 |
| Mature adult (27-60 years old) | 32 | 25.8 | 92 | 74.2 | 20 | 16.1 | 104 | 83.9 | 33 | 26.6 | 91 | 73.4 | 23 | 18.5 | 101 | 81.5 | ||||
| Stratus socioeconomic | ||||||||||||||||||||
| Low | 36 | 37.5 | 60 | 62.5 | 1.7 | 25 | 26 | 71 | 74 | 2.5 | 38 | 36.6 | 58 | 60.4 | 3.8 | 27 | 28.1 | 69 | 71.9 | 3.5 |
| Medium | 21 | 28 | 54 | 72 | 12 | 16 | 63 | 84 | 19 | 25.3 | 56 | 74.7 | 12 | 16 | 63 | 84 | ||||
| Education | ||||||||||||||||||||
| Medium low | 32 | 29.9 | 25 | 39.1 | 1.5 | 19 | 17.8 | 88 | 82.2 | 2.5 | 33 | 30.8 | 74 | 69.2 | 0.7 | 26 | 24.3 | 81 | 75.7 | 0.03 |
| High | 75 | 70.1 | 39 | 60.9 | 18 | 28.1 | 46 | 71.9 | 24 | 37.5 | 40 | 62.5 | 13 | 20.3 | 51 | 79.7 |
Table 5: Association of evaluation variables of educational material and sociodemographic aspects.
Discussion
Smoking represents the second leading cause of death worldwide, which accounts for almost five million deaths per year and it is projected to account for nearly ten million deaths by 2020 [12]. Additionally, this substance generates economic and social costs in the countries where there are high consumption rates [13].
The images printed on cigarette packs are intended to transmit information, seeking to raise awareness and generate behavioral changes against smoking. However, this material requires a normative evaluation and validation which assess the quality and effectiveness of the latter under standardized instruments.
The age of the surveyed population revealed similar figures to those reported in a systematic review, where 71% of the analyzed studies included young adults and adults [14]. Other research shows similarities in the sample (adults) [15-
19]. However, the average age for these studies exceeds those found in this study (40, 35 and 39 years respectively). The analyzed age group differs significantly from the qualitative study with a phenomenological approach carried out by Sánchez JP, et al. [18], where young people between 16 and 23 years old analyzed the same images used in this study by means of an interview. Based on the sociodemographic variables of the studied population, it can be concluded that people who consume more cigarettes are male, data similar to that reported by other authors [14, 15, 16, 17]. Regarding education level, differences with Mexican studies were found, in which there are greater percentages for higher education levels [15, 16, 17]. As reported in other studies, it was found that most of the participants were from low socioeconomic strata [16, 17].
The general average score of the images printed on the cigarette packs was 35.2 (± SD 11), with a low prevalence to continue with the images as they are (0% to 8.2%), indicating that all of them must be reformed; The majority of the sample commented that these figures are not attractive (77.3%), are not accepted (78.6%), are not understandable (80.1%) and they do not induce to stop smoking (78.1%). When contrasting the data with the study of Hammond D, et al. [20], it revealed a certain similarity since it reported that only 19% of smokers stated that graphic warnings on cigarette packs had made them smoke less. Similarly, Sánchez [18, reports that the images printed on cigarette packs are not important, particularly for the young smoker. Additionally, it was observed that images 4 and 21 have the lowest rating because those pictures are the most rejected. Pictures 2, 5 and 19 have a greater need to be reformed, while figure 12 has the highest score (37 points).
The aforementioned data for the analyzed images along the study reinforce the conclusions presented in a study by Goodall C, et al. [21], who showed that the shocking warning labels seem to have a positive influence on the attitudes and behaviors related to the smoking habits of adolescents. It is considered that shocking images have a larger impact and greater probabilities of generating behavioral changes in the smoker [22] but their effectiveness may decrease behavioral changes related to quitting consumption when people avoid contact with the images, it may even increase consumption [20, 23]. Conversely, it is important to mention that the results obtained in this study visualize partially and perhaps, linked to an influence of the cultural environment, what has been exposed by Brazilian, Canadian and Irish studies, where it is shown that the sharpest images were those which showed injuries or physical suffering in a more graphic way [19, 24] and produced unpleasant emotions, ensuring a greater impact on the behavior of smokers [25]; the images with more votes were those that showed more graphically the negative effects on health [26]. Graphic warnings that arouse fear or other emotions are the most effective and even more if they are associated with information about how to help smokers stop smoking and create the necessary conditions for them to quit smoking [27].
When assessing the association, data coinciding with that reported by Fong GT [28] was found, they concluded in their study that once the graphic warnings were implemented, low- income smokers who did not read the text warnings in detail got perceptually closer to high-income smokers who read them in detail and significantly increased the probability that low-income smokers may quit smoking. These data confirm the perception raised by Ortiz JC [29] when he states that educational campaigns on cigarettes designed in Colombia differ greatly with those used in other countries and that poorly produced images do not generate an impact on the smoker. On the contrary, they induce mockery, they have little credibility and do not induce to stop smoking; hence, it is considered that images should reinforce positive messages that are more remarkable in terms of reducing consumption and provide better information to the general public [18, 30].
The research experiences in the international context report that graphic warnings on cigarette packages with images and text reported reliable results regarding the repercussions of this type of warnings [6], a fact that is confirmed by the Datafolha Research Institute, the American Commission for health promotion and the international project for smoking control. They certify the influence of these messages on smokers in the sense that they change their opinion about the consequences and effects of smoking on health and think at the moment of the intention to quit or reduce cigarette smoking [31, 32, 33, 34]; However, those studies contradict in some way what was stated by Chang FC, et al. [35] who demonstrated that in China the implementation of a smoke-free law, in combination with the graphic warning labels on cigarettes, has been effective in raising thoughts about of the health dangers of smoking and quitting smoking [35].
Different researches have suggested that support through telephone numbers in the packs of cigarettes makes the printed warnings in them much more effective [36, 37]. It reinforces the need for reforms in these images, as proposed in this study. Similar to the data found in the studies of Thrasher, Murray, Strahan, Health Warnings and Health Canada, where it was established that the size of the graphic warnings is relevant; as long as they are larger and have more space in the pack, it will reduce the attractiveness of the package, as a result, it could increase the risk that represents smoking and make them more reliable [38, 39, 40, 41, 42]. Related to what has been stated in this study, the reports made by Sussenbach P, et al. [43] state that aversive images attract attention, however, they do not promote health knowledge, for this reason, changes in the images that were evaluated in the study are required.
The information offered in this study compared with the results of Kees J, et al. [44] indicates that the pictorial graphic representations of warning support the intentions of smokers to quit smoking. Even though highly graphic images may limit the direct effect on the intentions of quitting, they may increase the intentions to quit smoking through evoked fear. It is important to mention that although the advantages of this study lies in being one of the few works that evaluate this educational material, the methodology used differs in its approach with other research conducted especially in Canada and Europe; nevertheless, with the results achieved, inferences can be made in general terms about the conclusion, since the educational images in the cigarette packs used in Colombia need adjustments, in such a way that it becomes a simple, effective and persuasive strategy in the mitigation of cigarette consumption, with the consequent reduction of costs for the country’s health system [45, 46, 47], and take advantage in a more efficient way as it was stated by Gantiva C, et al. [48] when they affirm that these images activate the appetitive motivational system and generate a significant level of activation, so they can be used to evaluate the emotional response in tobacco users.
In the advertising field, educational strategies must be carried out, extending the message through different media in order to face this public health problem. Regarding the images exhibited in cigarette packs, they work in a certain way but they should be more informative since they take the initiative to quit smoking but without results. In addition, campaigns should be generated towards younger audiences from different socio-cultural sectors, raising awareness about health-related issues caused by cigarette consumption, bearing in mind the objective of raising awareness about its harmful effects and ending the perceptions that have been generated through the times about cigarettes.
Finally, it is necessary to recognize that the limitations of the study are related to the type of sampling performed; despite the fact that the instrument is user-friendly, many images had to be evaluated, which entailed the use of considerable time, which could lead to non-objective answers from the participating population and thus having assessments with elements of subjectivity. The project developed, provides an important baseline, which visualizes the need to make reforms to the educational material that is exposed in cigarette packs, likewise, it is necessary to monitor and evaluate the impact of this educational material, in order to correct or reinforce its effectiveness in the smoking population.
References
-
Rivera DE, Niño A (2009) ABC de la Ley Antitabaco (Ley 1335 de 2009). Boletín Hechos y Acciones 2(2): 1-8.
-
WHO (2013) WHO report on the global tobacco epidemic. World Health Organization.
-
WHO (2003) World Health Organization. Framework convention on tobacco control.
-
WHO (2008) WHO report on the global tobacco epidemic.
-
Sebrié EM (2012) Labeling policies on cigarette packages: current situation in Latin America and the Caribbean. Public Health Mex 54(3): 293-302.
-
Aparicio L (2010) Are the images on tobacco packs effective? Madrid: Medicablogs.
-
(2017) Guidelines for implementation of Article 11 of the WHO Framework Convention on Tobacco Control (Packaging and labelling of tobacco products). WHO.
-
(2014) Ministry of Justice and Law of Colombia, Observatory of Drugs of Colombia and Ministry of Health and Social Protection, United Nations Office on Drugs and Crime-UNODC-Inter-American Drug Abuse Control Commission-CICAD-25 OAS- , Embassy of the United States in Colombia-INL. National Study of Psychoactive Substances in Colombia 2013. Final Report. Bogotá: The Ministry.
-
(1996) ICD 10: Chapter V. Diagnostic and action guidelines for mental disorders in primary care. In: ICD 10 mental and behavioral disorders: diagnostic and action guidelines in primary care. World Health Organization.
-
(1984) Pan American Health Organization. Guide for the design, use and evaluation of health educational materials. PALTEX series for middle and auxiliary technicians No. 10. Washington: OPS.
-
Ziemendorff S, Krause A (2003) Educational materials validation guide (with focus on health education materials). Chiclayo: GTZ-OPS / CEPIS.
-
World Health Organization (2013) Tobacco Free Initiative. Why is tobacco a public health priority? Ginebra: OMS.
-
Gutiérrez FJ (2013) Smoking as a public health problem. In: Smoking Prevention and Diagnosis Manual.
-
Francis DB, Hall MG, Noar SM, Ribisl KM, Brewer NT (2017) Systematic review of measures used in pictorial cigarette pack warning experiments. Nicotine Tob Res 19(10): 1127-1137.
-
Thrasher JF, Allen B, Reynales LM, Anaya R, Lazcano E, et al. (2006) Analysis of the impact on Mexican smokers of graphic advertisements on cigarette packs. Public Health Mex 48(1): 65-74.
-
Thrasher JF, Pérez R, Arillo E, Barrientos I (2012) Towards the reported consumption of tobacco in Mexico: effect of the warnings with pictograms in the smoking population. Public Health Mex 54(3): 242-253.
-
Thrasher JF, Pérez R, Arillo E, Barrientos I (2012) Impact of cigarette package health warnings with pictures in Mexico: results from a survey of smokers in Guadalajara. Public Health Mex 54(3): 254-263.
-
Sánchez JP, Velarde LF (2012) Analysis of the effect of warning images to smokers, on cigarette packs, on smoking in young people from Cali. Santiago de Cali: Autonomous University of the West.
-
Thrasher JF, Villalobos V, Szklo A, Fong GT, Pérez C, et al. (2010) Impact of health warnings on cigarette packaging: a comparative analysis in Brazil, Uruguay and Mexico. Public Health Mex 52(2): 206-215.
-
Hammond D, Fong GT, McDonald PW, Brown S, Cameron R (2004) Graphic Canadian warning labels and adverse outcomes: evidence from Canadian smokers. Am J Public Health 94(8): 1442-1445.
-
Goodall C, Appiah O (2008) Adolescents’ perceptions of Canadian cigarette package warning labels: investigating the effects of message framing. Health Commun 23(2): 117-127.
-
Liefeld JP (1999) The relative importance of the size, content and pictures on cigarette package warnings messages. Ottawa: Department of Consumer Studies, University of Guelph.
-
Borland R, Yong HH, Wilson N, Fong GT, Hammond D, et al. (2009) How reactions to cigarette packet health warnings influence quitting: findings from the ITC Four Country Survey. Addiction 104(4): 669-675.
-
Nascimento BEM, Oliveira L, Vieira AS, Joffily M, Gleiser S, et al. (2008) Avoidance of smoking: the impact of warning labels in Brazil. Tob Control 17(6): 405-409.
-
Cavalcante TM, Perez C, Vianna C, Nascimento BEM (2008) Brazil: health warnings on tobacco products-2009. Rio de Janeiro: National Cancer Institute.
-
United Kingdom Department of Health (2017) Consultation on the introduction of picture warnings on tobacco packs.
-
Hammond D (2009) Tobacco Labeling Resource Center. Tobacco Labelling Toolkit: evidence review. En: Tobacco Labelling & Packaging Toolkit. Paris: International Union against Tuberculosis and Lung Disease.
-
Fong GT (2009) Evaluating FCTC policies and whether they are closing the equity gap: findings from the ITC Project. 14th World Conference on Tobacco or Health, Mumbai.
-
Ortiz JC (2013) Living writing. Cigarette Smoking Warnings: Effective?. EE.
-
Cely M, Alejandro D (2011) Prospective theory, framework effect, and tobacco use deterrence messages in Colombia. Vniversitas 123: 15-44.
-
(2002) Datafolha Research Institute. Public opinion: Campaign against smoking. Sao Paulo: The Institution.
-
(2001) Evaluation of new warnings on cigarette packages. Canadian Cancer Society.
-
(2001) Graphic health warnings on tobacco packaging inspire smokers to quit the habit [press release]. Health Promotion Board.
-
(2007) International Tobacco Control Policy Evaluation Project. Wave 2 Data, Thailand, 2007. Bangkok: International Tobacco Control Policy Evaluation Project.
-
Chang FC, Chung CH, Yu PT, Chao KY (2011) The impact of graphic cigarette warning labels and smoke-free law on health awareness and thoughts of quitting in Taiwan. Health Educ Res 26(2): 179-191.
-
Cavalcante TM (2013) Labelling and packaging in Brazil. Geneva: World Health Organization.
-
Li J, Grigg M (2009) New Zealand: new graphic warnings encourage registrations with the quitline. Tob Control 18(1): 72.
-
Thrasher JF, Rousu MC, Anaya R, Reynales LM, Arillo E, et al. (2007) Estimating the impact of different cigarette package warning label policies: the auction method. Addict Behav 32(12): 2916-2925.
-
Murray R (2004) Warnings on cigarettes ‘destroying brand value’. Daily Telegraph.
-
(1990) Health warnings on cigarette and tobacco packs: report on research to inform European standardization. London: Health Education Authority.
-
Strahan EJ, White K, Fong GT, Fabrigar LR, Zanna MP, et al. (2002) Enhancing the effectiveness of tobacco package warning labels: a social psychological perspective. Tob Control 11(3): 183-190.
-
(1999) Créatec+Market Studies. Effects of increasing the area occupied by health warnings on cigarette packages. Ottawa: Health Canada.
-
Sussenbach P, Niemeier S, Glock S (2013) Effects of and attention to graphic warning labels on cigarette packages. Psychol Health 28(10): 1192-1206.
-
Kees J, Burton S, Andrews JC, Kozup J (2010) Understanding how graphic pictorial warnings work on cigarette packaging. J Public Policy Mark 29(2): 265-276.
-
(2003) Cost-benefit analysis of proposed new health warnings on tobacco products. Australia: Commonwealth Department of Health and Ageing.
-
(2000) Tobacco Products Information Regulations. Regulatory impact analysis statement. Canada Gazette.
-
(2007) The introduction of picture warnings on tobacco packs. Final regulatory impact assessment. Londres: United Kingdom Department of Health.
-
Gantiva C, Rodríguez M, Arias M, Rubio E, Cuerra P, et al. (2012) Design and validation of a set of affective images related to tobacco consumption in the Colombian population. Thought Psicol 10(2): 113-122.
- Epidemiological Surveillance and Rumors on Social Media
- Awareness and Treatment of Uncontrolled Hypertension in US Overweight/Obese Youths Aged 16–24 Years, NHANES 2021–2023
- Strengthening EPI Through Parental Engagement: Lessons from Dhaka Slums for IA-2030
- Mothers Knowledge of the Prevalence, Causes, Effects, Prevention and Control of Diarrhoea among Children in Ife East Local Government Area, Ile Ife, Osun State, Nigeria
- Covid-19 Reinfections Case Series from October 2023 to October 2024 in A General Medicine Office in Toledo (Spain)
- Water Contact! One Risk Too Many: Risk Factors Associated with Schistosoma haematobium infection in Osun State, Nigeria