The Age-Structured Analytical Model for Calculating the Spread of the COVID-19 Epidemic
The article presents a detailed description of the methodology for calculating the epidemic spread of coronavirus based on the ASILV model, stratified by age groups. The calculations do not require the development of special computer programs and can be easily performed using the standard EXCEL platform. Comparison of the results of prevalence calculations as well as the values of seven- day incidence values calculated using the proposed methodology with the corresponding observation data shows good correspondence between them for individual age groups. The greatest influence on the overall spread of the epidemic is in the 15-44 age groups. The relatively low level of vaccination and high social activity in these age groups causes the epidemic to spread more steeply than in other age groups. The intensity of the epidemic in the 85+ age group has some specific features in comparison with other groups, which may be explained by differences in contact patterns among individuals in this age group. The proposed methodology for calculating 'breakthrough' infections among vaccinated persons can be used as an estimate. As data on breakthrough infection statistics accumulate, the methodology should be refined. Approximate ratios for estimating the number of hospital admissions and deaths as a function of the intensity of infection are provided. The proposed ASILV model, stratified by age group, allows detailed and reasonably accurate prediction of the spread of the COVID19 epidemic, including the emergence of new, more transmissible virus variants.
Introduction
This paper continues the series of publications [1, 2, 3, 4, 5, 6, 7, 8, 9] on the development, validation and improvement of a simple analytical model of ASILV, which can be used to calculate the epidemic spread of COVID-19 and analyse the main causal relationships determining the intensity of transmission. This name underlines the main features of the model, namely: A is an analytical model that can be used to obtain an analytical solution to the system of equations, S is the part of the population that is not yet infected but is capable of being infected through contact with diseased individuals, I is the part of the population that has already been infected at time t, L is the part of the population that is protected from infection by lockdown measures at the time in question, but potentially could also be infected in future if the lockdown conditions change, V is the part of the population that is protected from infection by vaccination, the effectiveness of which is equal to α.
As information related to the spread of the COVID epidemic accumulated, it was found that the effect of transmission and the consequences of the disease depended to a large extent on the age of the infected. This fact led to the need to transform the original model in the direction of dividing the population into separate age groups. Such an age-stratified analytical model, as described in Mairanowski F, et al. [9], showed that the results of the calculations obtained with it were in reasonably good agreement with statistical data. At the same time, this work was carried out in Berlin at a time when the new, most active delta variant of the virus had not yet had a significant impact on the development of the epidemic. The virus variant was most pronounced in Great Britain and, in particular, in Scotland. Hence the need to validate the age-structured model under conditions of active delta variant spread. The spread of the epidemic in the UK was characterized by a number of features related to the spread of the new wave of the epidemic, mass vaccination of the population and reductions in the restrictive requirements for lockdown.
Mass vaccination of the population leads to a decrease in the number of fatalities associated with COVID-19, as confirmed by the results reported in Mairanowski F, et al. [8]. However, the growth of the epidemic is accompanied by an increase in hospitalisations, which can often lead to a number of long-term complications after the end of acute phase treatment. The main aim of the proposed work is to analyse the spread of the mutant virus epidemic under active mass vaccination of the population and the planned relaxation of lockdown restrictions.
**Methodology**
The methodology for calculating the spread of the epidemic using an analytical model for different age groups is described in detail in Mairanowski F, et al. [9]. Overall, the results obtained using this methodology agree quite satisfactorily with the observed data. Therefore, we do not consider it necessary at this stage to adjust the model that has already been tried and we will present it again with some important additions.
The initial equations do not differ from those previously used to calculate the spread of the epidemic in the entire population [6]. The basic formula derived from the solution of these equations to calculate the spread of the epidemic is as follows:
$$i = i_0 + \frac{100}{N} \cdot \exp \left[ \frac{k}{\lambda} \left( 1 - e^{-\lambda t} \right) \right]$$
$i$ - is the relative number of infected persons per one inhabitant of the settlement in question, as a percentage, $\lambda$ - Intensity factor of decrease in contacts of infected patients with persons, who potentially can get infected by means of quarantine and other preventive measures, $N$ - Total population of the area under consideration,
$i_0$ - is the value of $i$ at the initial moment of the calculation period,
$k$ - Is the transmission rate coefficient for the settlement with a population of $N$, which is calculated by the formula [7]:
$$k = k_0 - 0.035 \cdot \ln \left( \frac{1}{N} \cdot 10^9 \right)$$
The $K$ coefficient also depends on the transmissibility of the virus strain responsible for the spread of the epidemic during the time period in question. The influence of the transmissibility of the virus is taken into account by changing the parameter $k_0$. For the original strain, the coefficient was assumed to be 0.355. For other strains $\gamma$ times more transmissible than the original strain, the coefficient is determined using a simple formula
$$k_0 = 0.355 + \lambda \cdot \ln \gamma$$
Accepting that $\lambda = 0.034$ for average conditions, we find $k_0 = 0.37$ for the so-called $\alpha$ strain, whose transmissibility is about 60% higher than that of the original strain ($\gamma = 1.6$), and $k_0 = 0.385$ for the even more active $\delta$ variant strain. As noted in Below D, et al. [6], the development of the epidemic may be influenced by climatic factors. The dependence of the $K$ coefficient on temperature and UV value can be approximated using the parameter
$$W = \left[ 1 - 0.01(\theta - 6) \right] \cdot \left( 1 - 0.06(U - 3) \right]$$
Where $W$ is coefficient of influence of climatic parameters on intensity of epidemic development, $\theta$ is average air temperature ($C^0$), $U$ is value of UV index (for average conditions of Berlin it is assumed that $\theta = 6$ $C^0$, $U=3$). Accordingly, in addition to equation (3), we have:
$$K_w = k_0 + \lambda \ln W$$
Where $K_w$ is the coefficient in equation (2), taking into account the influence of climatic factors on it. If the spread of infection is associated with several virus strains, the calculated dependence will be written in the following form [6]:
$$i = i_0 + \frac{100}{N} \sigma \cdot \sum_1^n \exp \left[ \frac{k_i}{\lambda} \left( 1 - e^{-\lambda(t - t_0)} \right) \right]$$
Where:
$k_i$ - the transmission rate coefficient of the new virus strain and the time of the epidemic wave associated with the new coronavirus strain,
$t_i0$ - the start time of the new epidemic wave associated with the new coronavirus strain,
$\sigma$ - Heaviside symbol: $\sigma = 1 \text{ nm} \ t \geq t_i \ n \sigma = 0 \text{ at } t < t_i$
When mass vaccination is carried out, for $t \geq t_i$:
$$i_0 - i$$ is the value of $i$ at the initial moment of the calculation period,
$k$ - Is the transmission rate coefficient for the settlement with a population of $N$, which is calculated by the formula [7]:
$$k = k_0 - 0.035 \cdot \ln \left( \frac{1}{N} \cdot 10^9 \right)$$
The $K$ coefficient also depends on the transmissibility of the virus strain responsible for the spread of the epidemic during the time period in question. The influence of the transmissibility of the virus is taken into account by changing the parameter $k_0$. For the original strain, the coefficient was assumed to be 0.355. For other strains $\gamma$ times more transmissible than the original strain, the coefficient is determined using a simple formula
$$k_0 = 0.355 + \lambda \cdot \ln \gamma$$
Accepting that $\lambda = 0.034$ for average conditions, we find $k_0 = 0.37$ for the so-called $\alpha$ strain, whose transmissibility is about 60% higher than that of the original strain ($\gamma = 1.6$), and $k_0 = 0.385$ for the even more active $\delta$ variant strain. As noted in Below D, et al. [6], the development of the epidemic may be influenced by climatic factors. The dependence of the $K$ coefficient on temperature and UV value can be approximated using the parameter
$$W = \left[ 1 - 0.01(\theta - 6) \right] \cdot \left( 1 - 0.06(U - 3) \right]$$
Where $W$ is coefficient of influence of climatic parameters on intensity of epidemic development, $\theta$ is average air temperature ($C^0$), $U$ is value of UV index (for average conditions of Berlin it is assumed that $\theta = 6$ $C^0$, $U=3$). Accordingly, $$i = i_0 + \left( i_v - i_0 \right) * \exp \frac{k}{\lambda} \left[ \left( 1 - \frac{\alpha \nu}{\lambda} \right) * e^{-\lambda t} - \left( 1 - \frac{\alpha \nu}{\lambda} - \alpha \nu \left( t - t_v \right) \right) * e^{-\lambda t} \right]$$
Where
$$i = i_v \text{ at } t = t_v$$
The following additional notations have been introduced into equations and (7):
$$v - \text{population vaccination rate (1/day)}$$
$$\alpha - \text{coefficient of vaccine effectiveness,}$$
$$t_v - \text{time, when vaccination starts}$$
The same equation (7) is used to calculate epidemic progression subject to dramatic changes in vaccination rates, as has been done, for example, in many European countries. The model equations presented were originally given in Below D, et al. [7].
These equations are used under the conditions where an epidemic first occurs at time $t_1$ and then, at time $t_v$ mass vaccination of the population begins to take place. However, the opposite situation is also possible, when a new strain of the virus emerges at time $t_w$. In this case the calculations have to be carried out using the following relation:
$$i = i_{\text{old}} + \eta \frac{100}{N} * \exp \frac{k}{\lambda} \left[ \left( 1 - \frac{\alpha \nu}{\lambda} \right) - \left( 1 - \frac{\alpha \nu}{\lambda} - \alpha \nu \left( t - t_w \right) \right) * e^{-\lambda \left( t - t_w \right)} \right]$$
Where additional notations are introduced:
iold - is the relative number of infected persons at the time $t_N$ of the emergence of the new virus variant,
$\eta$ - is a coefficient taking into account the effectiveness of vaccination for the population in question prior to the onset of the new variant.
The coefficient is calculated according to the formula
$$\eta = 1 - \beta * \alpha \text{old} / \alpha \text{new}$$
Where
$$\beta = \alpha \text{old} * v * \delta$$
$\beta$ - is the fraction of the population that has been vaccinated by the time a new strain of virus emerges (of course, the value of $\beta$ cannot exceed 1).
$\alpha_{\text{old}}$ and $\alpha_{\text{new}}$ - are the effectiveness of the vaccine for the old and new strains of the virus, respectively.
$\beta$ - is the time from the start of vaccination to the appearance of the new virus strain in days.
It is assumed that the effectiveness of a vaccine against a new virus strain is lower than against an old one; therefore, even if a certain age group is fully vaccinated, additional infections of persons already vaccinated are possible due to the reduced effectiveness of the vaccine against the new virus strain. However, it must be borne in mind that the efficacy of vaccines in reducing the total number of infections must be distinguished from the efficacy of vaccines against hospitalization and lethal disease. Let us consider the methodology for calculating the vaccination efficacy rate using the example of mass replacement of the alpha variant of a virus with the delta variant. Let us first assume that by the time the new delta variant emerges, the entire population of a certain age group (e.g. 85+) is fully vaccinated, i.e. $\beta = 1$. According to the data given in Public Health England [10] for the alpha variant the effectiveness of Pfizer-BioNTech vaccine is $\alpha_{\text{old}} = 0.89$, for the delta variant anew=0.79. By formula (9) we find $\eta = 0.11$. Thus the value of breakthrough infections after full vaccination is approximately 11%. If 95% of the population is vaccinated, we find that $\eta = 0.15$, and if 90% of the population is vaccinated, the coefficient rises to 0.2. In Jamie L [11] slightly higher efficacy ratios were obtained: for the alpha variant 93.5%, for the delta 88%. At a vaccination rate of 95%, we find that $\eta = 0.11$. This value was used in our calculations.
The model coefficient $\lambda$ is related to the effectiveness of the lockdown condition. To this end, the parameter $L$, characterizing the level of reduction in the epidemic growth rate due to lockdown, is introduced [7]:
Where
$$L = i_L / i$$
$i_L$ - and i are the epidemic growth rate with and without lockdown, respectively.
For example, if application of lockdown reduces the maximum number of infected residents by half, then the coefficient $L = \frac{1}{2} = 0.5$. Using dependence (1) for time $t \rightarrow \infty$, varying the value of coefficient $\lambda$, we find the relationship between this coefficient and the parameter $L$. The graph of this dependence is shown in Figure 1.
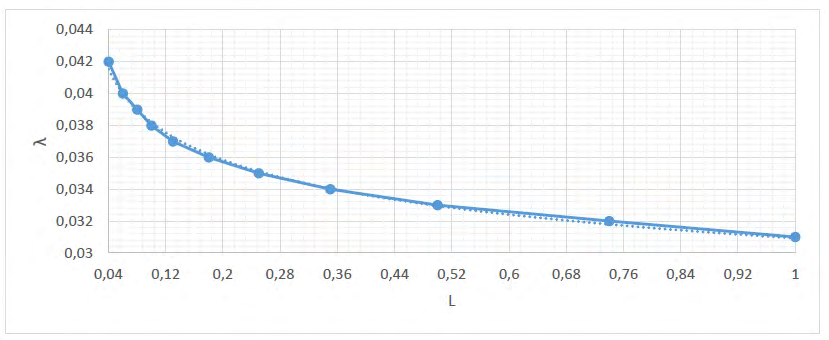
This graph shows, in particular, that in the absence of lockdown, the coefficient λ can be assumed to be 0.031 1/ day, and that when this coefficient is above 0.042 1/day, the epidemic wave is virtually suppressed by lockdown. However, this does not exclude the possibility of a new virus strain emerging when the lockdown conditions are relaxed. For the most characteristic lockdown conditions in most European countries, a coefficient of λ = 0.034-0.035 1/day can be assumed; hence, the L coefficient varies between 0.2 and 0.3, which means that lockdown reduces the epidemic’s growth rate by a factor of 3-5. The proposed calculation methodology can be used separately for each of the allocated age groups.
Results
In Mairanowski F, et al. [9], calculations of the spread of the COVID-19 epidemic for different age groups in Berlin were performed based on the model described above. However, this work was carried out before the mass emergence of a new delta variant of the virus in Berlin. This variant of the virus displaced the other strains in many European countries and became dominant. It was most active and earlier than in other European countries, penetrating into the UK. By the time the delta variant emerged in the UK, more than 50% of the UK population had been fully vaccinated. Some age groups were almost fully vaccinated. Scotland was chosen to analyse the development of the epidemic using the methodology described. This part of the United Kingdom was also chosen because sufficient information is available on both the development of the epidemic and the dynamics of vaccination for different age groups. In Public Health Scotland [12] information is given on the daily number of infected persons (averaged over 7 days) and the relative number of infections per 100000 inhabitants for each age group. These data are derived from the mass testing of the population. In addition, information is given on the daily number of deaths. Unfortunately, hospitalization data are not broken down by age group for the whole population. A total of 8 age groups have been identified, some of which we have combined. As a result, further analysis is performed for the following six age groups: 0 to 14 years, 15 to 24 years, 25 to 44 years, 45 to 64 years, 65 to 84 years and over 85 years.
Information on the daily number of positive tests for the entire Scottish population is also given in Public Health Scotland [12]. From all these data, by elementary arithmetic operations, the seven-day incidence and cumulative infection rates for the time period in question were derived. These indirectly obtained data on the total number of infections for the whole population were compared for checking with the information given in Lewis Macdonald [13] and it was found that they were almost identical (the correlation coefficient between the data was higher than 0.96). The starting date of the epidemic was August 08, 2020, i.e. the same date of the beginning of the second wave in the UK that was used in our previous work [5]. The population size of each age group was determined from the population pyramid for the year 2020 [14].
During the calculations four characteristic time periods were observed: period I lasting 77 days (from the beginning of the second wave until the appearance of the alpha variant on 23.10.2020), period II - from 77 days to 147 days (until the beginning of mass vaccination on 01. 01. 2021), period III from 147 days to 252 days (period of predominant effect of alpha variant and vaccination of population) and period IV from 252 days to the moment of present work 31.07.2021 (period of predominance of delta variant from 16.04.2021 [15]). Of course, this subdivision into characteristic time periods is somewhat arbitrary, but in general it corresponds to real events associated with the development of the epidemic. For example, the delta variant was first detected in mid-March 2021, and by April 15 there were already more than 77 cases of infection with this strain in the UK [15]. This was a provisional date, with a relative number of infections of around one million people, which was taken as the date of occurrence of the delta variant. For the first time period, calculations were performed using relation (1). Formulas (4) and (5), which take into account the influence of weather conditions on the epidemic intensity, were not used in this study. If necessary, these corrections can be introduced into the calculations, as was done in our previous studies [6, 7].
Equation (6) was used for the second period, when the intensity of infection growth was determined by two virus strains, equation (7) was used for the third period and equation (8) was used for the fourth period. For all periods, the parameter K was calculated according to formulas (2) and (3), depending on the population size of the age group in question and the transmissibility of the virus. The value of the coefficient λ, indicating the effectiveness of the lockdown, could not be determined precisely, but was varied slightly to improve the convergence of the calculated and statistical data.
Taking into account the effectiveness of vaccines in preventing transmission, a relationship was derived to calculate the effective vaccination rate [7]:
$$ \alpha \nu = \alpha_ {1} \nu_ {1} + \alpha_ {2} \nu_ {2} (1 2) $$
Vaccination rates for each vaccine dose 𝑣 1 and 𝑣2 were calculated as the ratio of the percentage of vaccinated population (for each age group) to the total time period of mass vaccination of the population. The coefficient of efficacy of BioNTech-Pfizer and Modern a vaccines for first and full doses of vaccination was taken to be 𝛼1 = 0.49, 𝛼2 = 0.89 for the alpha variant of the virus and 𝛼1= 0.35, 𝛼2 =0,79 for the delta variant, respectively [10]. Without significant loss of calculation accuracy, the effect of the first dose of vaccination was not included in the calculations. Figure 2 shows a comparison of the calculated epidemic development data obtained using the proposed methodology with observational data for the whole Scottish population.
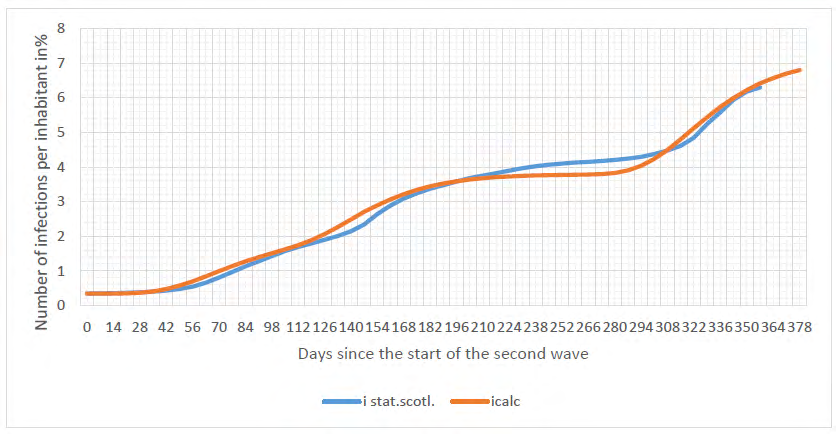
The results of calculations using the proposed methodology (i.calc.total) agree quite satisfactorily with the observed data (i.stat.total). In the analysis of effectiveness of lockdown and vaccination, the seven-day incidence rate is used as the main characteristic of the epidemic’s spread. The seven-day incidence rate was calculated as the difference of two infection rates with a time step of 7 days per 100,000 people for each age group.
Figure 3 shows a comparison of calculated and observed incidence rates for the general population in Scotland. In these and subsequent graphs the following symbols are used: inc.stat.-incidence values for the indicated age groups and for Scotland based on surveillance data, inc.calc. - calculated incidence data for the indicated age groups. The following main conclusions can be drawn from analysis of the graphs in figure 3: the calculated data generally lag behind the statistical data by about ten days. Throughout the epidemic period in question, three characteristic peaks in the number of infected persons can be distinguished. The first peak was associated with the autumn rise of the epidemic, the second with the appearance of the alpha variant, and the third, absolute peak, with an intense rise for the delta variant. The sharp decline in the number of infected after the second peak was mainly due to mass vaccination of the population.
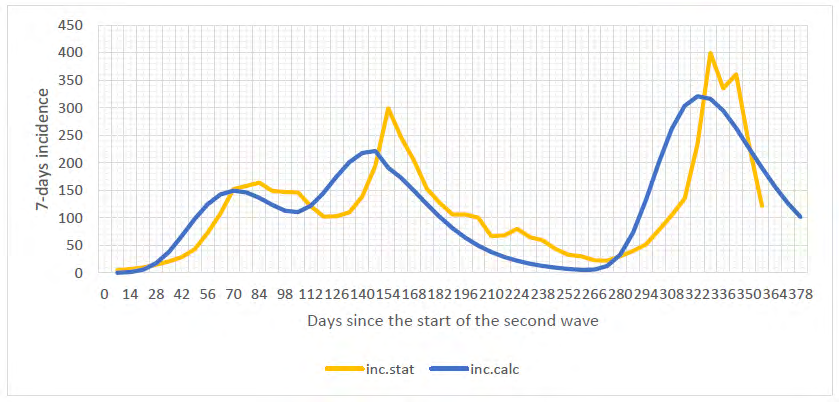
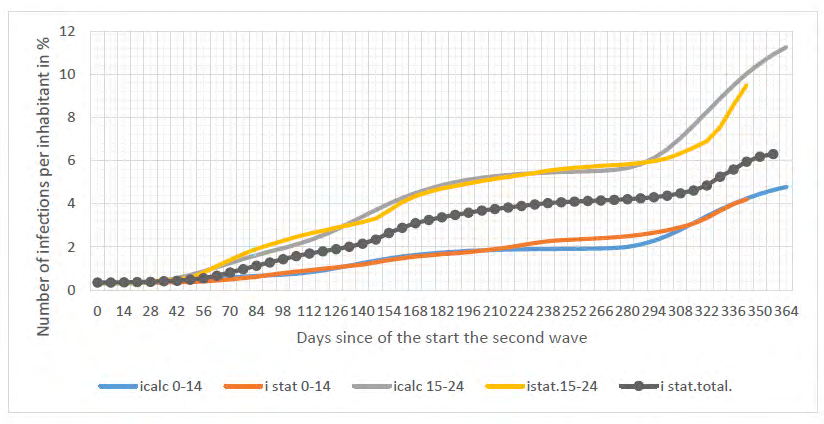
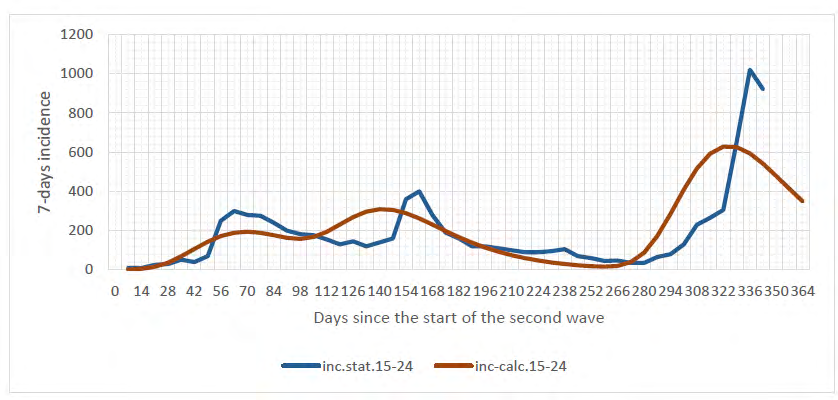
Figure 4 shows the epidemic development for the age groups 0-14 and 15-24. It also illustrates the epidemic development curve for the general population, based on observations. The statistics in this and the following figures were obtained from processing the original information on the daily number of infections given in Jamie L [11]. The calculated data describe well the real picture of the epidemic in these age groups. The intensity of the epidemic in children under 14 is significantly lower than in the general population, while for the 15-24 age group the relative number of infections is 1.5 times higher than for the general population in Scotland. This is explained both by the lower contact rate for children and possibly by their lower susceptibility to the virus [16].
The incidence rate for the 15-24 age groups is shown in Figure 5. The calculated incidence of the epidemic caused by the delta variant is significantly lower than the statistical data. This is despite the fact that for this fourth time period the maximum calculated incidence was almost twice as high as for the general population. In other words, this age group was particularly heavily infected after the emergence of the delta variant of the virus.
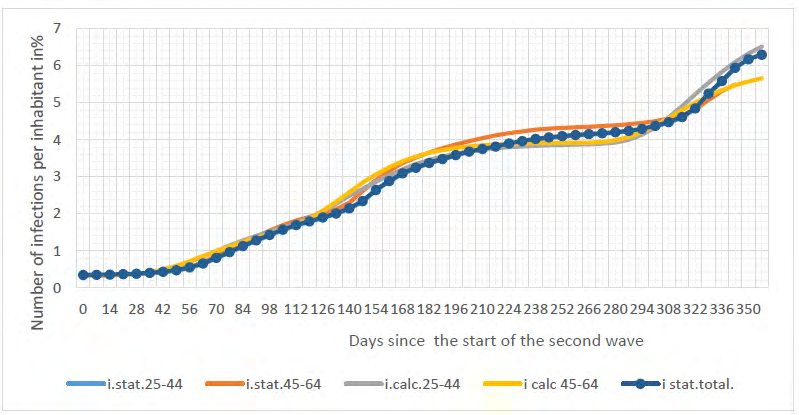
As shown in Figure 6, the intensity of the epidemic in the age groups 25-44 and 45- 64 years old is almost identical and weakly different from the general population. Only after 300 days of the second wave (i.e. early June 2021) a marked decline in the intensity of transmission can be observed in the age group 45-64 years old, associated with mass vaccination of the population in this group. The results for each of these age groups correspond well with the observations.
In the age groups of the elderly aged 65 to 84 and 85+, nearly complete vaccination of this group markedly reduced the intensity of the epidemic caused by the delta variant of the virus (Figure 7). This is especially well seen when comparing the epidemic development in these age groups and in the general population in the fourth quarter of time (at t≥300 days). A significant difference between the calculated data and the statistical data is observed in the initial stage of the second wave of the epidemic for the age group 85 years and older. This discrepancy is particularly noticeable when analyzing the incidence graphs shown in Figure 8.
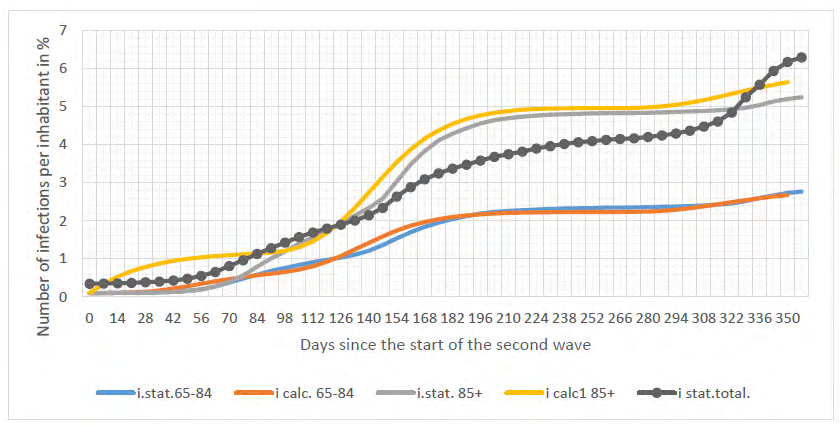
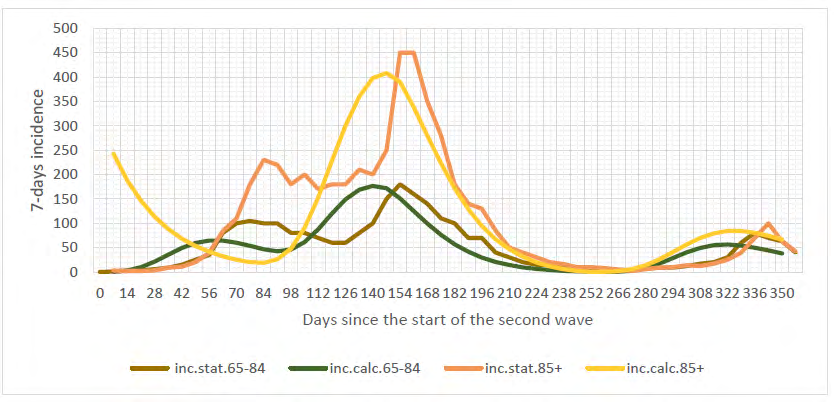
While the calculated figures for ages 65 to 84 years agree with observations, a significant difference can be observed for ages 85 years and older at the start of the second epidemic wave A similar difference between the calculated and statistical data was observed for Berlin in the 90+ age group. This is partly due to the fact that a large proportion of the residents of this age group live in nursing homes, where diseases can acquire a mass character. In addition, the intensity of transmission for residents of this age group is higher than the average for the overall population. At the same time, it is these two age groups that have priority for vaccination. As a result, starting about 170 days after the beginning of the epidemic wave, there has been a steep decline in the number of infected people, as can be seen in Figure 7 and especially in Figure 8. Of particular interest is a comparison of the calculated and statistical data for the fourth time period (at t≥300 days), calculated using equation (8), and using breakthrough formulas (9) and (10) for this period. Overall, it is possible to conclude that the proposed breakthrough methodology can be used to analyse the spread of the epidemic among vaccinated persons, but this should be clarified as more data become available.
In performing the calculations using the proposed methodology, a coefficient λ was used that depends on the level of lockdown, that is, on the relative number of individuals in each age group who comply with the rule of physical distancing, reduction of social contact and fulfillment of the prescribed masking regime, respectively [7]. However, these characteristics are difficult to establish in practice. One can only qualitatively assess trends in lockdown conditions. In general, the lockdown conditions in the fourth time period were slightly relaxed due to a decrease in the number of deaths related to COVID 19 disease.
The coefficient values used for the calculations for each age group and for each of the characteristic time periods highlighted are shown in Table 1.
| Age Group | N *10^6 | λ 1 | λ 2 | λ 4 | v |
|---|---|---|---|---|---|
| 0 - 14 | 0,86 | 0,04 | 0,038 | 0,036 | 0 |
| 15- 24 | 0,55 | 0,034 | 0,035 | 0,034 | 0,001 |
| 25 - 44 | 1,5 | 0,036 | 0,036 | 0,033 | 0,002 |
| 45 - 64 | 1,49 | 0,036 | 0,036 | 0,033 | 0,004 |
| 65 - 84 | 0,94 | 0,039 | 0,037 | 0,036 | 0,009 |
| 85 + | 0,13 | 0,036 | 0,032 | 0,032 | 0,01 |
| Total | 5,47 | 0,036 | 0,036 | 0,033 | 0,004 |
Table 1: The coefficient values used for the calculations.
In the same table, the values of population N and the average vaccination rate for each age group are given. The values of the coefficient λ3 for the third time period were taken to be λ2. As the coefficient λ decreases, the intensity of the epidemic increases. As has been shown in Below D, et al. [2, 3], this coefficient may depend not only on age but also on ethnicity. In general, awareness of the need to meet lockdown conditions, as well as willingness to vaccinate, is determined to a large extent by the psychological characteristics of individuals, which in turn are established through analysis of the behavioral immune system [17].
In conclusion, analyzing the results of the calculations and comparing them with observed data, the overall conclusion is that the proposed calculation methodology based on the ASILV model can be recommended for predicting the spread of the virus for selected age groups under conditions of lockdown and mass vaccination.
Discussion
As the ASILV model quite adequately describes the transmission patterns, it can be used for model calculations when analyzing different situations involving the emergence of new, more transmissible virus strains, such as the delta variant. The intensity of the new wave caused by the virus mutation depends on the level of vaccination and the severity of the lockdown.
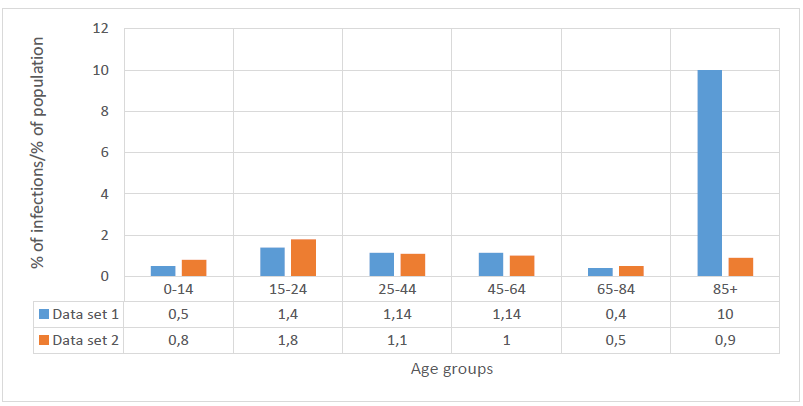
Figure 9 shows, for each age group, the ratio of the percentage of infected persons for each age group to the percentage of the population in that group. The data in row 1 were obtained under epidemic conditions without vaccination, while the data in row 2 were obtained with mass vaccination. For example, for the 85+ age group, before mass vaccination the number of people infected with the virus was 23% of the total number of infections. The size of this group is approximately 2.3% of the total Scottish population. Consequently, the ratio of the percentage of infections to the total percentage of the size of this age group reaches 23/2.3 =10. After vaccination this ratio drops to 0.9. This ratio indicates how actively the age group is affected by the epidemic. With a ratio greater than 1, the group in question is more actively infected than the general population. As previously noted, young people between 15 and 25 years of age are the most heavily affected and the least vaccinated. Individuals in this and the 25 to 45 age group should have been the first to be vaccinated.
However, the vaccination strategy is guided by a slightly different principle, namely, to minimize as far as possible the number of deaths from COVID. This strategy has undoubtedly led to an important positive result - a sharp decrease in mortality in the age groups of 65 to 84 and over 85 years old (Figure 10).
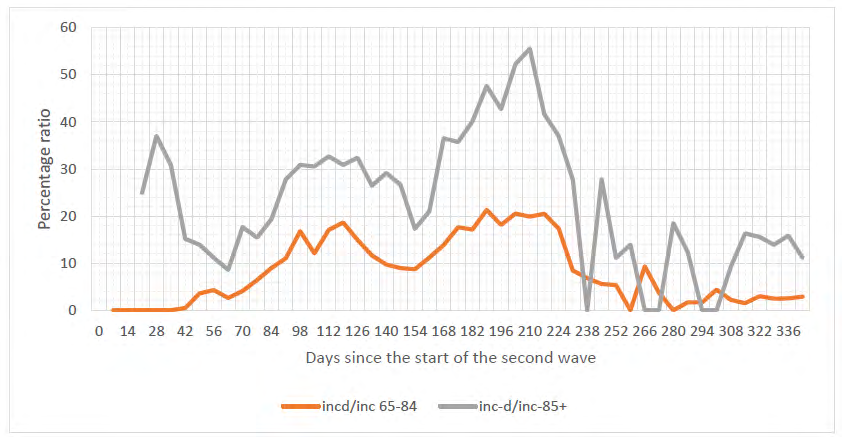
Figure 10: Ratio of incident fatalities to incident infected persons for the 65-84 and 85+ age groups. (incd/inc - ratio of 7-day fatalities to seven-day incidents for age groups 65- 84 and 85+ respectively) The graphs in this figure show, among other things, that before vaccination about 30% of infected persons in the 85+ age group and about 15% of the 65-84 age groups died of COVID. After mass vaccination these figures fell to 5% and 2% respectively. Of particular note are the extremely high relative mortality values at the beginning of the second wave of the epidemic. These high values can be explained by the fact that the number of those infected (these values are in the denominator of the fraction) for this period of time is very small.
In the 45-64 age group, the relative percentage of fatal cases out of the total number of infected people was about 1% before vaccination and about 0.2% afterwards (complete vaccination of persons in this age group is more than 90%). For younger age groups, the number of fatalities is statistically negligible. With the emergence of the delta variant of the virus and with mass vaccination, the proportion of infected people tends to “rejuvenate”. This can also be seen in Fig. 9, according to which the emergence of the new virus variant and vaccination led to a relative increase in the epidemic among children fewer than 15 and teenagers under 25. This trend represents a great danger for children and adolescents to suffer long-term severe complications after convalescence from COVID.
For example, according to Tybur JM [18], around one million people in the UK complain of poorer health after being cured of coronavirus. Considering that the number of infected people in the country is about 6 million, it can be estimated that about 15% of those infected suffer long-term sequelae. Most long-term complications occur after hospitalization for COVID (almost half of all patients have at least one long-term medical complication after hospitalization). Unfortunately, we could not find information on the number of hospital admissions from the virus for different age groups. The percentage of hospital admissions (inc.hosp./inc.) and deaths (inc.d./inc.) to total infections for the whole Scottish population is shown in Figure 11.
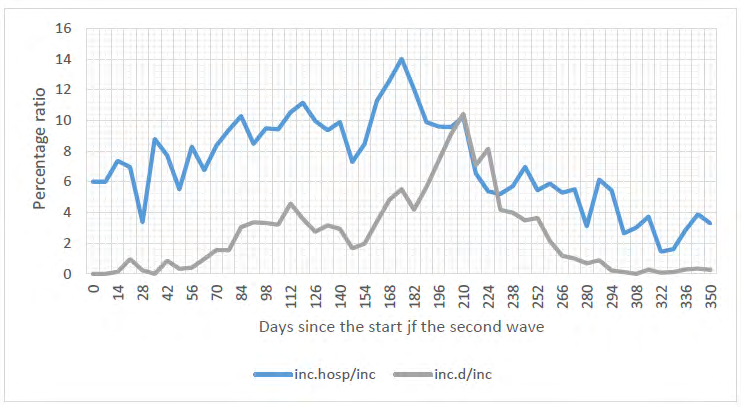
Before mass vaccination the number of hospitalized patients was about 10%; as a result of vaccination, it has fallen to about 3%. Before vaccination, however, a steady increase in the relative number of hospital admissions could be traced as the epidemic progressed, which could be explained by the appearance of the alpha variant after 80 days from the beginning of the second wave of the epidemic. Vaccination reduces the number of hospitalizations significantly, even with the emergence of the more aggressive delta variant. In general, the patterns of change in the relative number of hospitalisations and deaths are qualitatively similar.
Quantitatively, the number of hospitalisations exceeds the number of deaths from coronavirus by a factor of 5-10. It can therefore be roughly estimated that the number of people who suffer a long-term medical complication from coronavirus is about 3-5 times greater than the number of deaths. We estimate the risk of hospitalization for vaccinated persons. The total number of infections in Scotland per day at the end of July 2021 is approximately 1500 and hospital admissions represent approximately 3% of infected individuals i.e. approximately 50 people per day. According to statistics Public Health England [10], of the total number of hospitalized people (92,000 as of 21 June 2021) in the UK, about 40% (about 38,000) are hospitalized after full vaccination, which are about 20 people per day in Scotland. The risk of hospitalization after full vaccination is therefore around 1%.
(Statistics from the CDC report [19] show that the risk of hospitalization after vaccination in the USA is approximately 0.4 %.) As hospitalisations represent approximately 10% of the total number of infected persons, on average, approximately 10% of those vaccinated may be infected with the virus, i.e. according to (8) the coefficient η = 0.1. This value is almost identical to the value of η assumed in the calculations made earlier for (8).
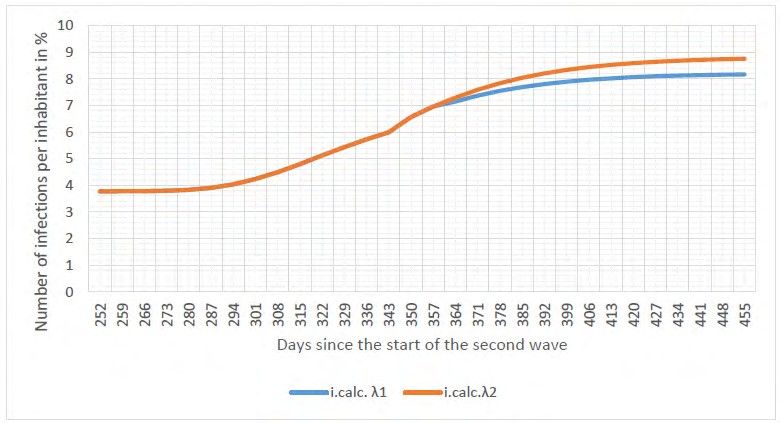
The UK government plans to relax the lockdown in August 2021. As the number of hospitalisations and fatalities depends on the size of the infected individuals, we predict the total number of infected if the lockdown is relaxed. If the mandatory use of masks and other protective measures are removed, the epidemic develops without artificial restrictions. In this case, a minimum coefficient of λ = 0.031 1/day is assumed in the calculation model.
Figure 12 shows graphs of the epidemic development of the delta variant virus for existing lockdown conditions (λ1=0.033 1/day) and when restrictions are reduced (λ2 =0.0311/day). From the comparison of these plots, it appears that reducing lockdown restrictions increases the number of infections by about 10%. There are two reasons for this slight change in the number of infections. Firstly, before the reduction of the lockdown restriction, the lockdown conditions were already quite mild. Secondly, and more importantly, restrictions are lowered during the final phase of the epidemic. A general conclusion can be drawn from analysis of the graphs of the epidemic and especially the change in incidence values that the epidemic associated with each virus variant progresses through two stages. The first stage, up to the maximum, is characterized by an intense growth of infections; in the second stage the intensity of infection decreases. Weakening of lockdown conditions at the initial stage of an epidemic leads to a dramatic increase in the epidemic. This is particularly characteristic of delaying the introduction of a lockdown during the initial phase of the spread of infection.
At the final stage of spread of infection, the weakening of lockdown conditions becomes much less pronounced. This conclusion was reached in Below D, et al. [6] based on model calculations for the conditions of an epidemic caused by the alpha variant of the virus in Israel. When a change in isolation occurs at the moment of emergence of a new strain of the virus, the consequences are maximum. For Israeli conditions, for example, the increase in infections in this case is almost 30%. If the lockdown is lifted a month after the outbreak of a new epidemic wave, the increase in the maximum number of infections does not exceed 15%, and after two months, it is only about 5%. These specific figures were obtained for Israeli conditions, but in principle the conclusion that there is relatively little change in the epidemic in Scotland when lockdown conditions are reduced remains valid.
The main danger of weakening lockdown is that it increases the likelihood of a new, even more transmissible variant of the virus, as many countries, including Scotland, have experienced with the emergence of the delta variant. Estimates Below D, et al. [6] suggest that the likelihood of more than two new strains of the virus emerging per year influencing the growth of the epidemic is around 60%. Another major problem, which so far remains completely unresolved, is the possibility that the resistance to infection in vaccinated individuals will wane over time. With a slowdown in vaccination rates and weakened lockdown requirements, such a decline in immunity could lead to a significant increase in the epidemic of COVID. It has been shown in CDC [20] that immunocompromised patients can generate more transmissible or more pathogenic variants of SARS-CoV-2 [21]. Therefore, studying the possibility of breakthrough infections for patients at risk is particularly relevant.
Conclusion
- A detailed description of the methodology used to calculate coronavirus epidemic spread based on the ASILV age-stratified model is given. The calculations do not require the development of special computer programs and can be easily implemented on a standard EXCEL platform or a standard calculator.
- Comparison of the results of epidemic spread calculations as well as the values of seven-day incidence values calculated using the proposed method with the corresponding observation data shows their good correspondence for individual age groups.
- The overall epidemic process is most influenced by the increase in infection in the 15-44 age groups. Relatively low vaccination rates and high social activity in these age groups cause steeper epidemic waves than for the other age groups.
- The intensity of the epidemic in the 85+ age group has some specific features in comparison with other groups, which may be explained by differences in contact patterns among individuals in this age group.
- The proposed methodology for calculating breakthrough infections among vaccinated persons can be used as an estimate. The methodology should be refined as data on breakthrough infection statistics are accumulated.
- Approximate coefficients for estimating the number of hospital admissions and deaths as a function of the intensity of infection before and after vaccination are given The age-stratified ASILV model that we developed allows detailed and reasonably accurate prediction of the spread of the COVID19 epidemic, including the emergence of new, more transmissible virus variants.
References
-
Below D, Mairanowski F (2020) Prediction of the coronavirus epidemic prevalence in quarantine conditions based on an approximate calculation model. MedRxiv.
-
Below D, Mairanowski J, Mairanowski F (2020) Checking the calculation model for the coronavirus epidemic in Berlin. The first steps towards predicting the spread of the epidemic. MedRxiv.
-
Below D, Mairanowski J, Mairanowski F (2021) Analysis of the intensity of the COVID-19 epidemic in Berlin towards an universal prognostic relationship. MedRxiv.
-
Below D, Mairanowski J, Mairanowski F (2021) Comparative analysis of the spread of the COVID 19 epidemic in Berlin and New York City based on a computational model. Public H Open Acc 5(2): 1-8.
-
Below D, Mairanowski J, Mairanowski F (2021) Development of the COVID19 epidemic model: calculations for a mutating virus. J Qual Healthcare Eco 5(7).
-
Below D, Mairanowski F (2021) The impact of vaccination on the spread patterns of the COVID epidemic. MedRxiv.
-
Below D, Mairanowski F (2021) Functional dependence of COVID-19 growth rate on lockdown conditions and rate of vaccination. MedRxiv.
-
Mairanowski F, Below D (2021) Calculations of the Spread of the COVID-19 epidemic in New York City based on the Analytical Model. J Archives of Medical Case Reports and Case Study 4[3].
-
Mairanowski F, Below D (2021) The age-stratified analytical model for the spread of the COVID-19 epidemic. MedRxiv.
-
PHE (2021) SARS-CoV-2 variants of concern and variants under investigation in England. Technical briefing 17.
-
Jamie L (2021) Effectiveness of Covid-19 Vaccines against the B.1.617.2 (Delta) Variant. N Engl J Med 385: 585-594.
-
PHS (2021) COVID-19 in Scotland.
-
Lewis Macdonald. Chamber and committees.
-
Development of number of Coronavirus cases.
-
ONS (2021) Population estimates for the UK, England and Wales, Scotland and Northern Ireland: mid-2020.
-
PHE (2021) Confirmed cases of COVID-19 variants identified in UK.
-
Fadoua B, Dirk M (2020) Age-stratified discrete compartment model of the COVID-19 epidemic with application to Switzerland. Nature Scientific Reports: 21306.
-
Tybur JM (2020) How Coronavirus Bypasses Our Behavioral Immune System.
-
ONS (2021) Prevalence of ongoing symptoms following coronavirus (COVID-19) infection in the UK.
-
CDC (2021) COVID-19 Vaccine Breakthrough Case Investigation and Reporting.
-
Corey L (2021) SARS-CoV-2 Variants in Patients with Immunosuppression. N Engl J Med 385: 562-566.
- Epidemiological Surveillance and Rumors on Social Media
- Awareness and Treatment of Uncontrolled Hypertension in US Overweight/Obese Youths Aged 16–24 Years, NHANES 2021–2023
- Strengthening EPI Through Parental Engagement: Lessons from Dhaka Slums for IA-2030
- Mothers Knowledge of the Prevalence, Causes, Effects, Prevention and Control of Diarrhoea among Children in Ife East Local Government Area, Ile Ife, Osun State, Nigeria
- Covid-19 Reinfections Case Series from October 2023 to October 2024 in A General Medicine Office in Toledo (Spain)
- Water Contact! One Risk Too Many: Risk Factors Associated with Schistosoma haematobium infection in Osun State, Nigeria