Identification of Comorbidity Patterns in Covid-19 Deceased Patients: A Social Network Approach
Corona Virus disease (Covid-19) is a widespread pandemic disease across the world. The death rates in the case of Covid-19 strongly depend on the comorbidity of an individual. The primary objective is to identify and examine the comorbidity patterns in 137 deceased patients of Chennai City, India and to detect the patterns among the co-morbidities using Social Network Analysis by considering co-occurrence of diseases as relational data. Network metrics such as degree which measures the importance of a node and betweenness which identifies the well-connected node are used to determine occurrence of comorbidities among the covid-19 deceased patients and another metric modularity is used to detect the patterns among the comorbidities. Diabetic and Hypertension are the commonly occurred comorbidities in the deceased patients due to Covid-19 by degree metrics and 3 comorbidity patterns were found by modularity. This study establishes that Social Network Analysis can be used as a potential tool in epidemiological research by identifying co-morbidity patterns among covid-19 deceased patients. Also it establishes the possibility of visualizing networks and making inference on patterns of among co-morbidities based on values of different metric measurements.
Background
The coronavirus disease shortly abbreviated as CoVid-19 is declared as universal widespread by World Health Organization at the beginning of last year. It has created a lot of health related and economic related problems to the entire world. It comes from the family of virus known as SARS-CoV-2 and it is believed that the first virus had been originated from the fish market in Wuhan, China but now the virus is enormously transmitted to all the countries of the world. With around 10 million cases in India, it has made almost every individual to maintain social distance and to stay in isolation [1, 2].
As of December 2020, the covid-19 has infected around 814170 persons with 12069 deaths from the south of India in Tamil Nadu State. Chennai, the capital city of this state had reported around 224386 cases and 3993 deaths [3]. Few studies have reported that Chennai has the highest mortality of 67% among all other district in Tamil Nadu State. The increase of the disease among the people is a gist to the health departments in many states across the country, a significant proportion of ageing population with comorbid conditions continue to getting affected to serious forms of covid-19 and are extremely at risk [4]. At the same time, a few evidence states that adolescent and grownup of the general population are also at high chance of serious disease and adverse outcome [5].
The word “comorbidity” defines the existence of several illness or disease in reference to a supreme disease or dysfunction in a personal. A comorbidity connection between two or more disease occurs at the same time to the patient who suffers a major illness like cancer, covid-19 and other diseases [6, 7]. Comorbidity denotes the co-occurrence of illness or dysfunction in the same patient but there is no pathological relationship between the comorbidities. Multiple diseases occurs often to patients due to the direct or indirect causative associations among illness [8]. The most common comorbidities associated with Covid-19 deceased patients are Diabetic, Hypertension, Respiratory disease, Heart disease, Bone disease, Thyroids, Neurological disease, Brain disease, Bone disease, Blood disease, Liver disease and Kidney disease [4, 9, 10].
Social network analysis is an emerging field in recent days. It helps the public health professionals to understand and identify the patterns, transmission and groups of the infectious disease [11]. In the past 10 years, many network studies were introduced to study the relationship between the diseases which are associated with human. Mainly networks are connected by diseases, Goh K, et al. [12] had used network technique for genetic association [12], Zhou X, et al. [13] used network to study the similarity of symptoms [13], Yildirim MA, et al. [14] used the concept of network theory in finding the similarity of pertinent medication [14], Lee DS, et al. [15] implemented the essential of network methodology in finding the closeness of metabolic reactions catalyzed by corresponding mutated enzymes [15]. Few more studies from the past also spotlighted the vast application of network technique in dissecting the comorbidity pattern of several diseases [16, 17, 18]. The main objective of this study is to show how network method could be used to identify the comorbidities in the case of covid-19 deceased patients. This analysis makes an attempt to identify the pattern of comorbidities of covid-19 patients by identifying the strength of the connection between different comorbidities in terms of death and another importance of this study is to detect the patterns among the comorbidities which are very strongly connected to each other.
Methods
In this paper, a network analysis method is used to identify and detect the comorbidity patterns of covid-19 deceased patients of Chennai, the capital city of Tamil Nadu State. The sample of 137 deceased patients has been collected from the website which is regularly updated by the Department of Health and Family Welfare of Government of Tamil Nadu [3]. This data provides information regarding comorbidities of each diseased patient had and the gender of the patient. Each individual patient is assigned a unique identification number (ID) for maintain confidentiality.
Data Analysis
In this study, initially the relational dataset in the form of nodes and edges are created in Microsoft Excel. Network graphs were generated using the open source software like NodeXL and Gephi (version 0.9.2) to visualize the patterns of the comorbidity among the patients and their gender. Force atlas layout and Expansion layout are used to visualize the pattern and to organize different metric values in table form.
Network Measures
A network is said to be a graph with the combination of N nodes (vertices) and E edges (links) which can be directed or undirected. Let G be the graph with G= (V; E), where V is the number of nodes such that |V|=N and E is the number of edges such that |E|=L. Edges are the connection between two nodes. There are many more properties available in the literature to describe a network. In this study, the network is the connection between comorbidities [19].
Degree Centrality is one of the easiest ways to find the importance of a node. It is simply the total number of connections of the nodes. The degree is of two types namely Out-degree and In-degree. Out-degree finds the number of connection from the single comorbidity (node). The higher out-degree of a co-morbidity indicates that this co-morbidity is the most influencing one. In-degree finds the number of connections coming into a single case (node) [20, 21]. Betweenness Centrality is another centrality measure which defines how frequent the comorbidity (node) acts between patients (node) in the network. This measure is used to identify the shortest path between that patient-comorbidity. A maximum betweenness measure implies that the particular comorbidity (node) is the potential factor which acts as a bridge between the target [22, 23]. Modularity is another measure which is used to identify the groups or clusters. Network with higher modularity has a deep connection between the nodes within a group and loose connection between groups. This measure is mainly used to detect the number of cluster in a network [24, 25].
Density is used to describe the proportion of ties between the several comorbidities. It displays the frequency of comorbidities connection with other comorbidities that each patient associated at the time of death [26]. A thick network is a network in which the number of connection is close to each other. The density of a network is calculated by the number of connection in a network to the actual number of connection present in case the network is a full network [27].
Results
We considered 137 samples of a covid-19 deceased patient with comorbidity for this study. Patient and comorbidity are treated as nodes. The connection between two nodes is said to be an edge and it is weighted according to the number of comorbidities that each patient associated [28]. In addition to this, we also had information about the patient’s gender.
Network Visualization of Comorbidities of Covid-19
A network graph is obtained where all the nodes are linked to almost all the other nodes. The node with maximum values of degree and betweenness and with minimum value of closeness is identified as the most influential node. This current methodology helps to detect the influenced comorbid condition and their patterns among deceased Covid-19 patients (Figures 1-3).
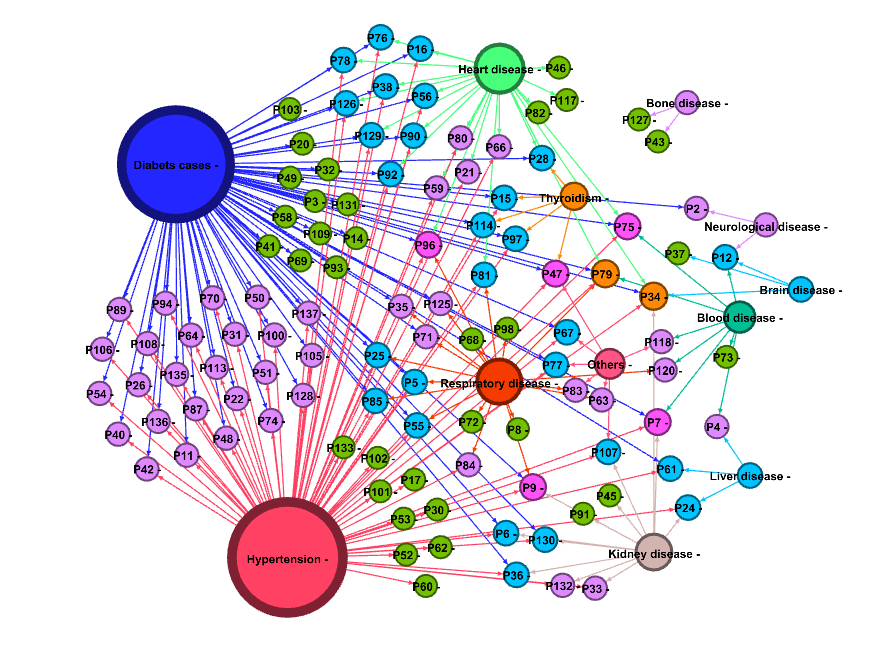
Figure 1 shows the Network visualization of comorbidities associated with Covid-19 deceased patients. Comorbidities such as Diabetic, Hypertension, Respiratory disease, Heart disease, Bone disease, Thyroidism, Neurological disease, Brain disease, Bone disease, Blood disease, Liver disease and Kidney disease are the important nodes. The lines which connect Comorbidity and Patients are the Edges. The colour of patient node describes the number of comorbidity that each patient had at the time of death. Green colour node describes that each patient had only one comorbidity. Violet depicts two comorbidity, Sky Blue colour implies three comorbidity, Purple colour for four comorbidity and Orange colour shows that each patient had five comorbidity at the time of death. The size of a node indicates the occurrence comorbidity and large in size implies more comorbidity occurred. The node sizes of Diabetic and hypertension indicate that many patients are associated with these two comorbidities.
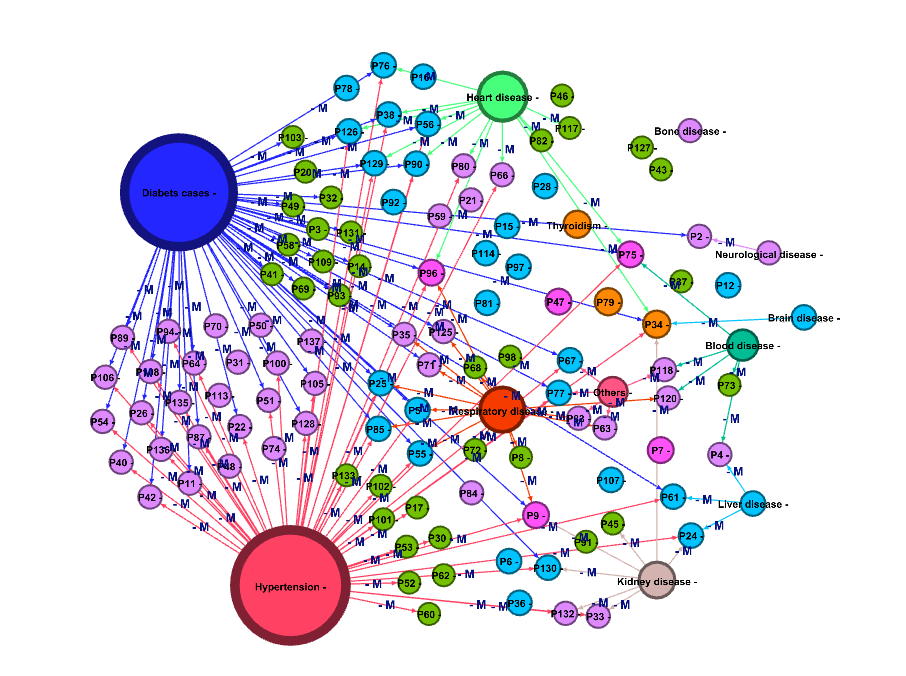
Figure 2 shows the network visualization of Male patients. It is clearly seen in the graph that around 66% of edges are marked with label M. It implies that out of 137 patients, 66% were males. There are 121 nodes and 150 edges. The sizes of the nodes indicate that diabetic and hypertension are commonly occurring comorbidity. 41% of male patients are affected by more than 2 comorbidity conditions. From this network we find that P34 has the highest degree of 5 which shows that this person had five comorbidity at the time of death.
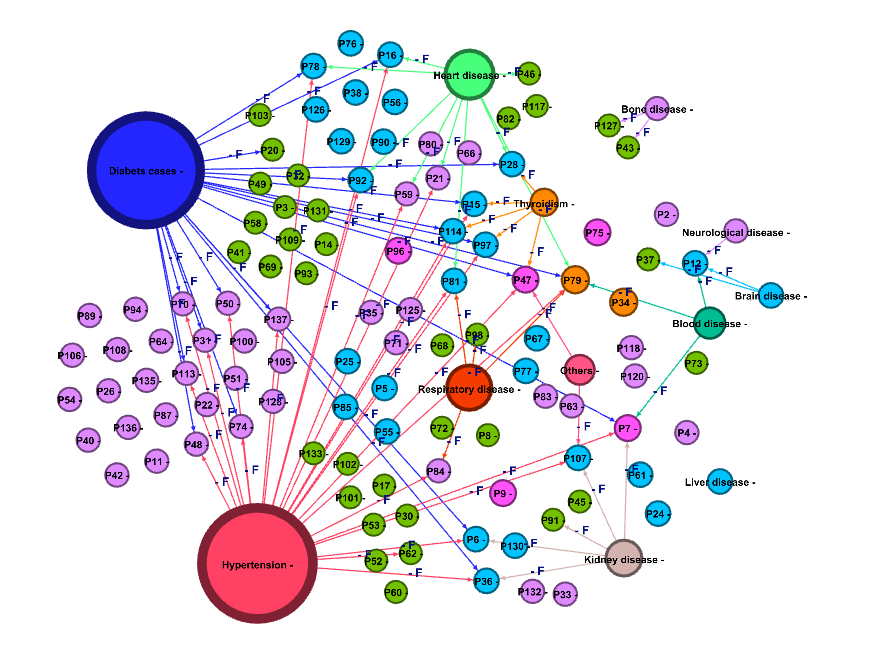
Figure 3 shows the network visualization of Female patients. It is clearly seen in that around 34% of edges marked with the label F. This result implies that out of 137 patients, 34% are female. There are 121 nodes and 77 edges. Forty- five percent of female patients had at least three comorbidity at the time of death. The female patient with IDP79 has the highest degree of 5.
Analysis of Comorbidity Patterns in Covid-19
Subgroups or sub-network are said to be a graph obtained from the subsets of nodes and edges from the graph using network analysis. This sub network analysis is used to determine comorbidity patterns. There are three comorbidity groups are identified through the sub- network and they are named as G1, G2 and G3 (Figure 4). This network analysis identifies three different comorbidity patterns. The comorbidities associated in G1 is found to be Diabetic, Hypertension, Heart disease, Respiratory disease, Thyroidism and others. G2 is found to be Blood disease, Brain disease, Kidney disease, Liver disease and Neurological disease. A minor network G3 is found to be a Bone disease.
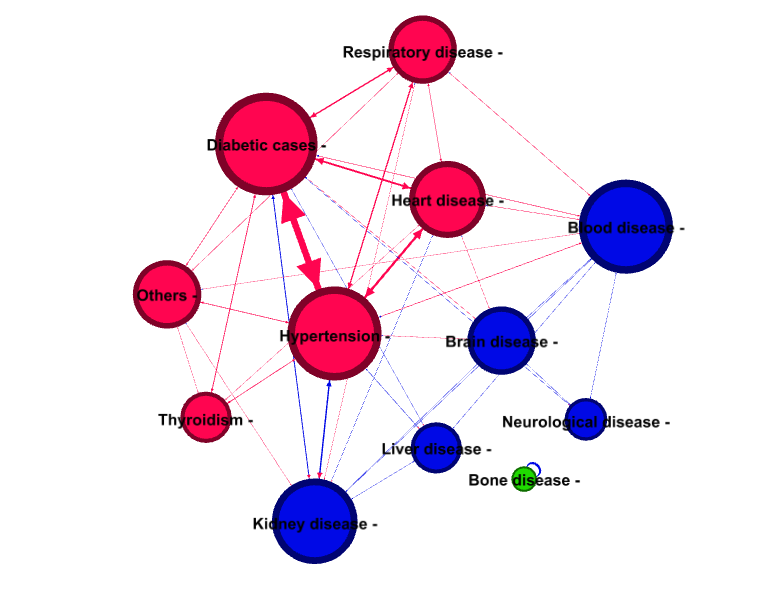
Figure 4 shows the Network visualization of sub networks of comorbidities. This graph clearly shows that there are two major networks and one minor network is present in the comorbidity. Red coloured node for G1, blue coloured node for G2 and green coloured node for G3.
The patterns of the comorbidity associated with patients are further classified into 10 sub-groups and are visually represented through network graph (Figures 4a-4j).
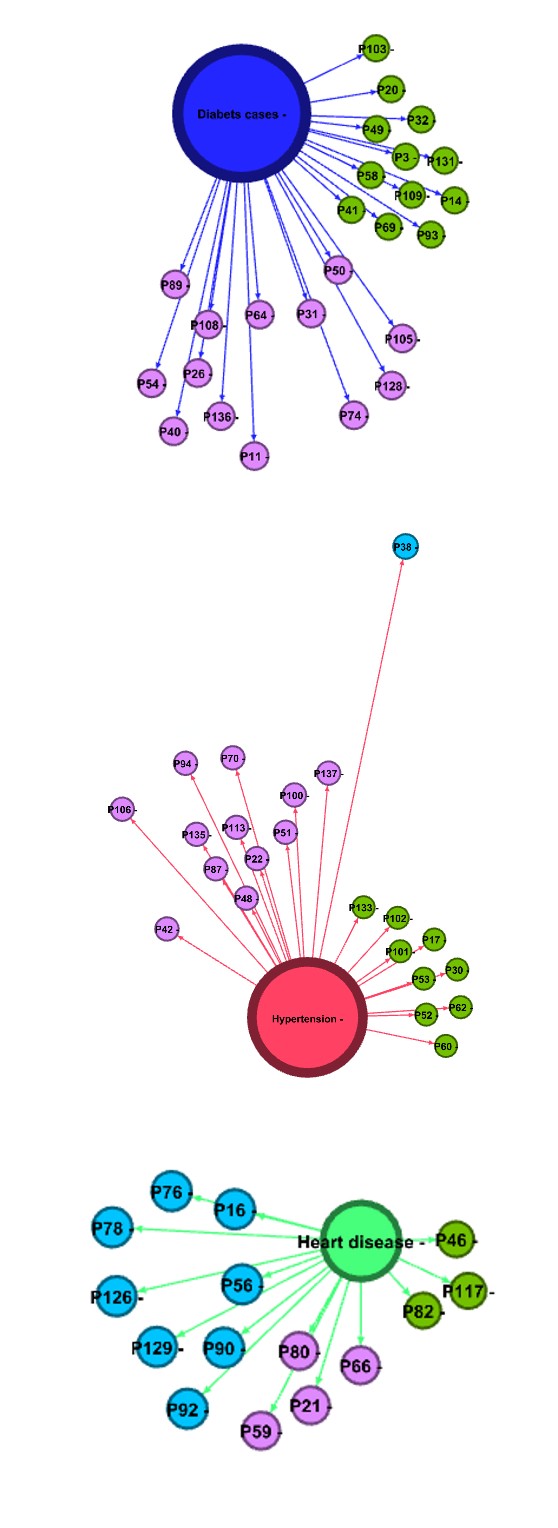
Figure 4a: Diabetic Cases: Diabetic cluster consist of 25 patients who have the comorbidities of 1 or 2. Out of this 25, 12 patients had diabetic only (green colour node) and the rest had diabetic and other disease (Table 4).
Figure 4b: Hypertension: Hypertension cluster consist of 22 patients who had the comorbidities of 1, 2 and 3. Out of this 9 patients had hypertension only (green colour node) and rest had hypertension and other disease. P38 has the highest comorbidity of three in hypertension cluster.
Figure 4c: Heart Disease: Heart disease cluster consist of 15 patients who had the comorbidities of either 1 or 2 or 3. Only 3 patients had died due to Heart related disease. P82, P117 and P46 are the patients associated with Heart disease only.
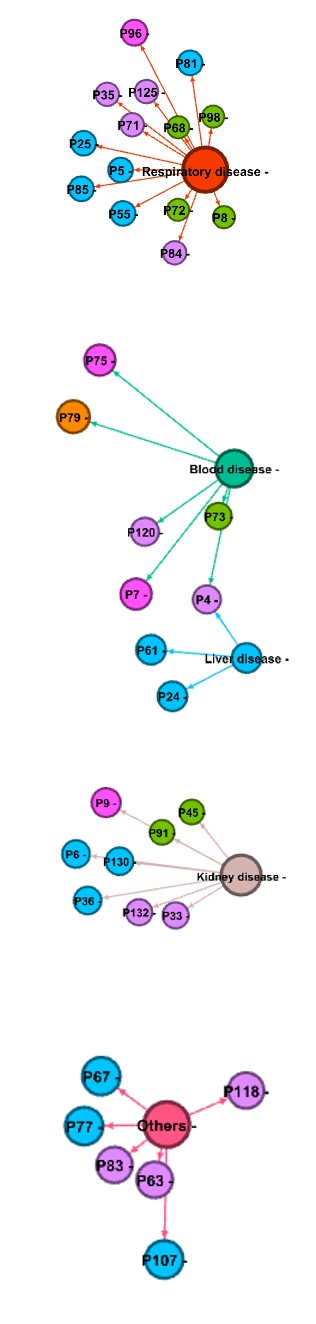
Figure 4d: Respiratory Disease: Respiratory cluster consist of 14 patients who had the comorbidities of either 1or 2or 3 or 4. P96 has the maximum comorbidities of 4. P8, P68, P2 and P98 are the patients associated with Respiratory problems alone.
Figure 4e: Blood & Liver Disease: Blood and liver disease cluster consist of 9 patients with the comorbidities of 1 to 5. Only P73 has the Blood disease and the others had more than 1 comorbidity.
Figure 4f: Kidney Disease: Kidney disease cluster consist of 8 patients with comorbidities of either 1 or 2 or 3 or 4. There are two patients in this cluster who are associated with kidney disease. P9 has the maximum comorbidities of 4.
Figure 4g: Others: There are 6 patients who falls under others category with comorbidities of 2 and 3. This cluster does not influence much in the overall network since this is the cluster of unidentifiable illness.
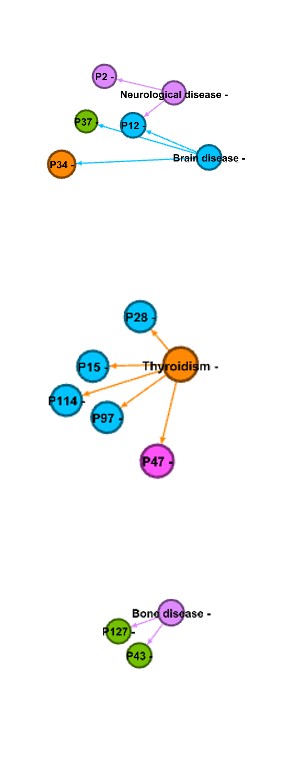
Figure 4h: Neuro & Brain Disease: Neurological and Brain related cluster has the maximum of 5 patients with comorbidities of 1, 2, 3 and 5 where P37 has the least comorbidity of 1 and P34 has the maximum comorbidities of 5.
Figure 4i: Thyroidism: Thyroidism cluster has the maximum of 5 patients with maximum comorbidities of 3 and 4. Not even single patient associated with one morbidity in this cluster. P47 has the highest of 4 comorbidities.
Figure 4j: Bone Disease: Bone disease cluster has the maximum of 2 patients with comorbidity of 1. P43 and P127 are the patients who had the only morbidity of Bone related issues.
The following Network has the Node of 121 and Edge of 227. The calculated metric shows that Diabetic and Hypertension has the highest degree of 73 and 76. And it is seen that 53% of Deceased people had Diabetic and Hypertension in the network. The remaining comorbidities such as Liver disease 2.8%, Respiratory disease 15.1%, Heart disease 17.9%, Kidney disease 11.5%, Neurological disease 4.3%, Thyroidism and Blood disease 5.7%,Brain and Bone disease 2.8% and Others 5% are contributing towards the overall comorbidity of deceased covid-19 Patients Network from (Table 1).
| Degree | Betweenness centrality | Female (%) | Male (%) | |
|---|---|---|---|---|
| Diabetic cases | 73 | 271.58 | 28% | 72% |
| Hypertension | 76 | 141 | 33% | 67% |
| Liver disease | 4 | 90 | 0% | 100% |
| Respiratory disease | 21 | 69.25 | 21% | 79% |
| Heart disease | 25 | 41.75 | 41% | 59% |
| Kidney disease | 16 | 27.92 | 42% | 58% |
| Neurological disease | 6 | 15.5 | 50% | 50% |
| Thyroidism | 8 | 15 | 100% | 0% |
| Bone disease | 4 | 14 | 100% | 0% |
| Brain disease | 4 | 7 | 67% | 33% |
| Blood disease | 8 | 0 | 38% | 62% |
| Others | 7 | 0 | 29% | 71% |
Table 1: Metric Values of Comorbidities of Deceased Covid-19 Patients.
Betweenness centrality measure gives slight variation in the comorbidity patterns. These measures depict Diabetic with the highest betweenness measure of 271.58 and Hypertension with the measure of 141. This measure is implying that Diabetic has the major role than Hypertension since Diabetic act as the most connected comorbidity which leads to death. Other comorbidities such as Liver disease of 90, Respiratory disease of 69.25, Heart disease of 41.75, Kidney disease of 27.91, Neurological disease of 15.5, Thyroidism of 15, Bone disease of 14 and Brain disease of 7 are the other bridging comorbidities which frequently acts among the deceased patients from (Table 1).
Out of 137 deceased patients, we found 66 % are male patients and 34% are female patients. Nearly 41% of male patients are falling under two comorbidities whereas only 30% of female patients are falling under this category. Total of 75% of male patients had died with the history of 1 and 2 comorbidity. Whereas only 54% of female patients had died with the history of 1 and 2 comorbidity. Almost 45% of female patients had died by the presence of more than 2 comorbidity and only 25% of male patients had died with the presence of more than 2 comorbidity. Thus comorbidity condition in male is different from female (Tables 2 & 3).
| Patients with Comorbidity | No of Patients | Percentage | |
|---|---|---|---|
| 1 | P101,P102,P103,P109,P117,P131,P133,P14,P17,P3,P30,P32,P41,P45,P49,P52,P53,P58,P60,P68,P69,P72,P73,P8,P82,P93 | 26 | 34% |
| 2 | P100,P105,P106,P108,P11,P118,P120,P125,P128,P132,P135,P136,P2,P22,P26,P33,P35,P4,P40,P42,P51,P54,P63,P64,P66,P71,P80,P83,P87,P89,P94 | 31 | 41% |
| 3 | P126,P129,P130,P24,P25,P38,P5,P55,P56,P61,P67,P76,P77,P85,P90 | 15 | 20% |
| 4 | P75,P9,P96 | 3 | 4% |
| 5 | P34 | 1 | 1% |
Table 2: Degree metric values of comorbidities of Deceased Covid-19 patients- Male.
| Patients with Comorbidity | No of Patients | Percentage | |
|---|---|---|---|
| 1 | P127,P20,P37,P43,P46,P62,P91,P98 | 8 | 24% |
| 2 | P113,P137,P21,P31,P48,P50,P59,P70,P74,P84 | 10 | 30% |
| 3 | P107,P114,P12,P15,P16,P28,P36,P6,P78,P81,P92,P97 | 12 | 36% |
| 4 | P47,P7 | 2 | 6% |
| 5 | P79 | 1 | 3% |
Table 3: Degree metric values of comorbidities of Deceased Covid-19 patients- Female.
Based on Modularity and Density we found 2 major clusters G1 and G2 with the graph density 0.8 (Table 4). Within these 2 major clusters we found 10 subgroups where diabetic has the highest contribution of 21.40%. Maximum of 18% of patients were associated with this comorbidity and Hypertension is another sub-group with the contribution of
19.01% with 16% of deceased patients were suffered with this abnormality. Heart related disease has 13.22% contribution to the overall comorbidity pattern with 11% of patient had the history of heart related problems from the overall study. Respiratory disease has contributed 12.40% in the network with maximum of 10% of patients had respiratory problems. The combination of both Blood disease and liver disease had contributed 8.26% in the network with the maximum of 6.5% of patients suffered with these morbidity. Other comorbidity conditions such as Kidney disease, Neurological and Brain disease, Thyroidism, Others, Bone disease are the subgroups which are identified in the comorbidity patterns of deceased covid-19 patients. Based on this sub-group analysis we found different categories of patients who are associated with several comorbidities.
| Group | Percentage | Node | Edge | Density | |
|---|---|---|---|---|---|
| Diabetic cases | G1 | 21.40% | 26 | 25 | 0.8 |
| Hypertension | G1 | 19.01% | 23 | 22 | 0.8 |
| Heart disease | G1 | 13.22% | 16 | 15 | 0.8 |
| Respiratory disease | G1 | 12.40% | 15 | 14 | 0.8 |
| Others | G1 | 5.79% | 7 | 6 | 0.8 |
| Thyroidism | G1 | 4.96% | 6 | 5 | 0.8 |
| Blood & Liver disease | G2 | 8.26% | 10 | 9 | 0.8 |
| Kidney disease | G2 | 7.44% | 9 | 8 | 0.8 |
| Neurological & Brain disease | G2 | 4.96% | 6 | 5 | 0.8 |
| Bone disease | G3 | 2.48% | 3 | 2 | 0 |
Table 4: Summary of Sub groups of Comorbidities of Deceased Covid-19 patients.
Discussion
Few epidemiological studies on covid-19 have emphasized the importance of comorbidity pattern and the need for finding such a pattern in infectious disease. Through this study, a social network analysis method is implemented to find the comorbidity pattern of a covid-19 deceased patient. Availability of relational dataset consist of a patient and their comorbidity at the time of death was an advantage which made us use this standard social network analysis methods. This paper highlights the overall pattern of comorbidity in covid-19 deceased patients and the individual’s comorbidity. The centrality measure showed that Diabetic and Hypertension had influenced more in the comorbidity pattern. Thus the measures used in this study are highly useful to identify and measure the difference among the comorbidity patterns and also this study reveals that only a few comorbidities are acting as the important node in the network.
The network measures and its subgroup will help the researchers to identify the most influenced comorbidity and the patient associate with each comorbidity [16, 24, 29]. The visualizing tools of network study would be very helpful to analyze and interpret the comorbidity pattern of Covid-19 deceased data. We tend to perceive that distinguishing the comorbidity patterns on Covid-19 holds a lot of details and this might be explored by several approaches and Social Network methodology is one among them [30, 31, 32, 33].
This study shows that social network analysis has its application in public health. From a methodological perspective, we are saying that this network method is one in all the simplest approach to visualize and spot the patterns of the comorbidity of the covid-19 deceased patient. A similar approach can also be used for larger datasets. Thus our study recommends the researcher to make use of these methods in any kind of infectious disease to identify the disease patterns of patients and their comorbid conditions.
Conclusion
Few studies in the literature have analyzed the patterns of comorbidity. There are many studies like Survival analysis, Regression and other statistical techniques frequently used in public health and these kinds of studies mainly focus on the relationship between variables and outcome of the disease, whereas network analysis is different from other classical approaches since the main interest of network approach lies in relationship within variables [6, 17]. The main advantage of choosing network analysis is that the data using for the study does not need any assumptions for further analysis. Thus network analysis method is very useful in epidemiological studies and it is the only technique to visualize and infer on the patterns of relationship within the considered nodes in the study employing both quantitative and clustering technique.
References
-
Singh BP, Singh G (2020) Modeling Tempo of COVID-19 Pandemic in India and Significance of Lockdown. Journal of Public Affairs 20(4): 2257.
-
Gupta PK, Bhaskar P, Maheshwari S (2020) Coronavirus 2019 (COVID-19) Outbreak in India: A Perspective so Far. J Clin Exp Invest 11(4): 00744.
-
GOI (2020) Daily Report on Public Health Measures Taken for COVID-19 Chennai: Directorate of Public Health and Preventive Medicine Health and Family Welfare Department, Government of Tamil Nadu.
-
Guan WJ, Liang WH, Zhao Y, Liang HR, Chen ZS, et al. (2020) Comorbidity and its impact on 1590 patients with COVID-19 in China: a nationwide analysis. Eur Respir J 55(5): 2000547.
-
Adams SH, Park MJ, Schaub JP, Brindis CD, Irwin CE (2020) Medical Vulnerability of Young Adults to Severe COVID-19 Illness-Data from the National Health Interview Survey. Journal of Adolescent Health 67(3): 362-368.
-
Hidalgo CA, Blumm N, Barabási AL, Christakis NA (2009) A Dynamic Network Approach for the Study of Human Phenotypes. PLoS Computational Biology 5(4).
-
Moni MA, Liò P (2014) ComoR: a Software for Disease Comorbidity Risk Assessment. J Clin Bioinforma 4(1): 1-11.
-
Tong B, Stevenson C (2007) Comorbidity of Cardiovascular Disease, Diabetes and Chronic Kidney Disease in Australia. Australian Institute of Health and Welfare.
-
Chen T, Wu D, Chen H, Yan W, Yang D, et al. (2020) Clinical Characteristics of 113 Deceased Patients with Coronavirus Disease 2019: Retrospective Study. BMJ 368: 1091.
-
Liu H, Chen S, Liu M, Nie H, Lu H (2020) Comorbid Chronic Diseases Are Strongly Correlated with Disease Severity among COVID-19 Patients: A Systematic Review and Meta-Analysis. Aging and Disease 11(3): 668-678.
-
De P, Cox J, Boivin JF, Platt RW, Jolly AM (2007) The Importance of Social Networks in Their Association to Drug Equipment Sharing among Injection Drug Users: A Review. Addiction 102(11): 1730-1739.
-
Goh KI, Cusick ME, Valle D, Childs B, Vidal M, et al. (2007) The Human Disease Network. Proc Natl Acad Sci USA 104(21): 8685-8690.
-
Zhou X, Menche J, Barabási AL, Sharma A (2014) Human Symptoms-Disease Network. Nat Commun 5(1): 4212.
-
Yildirim MA, Goh KI, Cusick ME, Barabasi AL (2007) Vidal Marc. Drug-Target Network. Nat Biotechnol 25(10): 1119-1126.
-
Lee DS, Park J, Kay KA, Christakis NA, Oltvai ZN, et al. (2008) The Implications of Human Metabolic Network Topology for Disease Comorbidity. Proc Natl Acad Sci USA 105(29): 9880-9885.
-
Girvan M, Newman MEJ (2002) Community Structure in Social and Biological Networks. PNAS 99(12): 7821- 7826.
-
Leva F, Bitonti D (2018) Network Analysis of Comorbidity Patterns in Heart Failure Patients Using Administrative Data. Epidemiology Biostatistics and Public Health 15(2): 1-6.
-
Gagne JJ, Glynn RJ, Avorn J, Levin R, Schneeweiss S (2011) A combined comorbidity score predicted mortality in elderly patients better than existing scores. J Clin Epidemiol 64(7): 749-759.
-
Barabási AL (2016) Network Science. Cambridge university press.
-
Hansen D, Smith M, Ackland R (2010) Analyzing Social Media Networks.
-
Degree Centrality-an overview.
-
Latkin C, Mandell W, Oziemkowska M, Celentano D, Vlahov D, et al. (1995) Using Social Network Analysis to Study Patterns of Drug Use among Urban Drug Users at High Risk for HIV/AIDS. Drug and Alcohol Depend 38(1): 1-9.
-
Betweeness Centrality-an overview.
-
Brandes U, Delling D, Gaertler M, Görke R, Hoefer M, et al. (2008) On Modularity Clustering. IEEE Transactions on Knowledge and Data Engineering 20(2): 172-188.
-
Newman MEJ (2016) Community Detection in Networks: Modularity Optimization and Maximum Likelihood Are Equivalent. ArXiv.
-
Borgatti SP, Cross R (2003) A Relational View of Information Seeking and Learning in Social Networks. Management Science 49(4): 432-445.
-
Lowes S, Lin P, Wang Y (2007) Studying the Effectiveness of the Discussion Forum in Online Professional Development Courses. Journal of Interactive Online Learning 6(3): 181-210.
-
Csardi G, Nepusz T (2006) The Igraph Software Package for Complex Network Research. Complex Systems 1695(5): 1-9.
-
Newman, MEJ (2004) Fast Algorithm for Detecting Community Structure in Networks. Physical Review E 69(6): 5.
-
Meyers LA, Pourbohloul B, Newman MEJ, Skowronski DM, Brunham RC (2005) Network Theory and SARS: Predicting Outbreak Diversity. Journal of Theoretical Biology 232(1): 71-81.
-
Chen YD, Tseng C, King CC, Wu TSJ, Chen H (2007) Incorporating Geographical Contacts into Social Network Analysis for Contact Tracing in Epidemiology: A Study on Taiwan SARS Data. Lecture Notes in Computer Science 4506: 23-36.
-
Nagarajan K, Das B (2019) Tuberculosis and Social Networks: A Narrative Review on How Social Network Data and Metrics Help Explain Tuberculosis Transmission. Current Science 116(7): 1068-1080.
-
Nagarajan K (2017) Disciplines-A Review of Existing Research Literature. 05(5): 22213-22220.
- Epidemiological Surveillance and Rumors on Social Media
- Awareness and Treatment of Uncontrolled Hypertension in US Overweight/Obese Youths Aged 16–24 Years, NHANES 2021–2023
- Strengthening EPI Through Parental Engagement: Lessons from Dhaka Slums for IA-2030
- Mothers Knowledge of the Prevalence, Causes, Effects, Prevention and Control of Diarrhoea among Children in Ife East Local Government Area, Ile Ife, Osun State, Nigeria
- Covid-19 Reinfections Case Series from October 2023 to October 2024 in A General Medicine Office in Toledo (Spain)
- Water Contact! One Risk Too Many: Risk Factors Associated with Schistosoma haematobium infection in Osun State, Nigeria