Scale-Free Emergence of Contagion Networks from Random Populations
A contagion network forms as a subnetwork within a larger “social network” when actors become infected and transmit infections to others. Nodes represent infected actors, and links represent contact that resulted in transmitting the infection from one person to another. The result of random contact is a non-random contagion network. Simulation of an SIR contagion shows emergence of a scale-free micro-scale structure with degree and betweenness distributions that obey a power law. Thus, contagion networks are the result of mild self-organization of scale-free structure-both degree distribution and betweenness centrality distribution obey a power law. This surprising result reinforces public health policies that advocate contact tracing and testing as early and fast as possible. An effective counter measure, barring availability of a vaccine, is testing and contact tracing back in time as far as possible, to disrupt the emergence of a contagion network.
Motivation
In Lewis TG, et al. [1] showed that predicting the size and duration of the covid-19 pandemic is nearly impossible due to variations in population, populating density, and public policies concerning social distancing rules as well as the politics of quarantine. In a second paper [2], the authors showed that uneven distribution of population is a major cause of surges and waves of infection. In both studies, and in other studies as well [3], methods and models for prediction of size and duration of epidemics are based on OLS (Optimal Least Squares) curve fitting of an idealized mathematical model to actual data. This approach seems rather ad hoc compared to understanding the basic processes of infection. The result is unreliable estimates of size and duration. Mathematical models, such as the Kermack-McKendrick SIR model [4], attempt to represent the macro-scale model of contagion spreading as a function of time plus a handful of Investigation Paper parameters such as infection rate and removal/recovery rate. They do not attempt to examine the micro-scale structure of epidemic spreading from person-to-person. At the micro- scale, a contagion creates a contagion network with structure that emerges from non-structure or randomness. It is this emergent process and the resulting micro-scale structure of the network formed by infected people that concerns this study.
As it turns out, network structure emerges from random selection and chance infections from contact between infected and susceptible individuals. The nodes (actors) of this “social network” are infected individuals, and the links represent contact-infected actors passing the infection to other actors with a certain infection probability. The resulting network is not random. Rather, in this simulation study, we show that the resulting contagion network tends to be scale- free [5]. That is, the emerged node degree distribution is long-tailed and is approximated by a power law ~ d-q, where -q is an exponent, d is node degree and q is fractal dimension. The “amount of structure” or “scale-free-ness” is quantified by the spectral radius, ρ, of the resulting network. Spectral radius is the largest eigenvalue of the connection matrix.
As the disease spreads through a population, a scale-free contagion network emerges. Additionally, the betweenness distribution of the emerged contagion network also obeys a power law, further contributing to the claim that contagion networks form as a result of self-organization. We show that this effect is more pronounced as the contagion spreads more rapidly or for longer duration. In effect, contagion networks emerge from randomness. They exhibit a definite structure (entropy is reduced). The main contribution of this research is in identifying the emergence of micro-scale structure. The author believes this is the first attempt to characterize contagion networks in terms of emergence and note that contagion networks exhibit scale-free structure as a result. Knowing that scale-free structure emerges, add credibility to contact tracing as early in the epidemic as possible.
The Model
We assume an SIR (Susceptible-Infected-Recovered) process whereby infections spread at an infection rate given by input v, and infected actors remain infected for a short period of time given by Gaussian variate latency = µ ± stdDev, where µ is the mean value of latency, and stdDev is the standard deviation of the sampled latency. An infected actor cannot infect other actors, except during its latency period, [ti, ti + latency], where ti is the time of onset of infection of node i. That is, latency is sampled from a Normal distribution with mean = µ and standard deviation stdDev to simulate variations observed in reality.
The model is quite simple. Given a population of n susceptible actors, a constant infection rate, v, and an infected SEED actor chosen at random, perform the following heuristic until no additional susceptible actors are available to be infected. At the end of a trial run, Consequence is the number of actors that have been infected.
1. Time = 0. 2. Set all actor latency times to µ ± stdDev. 3. Randomly selected actor SEED is initially infected. a. Consequence = 1. 4. Repeat until done: a. Randomly select an uninfected actor, A. b. Infect A with probability v: i. Connect SEED to A with a link. ii. Mark A as infected. iii. Increment Consequence by 1. iv. Set SEED = A. c. Increment Time.
5. End
This heuristic is not entirely satisfactory for simulation on a sequential computer, because the number of infected actors explodes as each generation of SEEDs branches out. Starting with one infected actor at Time = 0, there may be dozens of infected actors at Time = 1, and even more at Time = 2, etc. Each of these infected actors at Time t may infect other actors, simultaneously. We must simulate this concurrency without the results of one generation conflicting with the results of another generation. A simple Map-Reduce operation is employed to simulate concurrency on a sequential machine. Map-Reduce consist of two steps,
- Mark future infected actors in the first scan of the entire network, and
- In a second scan, change the state of marked actors to infected. This is the purpose of the visited flag on each actor node, below.
The steps for this on a sequential computer use variable visited to flag infected actors while delaying the actual state change to infected until all concurrent infections have been flagged. A timer is associated with each node to determine when it is in an infected mode and when it no longer can infect other actors. When timer counts down to zero, the infected node is no longer infectious.
The NW_doAddLink method connects the two nodes together when an infection occurs. Thus, a micro-structure emerges from randomness as the simulation progresses. This structure is measured by calculating the degree distribution and noting that it is long tailed. Additionally, we compute the betweenness distribution of all nodes, compose its distribution, and note that it is also long tailed. Hence, we have two strong indicators of self-organization as a result of the spread of a contagion.
The Java code for the enhanced simulation is shown below. This code is executed for each tick of the clock, Time = 1, 2, 3, … maxTime. Results were averaged over 3 trials.
Infection rate determines the speed of spreading. Latency determines the ultimate number of infected cases. If latency is very large, infections rise exponentially and then level off when the entire population has been infected. This is illustrated in Figure 1, by the “no latency” curve which shows spreading to all actors. When latency is very small, spreading does not reach all actors before dying out, because in this model, actors can only be infected once. Furthermore, the number of infecting actors soon dies out, too, leaving no actor to infect others. Thus, latency controls the size of the epidemic, while infection rate controls the duration.
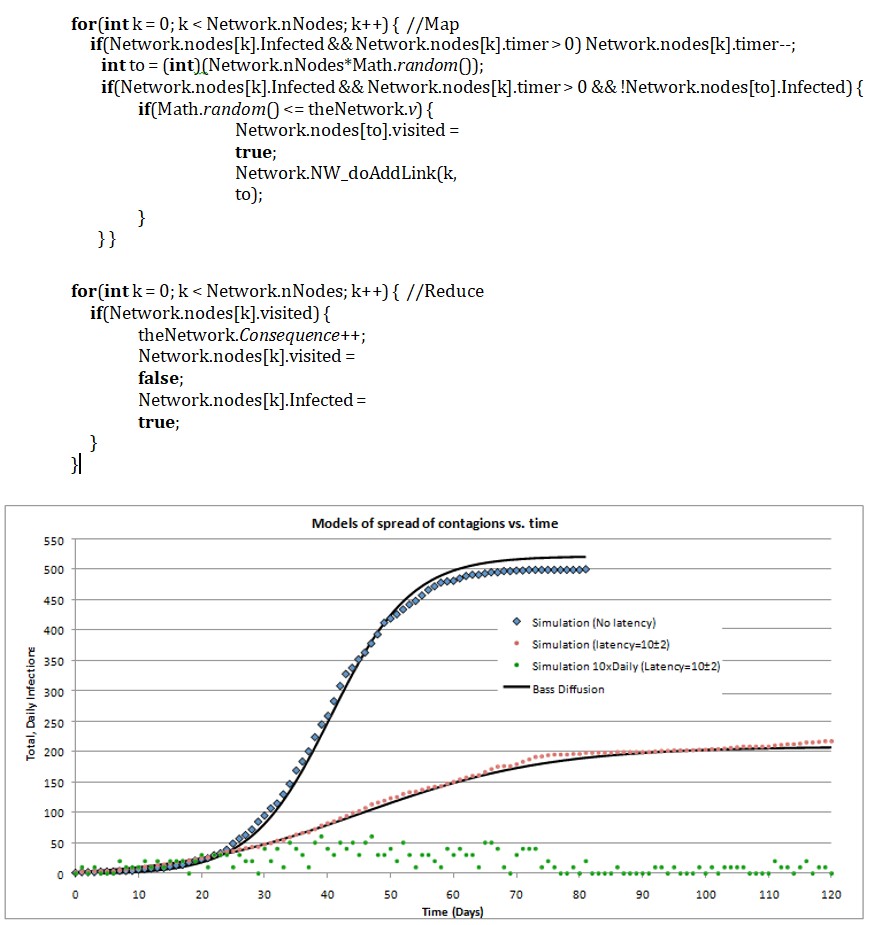
Figure 1: Simulation results for epidemics without latency and with latency shows how latency affects the size of an epidemic. Without latency, the contagion quickly saturates the population. With latency = 10±2, infecting actors are rendered non- infecting before the entire population is infected. The Bass diffusion model using OLS parameters is shown as an excellent macro-scale model of infection spreading regardless of latency or no-latency. It fits both models but with different parameters.
Simulations
Figure 1 illustrates the macro-scale spread of a contagion such as covid-19. The macro-scale behavior can be modeled with nearly any logistics curve and OLS fitting. The Bass model will do, nicely [6, 7, 8]. But micro-scale models lack detail of the contagion network’s structure. What is the pattern of infection spreading underlying diffusion? Is it emergent, meaning, does the contagion transform randomness into non- random structure, and what is the nature of the structure?. To answer these questions, the following simulations were performed. First, simulations were run for a population of n = 500 actors, with no latency, and for infection rate varying from 10% to 60%. The amount of self-organization, as indicated by spectral radius and fractal dimension of the long-tailed distributions, does not vary with infection rate. Only speed of spreading varies. See Figures 2a &2b.
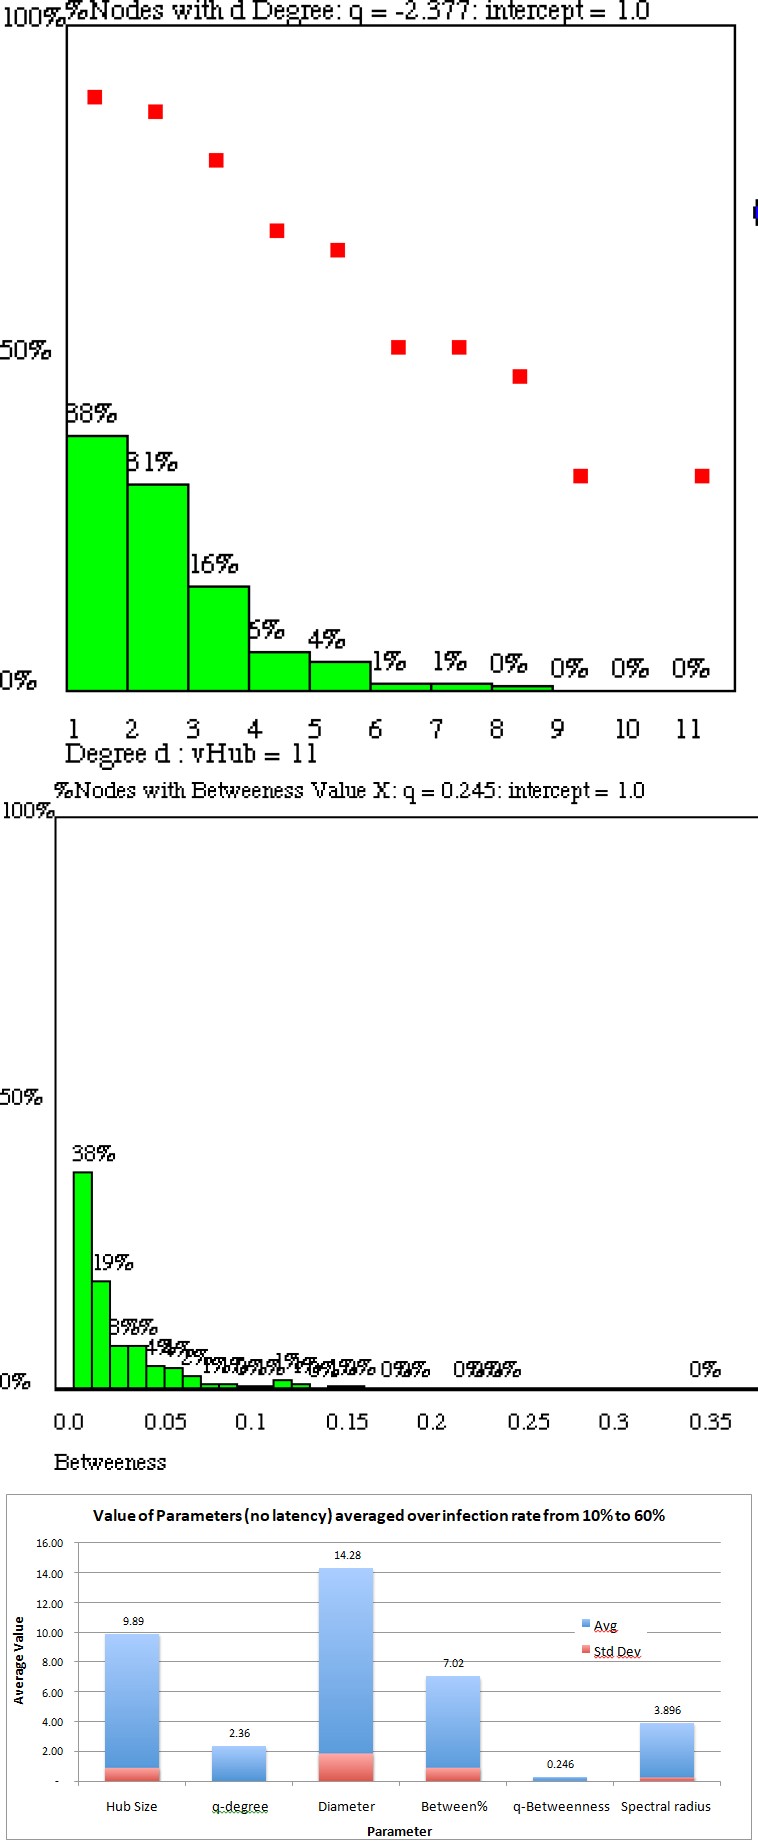
Figure 2a: Degree distribution. Figure 2b: Betweenness distribution.
Figures 2a&b: Results of simulated emergence of contagion network from n = 500 actors ad infection rates ranging from 10% to 60%. (a). Degree distribution with (red) log-log plot, and (b). Betweenness distribution. Note that both distributions are long tailed, indicating emergence of self-organization.
The average values of each parameter are shown in Figure 3. A “super-spreader hub” emerges with an average of 9.89 connections (infected actors). This is explained very simply as the effect of early infection – the first to be infected infects many other actors because it has more opportunities. The second infected actors have less time, third have even less time, etc. This, and the stochastic nature of infection, partially explains why scale-free structure emerges. The fractal dimensions, q-degree and q-Betweenness, indicate emergence of long-tailed or extreme values of node degree and betweenness, respectively. Starting from a flat distribution at the onset of the contagion, a long-tailed distribution emerges as high degree actors and high betweenness nodes become less frequent. A similar result was reported by Cirillo P, et al. [9]. A “perfect” scale-free network with n = 500, produced by the famous Barabasi-Albert algorithm produces a degree distribution with fractal dimension of approximately q-degree = 1.8, which is less than the q-degree of the simulated contagion networks studied here. This indicates that the simulated contagion networks are less bushy and more branchy, i.e., the degree distributions of contagion networks are shorter tailed. Finally, the larger the spectral radius and hub size is relative to the average degree, the more structure is present. In this study, the average degree is approximately 2.25, yielding a ratio of 9.89/2.25 and 3.896/2.25 for hub/average degree and spectral radius/average degree, respectively. This further indicates emergence of structure, although contagion networks are less structed than “perfect” scale-free networks.
Next, we turn to contagion networks with relatively small latencies (10 ±2) resulting in lower total infections and spreading determined by infection rate v = 50%, as shown in Figure
Next, we turn to contagion networks with relatively small latencies (10 ±2) resulting in lower total infections and spreading determined by infection rate v = 50%, as shown in Figure 1. The following conjectures are proposed as hypothesis: • Hub size and spectral radius increase with latency indicating increased structure. • Network diameter and average betweenness decrease with latency indicating the emergence of a branchy vs. bushy network. Branchy vs. bushy networks are defined as follows: “Bushy versus branchy networks are… defined as small diameter large spectral radius (bushy) versus large diameter small spectral radius (branchy)” [1]. The effect of this hypothesis is to suggest that the emergence of structure is modest.
Figure 4. Hypothesis A is confirmed by logarithmic increase in hub size and spectral radius. This is what one would expect from self-organization of a network’s node degrees. As latency increases and allows more time for links to form, hub size increases and degree distribution becomes longer tailed. Hypothesis B is confirmed by decrease of diameter-a measure of branchy topology-and decrease of betweenness- an indication of centralization or closeness of a handful of nodes. Betweenness distribution tends to obey a binomial distribution in a purely random network. Instead, contagion networks show self-organization around betweenness centrality by obeying a power law. However, q-betweenness is slightly larger for contagion networks than perfect scale- free networks, in line with the branchy tendency of the scale-free contagion networks. Not shown in Figure 4, but of some interest. Is the decline of entropy from 8.96 bits prior to emergence, to 2.18 bits when latency is 15±1, to 1.87 bits when latency is 5±1, further proof of emergence of structure from randomness.
Simulations were run on n = 500 actors with constant infection rate v = 50% to study the hypotheses, above, see
![Figure 3: A “super-spreader hub” emerges with an average of 9.89 connections (infected actors). This is explained very simply as the effect of early infection – the first to be infected infects many other actors because it has more opportunities. The second infected actors have less time, third have even less time, etc. This, and the stochastic nature of infection, partially explains why scale-free structure emerges. The fractal dimensions, q-degree and q-Betweenness, indicate emergence of long-tailed or extreme values of node degree and betweenness, respectively. Starting from a flat distribution at the onset of the contagion, a long-tailed distribution emerges as high degree actors and high betweenness nodes become less frequent. A similar result was reported by Cirillo P, et al. [9]. A “perfect” scale-free network with n = 500, produced by the famous Barabasi-Albert algorithm produces a degree distribution with fractal dimension of approximately q-degree = 1.8, which is less than the q-degree of the simulated contagion networks studied here. This indicates that the simulated contagion networks are less bushy and more branchy, i.e., the degree distributions of contagion networks are shorter tailed. Finally, the larger the spectral radius and hub size is relative to the average degree, the more structure is present. In this study, the average degree is approximately 2.25, yielding a ratio of 9.89/2.25 and 3.896/2.25 for hub/average degree and spectral radius/average degree, respectively. This further indicates emergence of structure, although contagion networks are less structed than “perfect” scale-free networks.](/fulltextimages/7819/fig_3.png)
Conclusion
At the macroscale level, epidemic spreading is a diffusion process similar to other diffusion processes in nature and commerce. At the micro-scale level, epidemic spreading is a self- organizing emergent process that transforms a random network into a scale-free contagion network. The evidence of this is two-fold:
- Spectral radius increases as a super-spreader hub emerges. The degree distribution obeys a mild power law with fractal dimension greater than 2 (it has a mean value but no variance).
- A mildly structured scale-free contagion network emerges that is branchy versus bushy, with betweenness that declines with increasing latency according to a power law.
Practitioners are encouraged to vigorously pursue contact tracing and testing as a countermeasure because the further one goes back in time to the origin of the contagion, the greater is the impact on eradicating a rapidly spreading contagion. Early detection and quarantine are a far more effective measure for preventing the emergence of a contagion network than belated detection and quarantine. Zipf’s law applies to early contact tracing. Because the contagion network is scale-free, 80% of the infections are cause by 20% of the nodes. By rapidly quarantining 20% of infected nodes, 80% of infections can be prevented.
References
-
Lewis TG, Mannai WI (2021) Predicting the Size and Duration of theCOVID-19 Pandemic. Front Appl Math Stat 6: 1-13.
-
Lewis TG, Mannai WI (2021) Modeling the Spread of COVID-19 Using a Novel Threat Surface. Cosmos+ Taxis 9(7): 41-50.
-
Gupta M (2020) Modeling Spread of Corona Virus using Adapted Bass Model.
-
Kermack WO, McKendrick G (1927) A contribution to the Mathematical Theory of Epidemics. Proceedings of the Royal Society A 115(772): 700-721.
-
Frank MB (1969) A new product growth for model consumer durables. Management Science 15(5): 215- 227.
-
Dennning PJ, Lewis TG (2020) Technology Adoption. Communications of the ACM 63(6): 27-29.
-
Calantone R, Lance G (2007) Forecasting Consumer Adoption of Technological Innovation: Choosing the Appropriate Diffusion Models for New Products and Services before Launch. Faculty Research & Creative Works 662: 1-11.
-
Lewis TG (2008) Network Science Theory and Applications, Wiley Online, pp: 264.
-
Cirillo P, Taleb NN (2020) Tail Risk of Contagious Diseases. Nature Physics 16: 606-613.
- Epidemiological Surveillance and Rumors on Social Media
- Awareness and Treatment of Uncontrolled Hypertension in US Overweight/Obese Youths Aged 16–24 Years, NHANES 2021–2023
- Strengthening EPI Through Parental Engagement: Lessons from Dhaka Slums for IA-2030
- Mothers Knowledge of the Prevalence, Causes, Effects, Prevention and Control of Diarrhoea among Children in Ife East Local Government Area, Ile Ife, Osun State, Nigeria
- Covid-19 Reinfections Case Series from October 2023 to October 2024 in A General Medicine Office in Toledo (Spain)
- Water Contact! One Risk Too Many: Risk Factors Associated with Schistosoma haematobium infection in Osun State, Nigeria