Mapping TB Case Notification Rate (CNR) by Province in Indonesia
Background: Tuberculosis (TB) is still one of main public health problems in Indonesia. To efficiently help communities prevent TB, health offices need to be able to target TB prevention and intervention in populations with high risk. Case notification rate (CNR) has been used to estimate TB prevalence in community. This study aims to map provincial-level TB CNR and social determinants using publicly available secondary data to identify Indonesia provinces with high risk of TB to be targeted for focused TB prevention and interventions. Methods: Provincial-level TB CNR and its determinants such as poverty level, the percent of children having complete immunization, percent of village with Universal Child Immunization (UCI), population density, ratio of primary health care per subdistrict were collected using publicly available secondary data. GIS map were created to highlight areas with high risk of TB using ArcGIS. Statistical analysis was also performed using spearman correlation to confirm GIS findings. Results: The study indicated that there was variation of TB CNR across provinces in Indonesia that is correlated with percent of completed childhood vaccination, ratio primary healthcare per 100,000 population and percent of village with universal child immunization. Conclusion: Utilizing publicly available secondary data and GIS tools, the study identified variation of TB CNR at the provincial level in Indonesia for targeted TB prevention programs.
Introduction
Globally, Indonesia has the second highest number of TB prevalence after India. It is estimated that 10 million people diagnosed with TB in 2019. Although, there was a slight decrease of number newly diagnosed TB, but it is not enough decrease to reach the target of END TB in 2020, that is lowering TB cases by 20% in 2015 – 2020. In this period, the cumulative number of TB cases decreased only by 9% [1]. There are many risk factors related to TB infection including poverty. The correlation between poverty and tuberculosis have been studied for decades [2, 3]. Other risk factors known to be linked with TB include incomplete childhood vaccination especially not having the Bacille Calmette–Guérin (BCG) vaccine, overcrowding, poor housing condition, high population density, and access to healthcare [4, 5, 6]. Identifying and monitoring the risk factors is crucial to prevent TB infection. The main indicator to monitor TB is the incidence rate, the number of newly diagnosed TB cases per 100,000 population per year as set as one of target Sustainable Development Goals (SDGs) [7]. However, TB incidence rate is difficult to be measured directly from routine surveillance data [8]. Alternatively, to monitor TB, prevalence rate can be used. When recent TB prevalence rate is not available, a proxy can be utilized to estimate TB incidence that is case notification rate (CNR). It is calculated by the total number of individuals diagnosed with TB and notified by health authorities per 100,000 populations [8].
With limited public health budget, it is important to plan and allocate resources efficiently to accurately target programs in reducing TB infection. However, collecting primary data may increase the health expenses. Alternatively, with the increased availability secondary data that is publicly accessible will allow local and public health offices [9, 10] to target TB prevention programming. This study examines one such method that was performed using provincial-level Indonesian data joined with Geographic Information Systems (GIS). The method has been used in several studies to inform local public health efforts [11, 12, 13]. The aim of this study was to integrate, map and analyse a variety of publicly available public health data to inform local TB prevention programs.
Methods
Design and Study Area
This study used a retrospective observational design to analyse TB Case Notification Rate (CNR) in Indonesia, by province using 2020 data. The study covered all the 34 provinces in Indonesia.
Data Sources
TB CNR data were retrieved at the provincial level from the Indonesian Heath Profile 2020 [14]. Other determinant variables were also retrieved at the provincial level from the Indonesian Heath Profile 2020 including percent of completed childhood vaccination, percent of villages have Universal Child Immunization (UCI), population density (population per square kilometre), ratio of primary health care per subdistrict, and percent of poor housing condition [14]. While data of percent population living in poverty were accessed from the National Bureau of Statistics [15].
Developing Study Maps
Study maps were created using ArcGIS version 10.8. A shapefile for Indonesia containing province boundaries was imported from Indonesian Geospasial website [16]. The province map was then joined to the province attribute dataset using province code which is unique for each province within the country. Choropleth maps were created by overlaying the TB CNR with other determinants. The layer of TB CNR was processed into a graduated colour map, as a base map classified into 5 classes using natural breaks (Jenk). The other determinants were classified as follows:
- Population density is classified into 2 classes based on natural breaks (Jenk).
- The ratio of primary health care in each sub district is divided into 2 classes: <1 and ≥ 1, based on the Regulation of the Minister of Health of the Republic of Indonesia Number 43 of 2019 [17].
- The percentage of villages have Universal Child Immunization (UCI), is classified into 2 classes <100% and ³100% based on the Indonesia’s National Medium- Term Development Plan 2020-2024 [18].
- The percentage of completed childhood immunization is divided into 2 classes: <90% and ≥ 90%, based on WHO targets in the Global Vaccine Action Plan 2011-2020 [19].
- The percentage of population living below poverty level is divided into 2 classes: ≤ 7 % and > 7%, based on the Indonesia’s National Medium-Term Development Plan 2020-2024 [18].
- The percentage of poor housing is divided into 2 classes ≤30% and >30% based on the Indonesia’s National Medium-Term Development Plan 2020-2024 [18].
This class division can facilitate the visualizing the maps, and can be used to assess program achievements. The maps were examined visually to identify high TB CNR and high- risk factor provinces.
Statistical Analyses
Following the visual analysis, the study also performed Spearman correlation, as data was not normally distributed, to examine the correlation between TB CNR and its determinant at the provincial level to confirm the GIS findings. The alpha level was set at 5% for two-sided hypothesis. Statistical analyses were conducted using SPSS v. 22.
Results
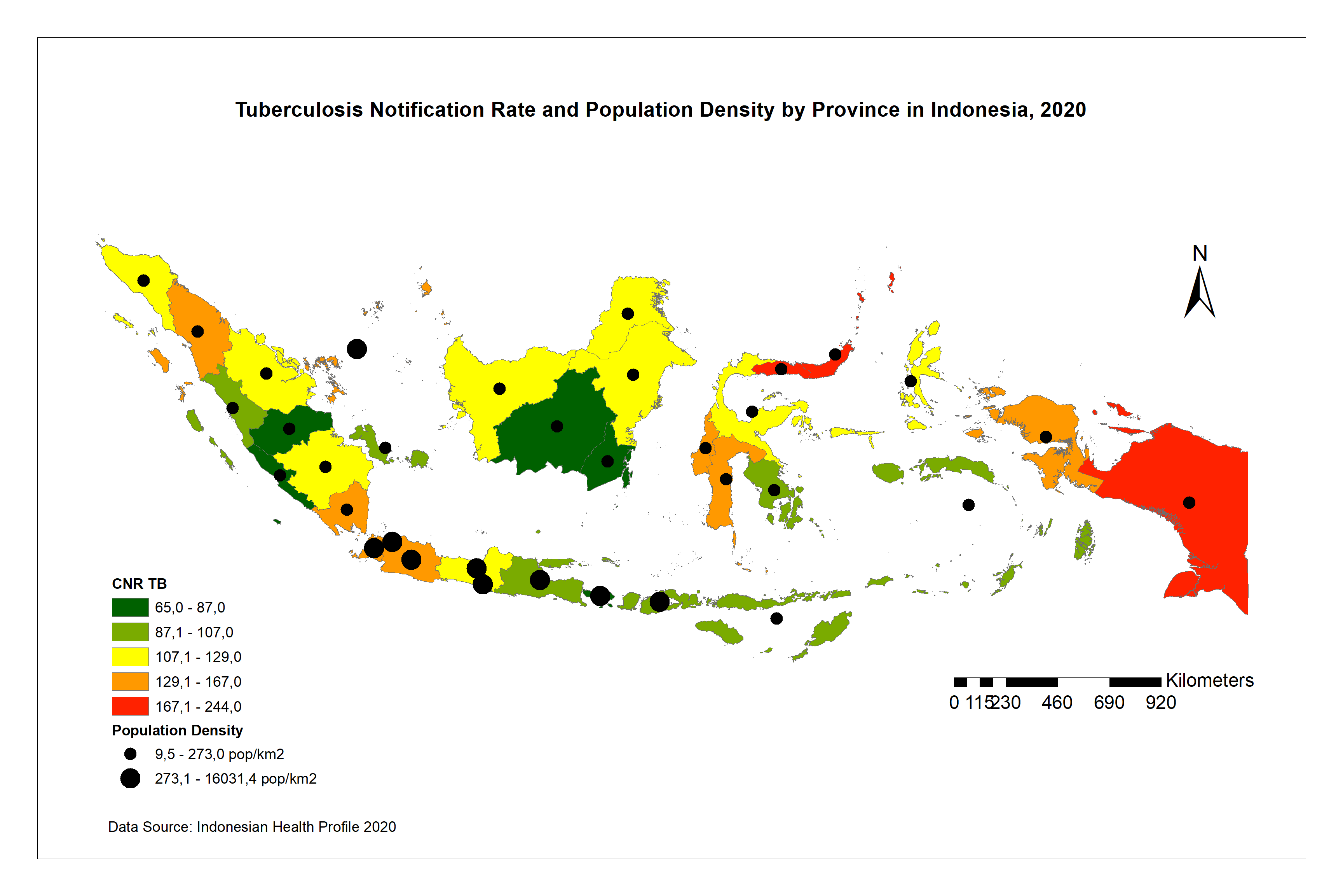
In this study, we found TB CNR ranging between 65 to 244 per 100,000 populations in all 34 provinces, with mean of 124.7 per 100,000 populations. The highest TB CNR was found in Papua province, and the lowest was in Bali province. Figure 1 shows the red zones for TB CNR in Indonesia including DKI Jakarta, Gorontalo, North Sulawesi, and Papua. When examining the TB CNR against population density (Figure 1), DKI Jakarta has high population density, while Gorontalo, North Sulawesi, and Papua have low population density even though they are categorized in the red zones.
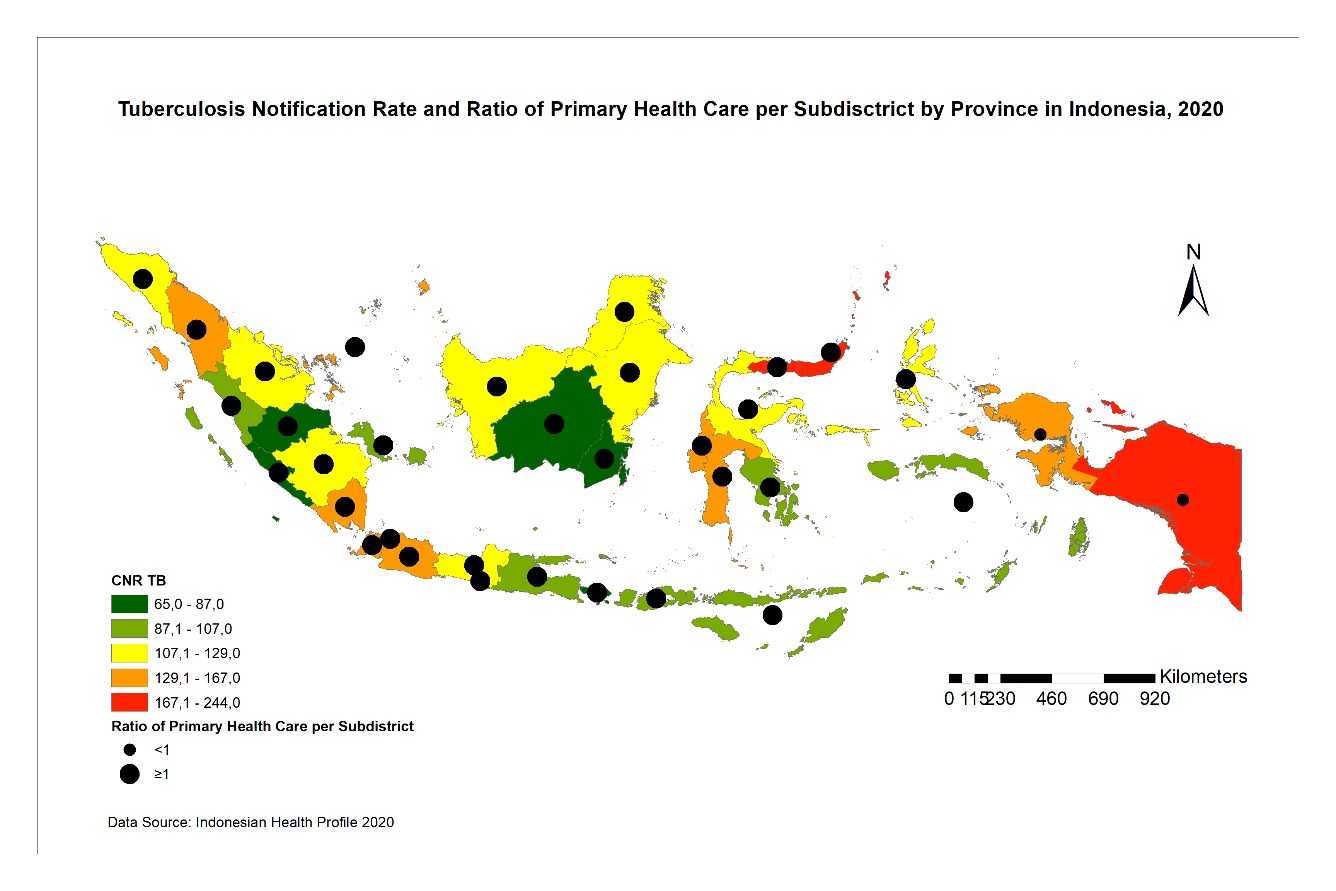
Based on the ratio primary health care per subdistrict and TB CNR, Figure 2 shows that DKI Jakarta, Gorontalo, and North Sulawesi have high ratio primary health care per subdistrict, and also have high TB CNR. On the other hand, Papua has low ratio with high TB CNR.
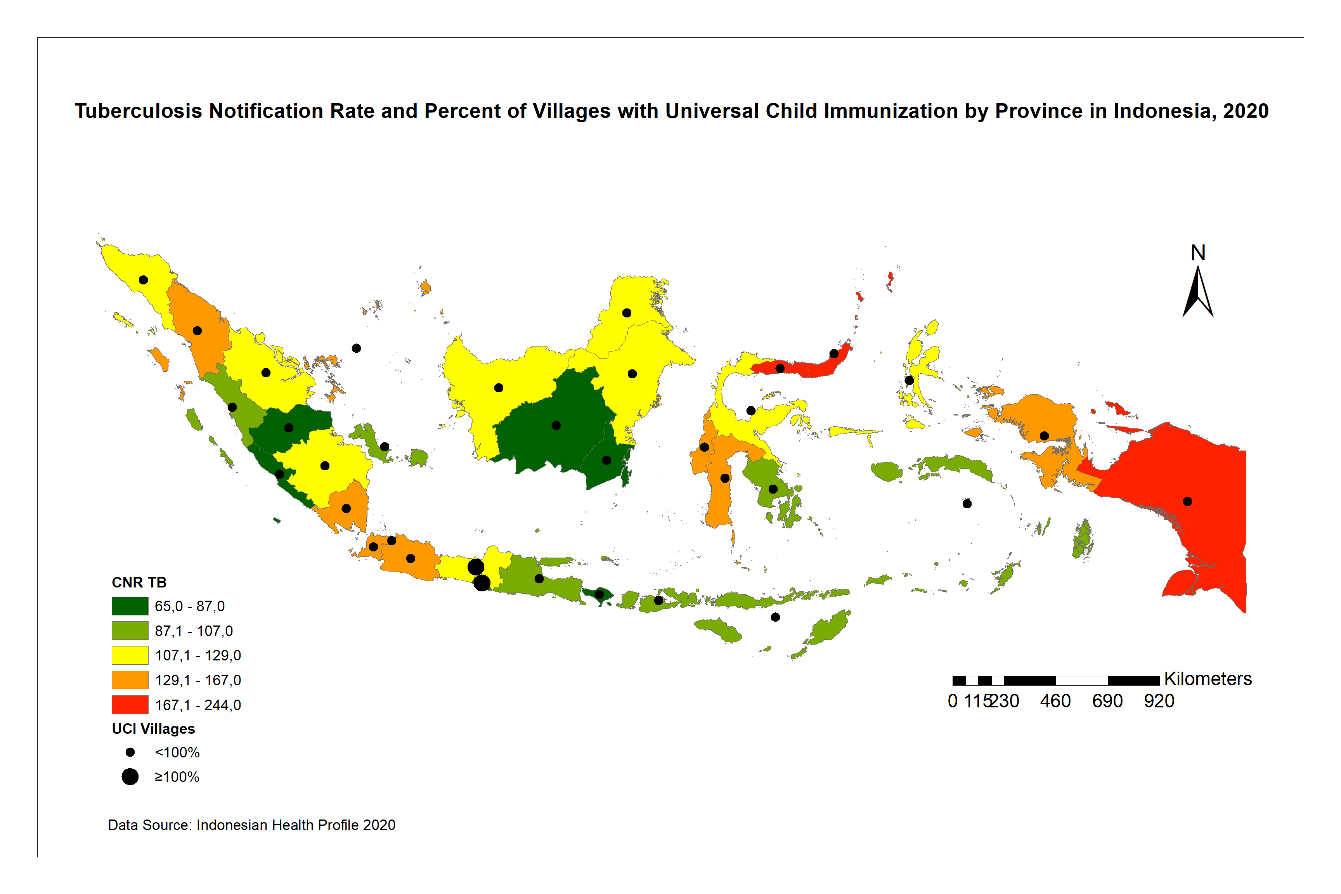
When examining TB CNR overlaid by percent of villages with Universal Child Immunization (UCI), there again appeared the association between rates and the percent village with UCI (Figure 3). All red zone provinces did not meet the UCI target, only Central Java and Yogyakarta had 100% UCI.
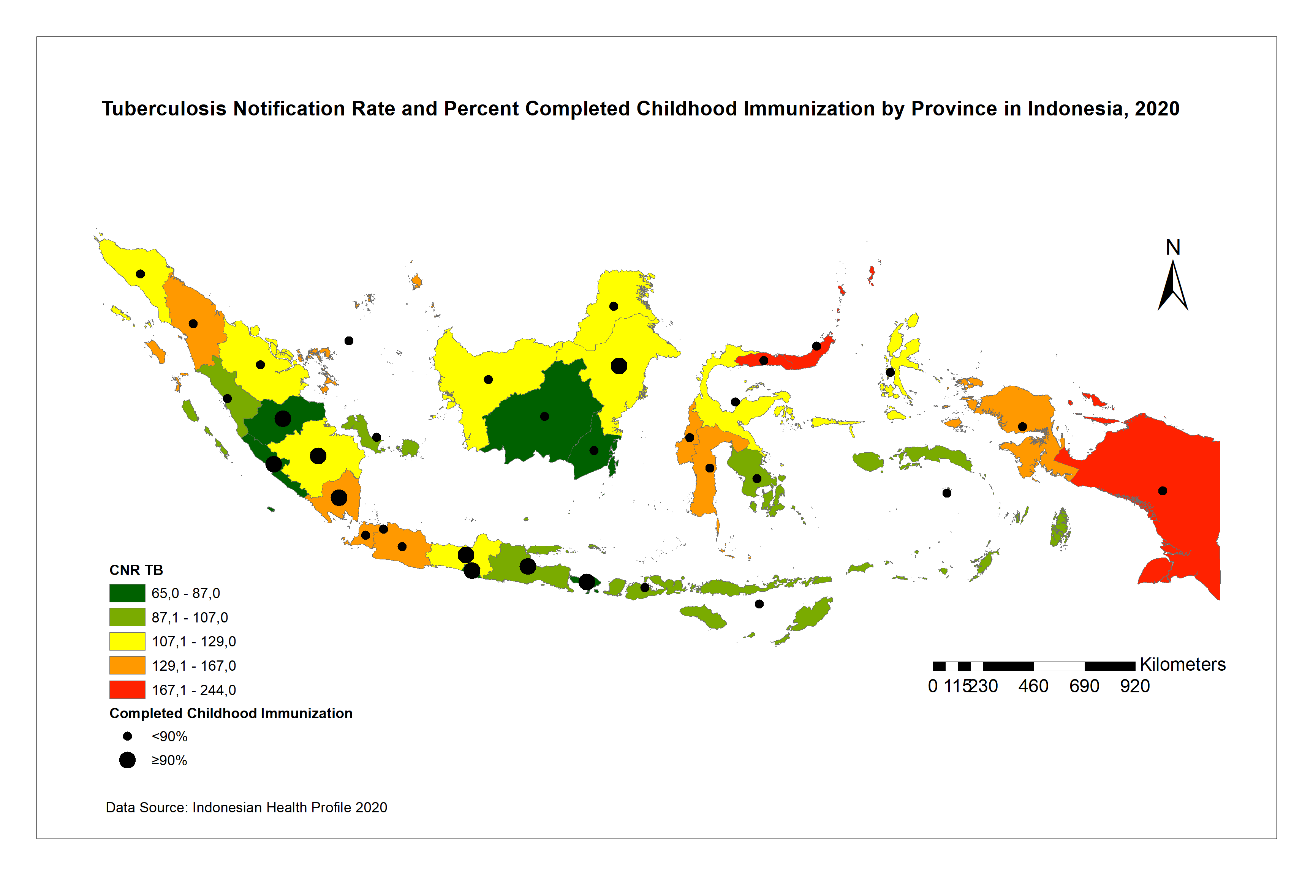
When completed childhood vaccination was examined against TB CNR, there appeared to be a relationship between the rate and the percent of completed vaccination among children (Figure 4). All red zone provinces failed to achieve the national percentage completed childhood vaccination target.
Similarly, when looking at poverty level, Gorontalo, North Sulawesi, and Papua have high poverty rates, while DKI Jakarta has low poverty rates, all are in red zone TB CNR (Figure 5).
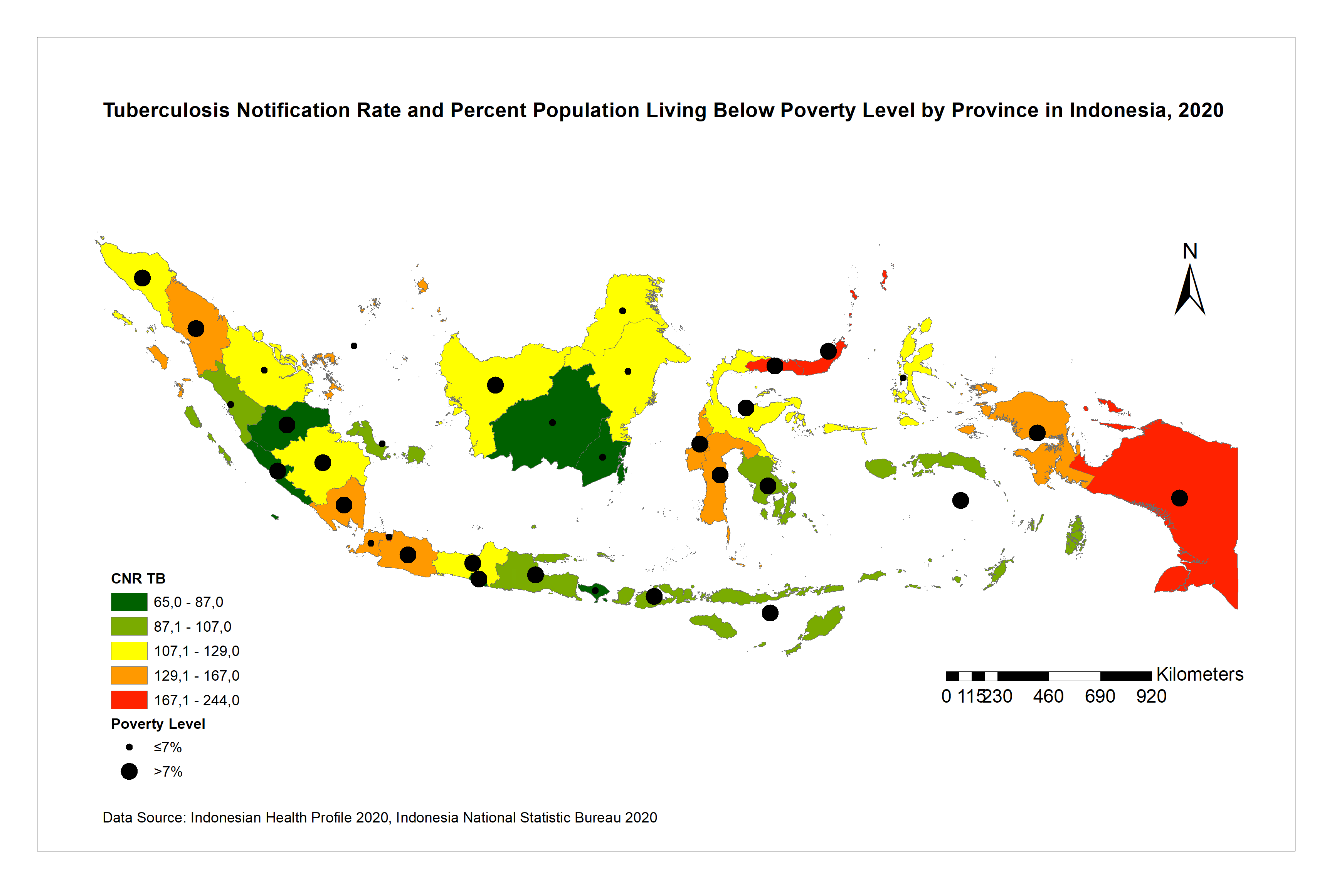
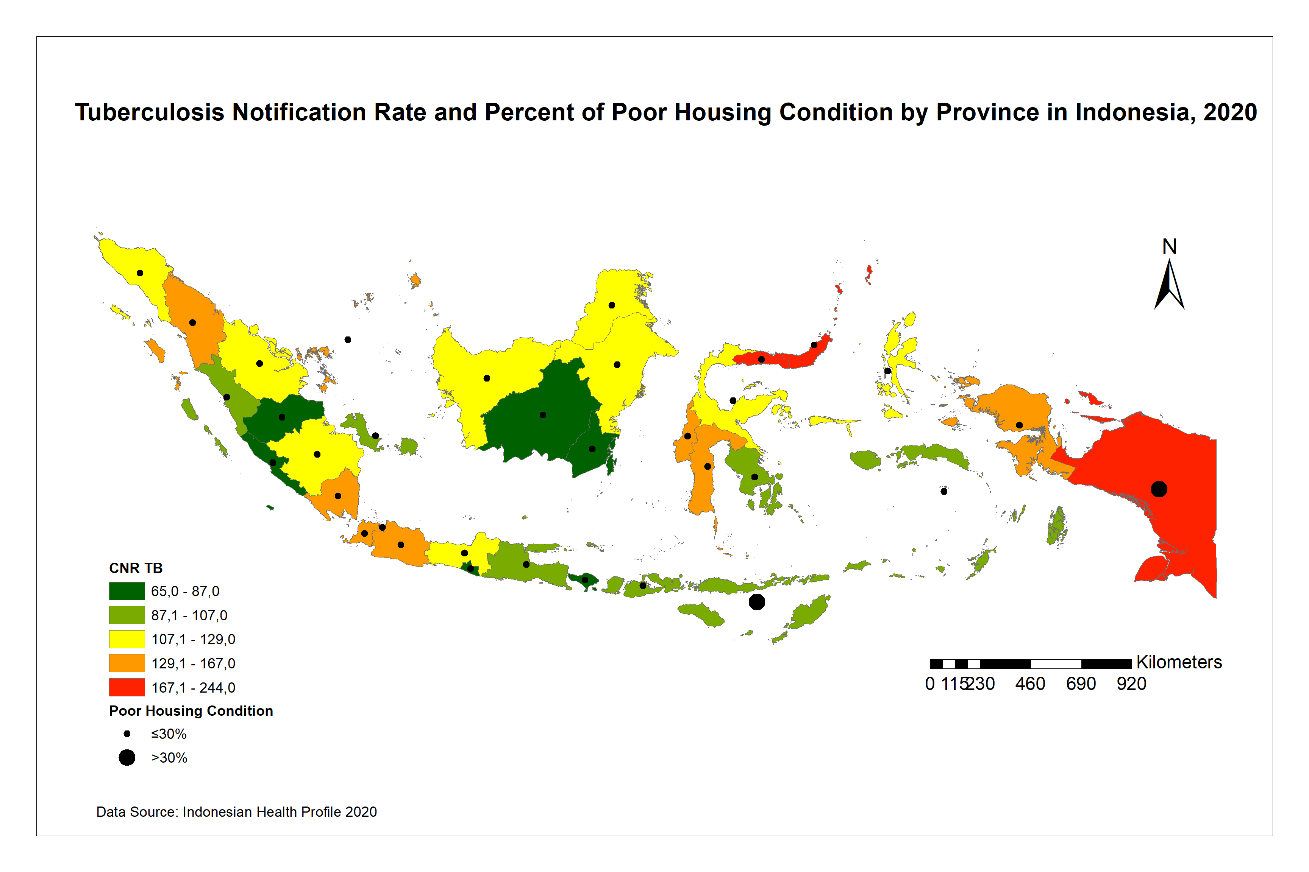
Figure 6 shows that TB CNR and percent of poor housing condition by province. It indicates that only Papua province has high TB CNR and also has high percentage of slum households.
To examine the correlation between all determinants with TB CNR at the provincial level, spearman correlation was used as data were not normally distributed with p-value < 0.05. The spearman correlation test (Table 1) shows a significant negative correlation between ratio primary healthcare services per subdistrict with TB CNR with rs (34) = -0.37, p = 0.02, indicating the higher ratio of primary healthcare service in each subdistrict, the lower TB CNR which indicates lower TB prevalence in the province.
Similarly, the higher number of villages with universal childhood immunization, the lower TB CNR with rs (34) = -0.42, p = 0.01. It is corresponding with the percent of children having complete vaccination. The higher the vaccination coverage, the lower TB CNR with rs (34) = -0.38, p = 0.02. While population density and percent population living below poverty level do not correlate significantly with TB CNR.
| Correlation all determinant with TB CNR | n | r* s | p-value |
|---|---|---|---|
| Population density per km2 | 34 | 0.07 | 0.67 |
| Ratio primary healthcare per subdistrict | 34 | -0.37 | 0.02** |
| Village with universal childhood immunization (UCI) | 34 | -0.42 | 0.01** |
| Completed childhood immunization coverage | 34 | -0.38 | 0.02** |
| Percent population below poverty level | 34 | 0.11 | 0.53 |
| Percent of poor housing condition | 34 | 0.33 | 0.05 |
Table 1: Correlation all determinant with TB CNR.
*Spearman correlation; ** correlation is significant at the 0.05 level (2-tailed) Table 1: Correlation all determinant with TB CNR.
Discussion
In this study, we found TB CNR varied across the region in Indonesia. The study indicates the negative correlation between childhood vaccination coverage, percent of villages with universal child immunization, and primary health care ratio against TB CNR in Indonesia at the provincial level. The primary healthcare ratio is inversely associated with TB CNR which may be explained that provinces with low number of primary healthcare facilities per subdistrict (such as Papua and Papua Barat), the ratio is likely to be low. Likewise, in highly urbanized area (i.e., DKI Jakarta and Bali) the health facility ratio can be high due to the number population served that require more facilities within a subdistrict. This is consistent with the study conducted by van Gurp M, et al. [20] showing the inverse association between health facility density and vaccination coverage with TB CNR in Nepal [20]. Provinces with adequate number of primary healthcare services indicates better access to healthcare in the area [17] which may increase TB case detection rate, resulted in increasing TB CNR. A study shows the availability of healthcare services and easy geographical access had influence on TB management [21]. The ratio of primary healthcare services per subdistrict has an important role in reducing TB in Indonesia. This is presumably because the higher number of the health facilities, the higher the opportunity for the community to meet healthcare workers and receive health education.
Vaccination among children aims to reduce the incident of infectious diseases especially vaccination preventable diseases including TB [22]. Completed childhood basic immunization in Indonesia includes the provision of BCG vaccine, therefore, with the increasing childhood vaccination coverage, BCG coverage will be more likely to increase. This is corresponding with the parameter of villages with universal childhood immunization, which depicted a village where 80% of the number of babies have received complete basic immunization. Having a greater number of villages achieve the UCI target, it is expected herd immunity TB can be formed.
The study’s findings suggest that there was no significant correlation between poverty level and population density with TB CNR. This finding is not consistent with the study conducted by van Gurp M, et al. [20] that indicated the population density has positive association with TB CNR in Bangladesh, Nepal and Pakistan. This could be explained that low TB CNR may be related to geographical access for TB diagnosis and treatment and lack of awareness about TB [5] that may not correspond with population density and poverty level. In addition, Indonesia has universal health coverage that covers 222.46 million population in 2020, which is 81% of Indonesian total population [23]. TB prevention and treatment is fully covered by the universal health coverage which can increase access for healthcare among poor and disadvantage population.
The study has several limitations including that the study did not combine both information TB burden and TB prevention program in interpreting TB notification rate. Additionally, the result of this study may not be consistent with the existing studies using data at individual level due to modifiable areal unit problem (MAUP), meaning data aggregated for different spatial scale levels will not provide consistent analysis results. Finally, the study also did not include other variables that may contribute to the TB notification rate such as level of parents’ education, number of siblings in the family, sex of the children, and mother’s vaccination.
Conclusion
It can be concluded that this study found the overall TB CNR by province in Indonesia was high-the highest in Papua, indicating a disparity of TB notification rate by province across the region. Furthermore, this study identified that vaccination coverage and health facilities are associated with TB notification rate. This study suggests that expanding access for healthcare services and increase the immunization coverage may lower TB CNR in Indonesia.
References
-
(2020) Global tuberculosis report 2020. World Health Organization.
-
Grange J, Zumla A (1999) Tuberculosis and the poverty- disease cycle. J R Soc Med 92(3): 105-107.
-
Grange J, Story A, Zumla A (2001) Tuberculosis in disadvantaged groups. Curr Opin Pulm Med 7(3): 160- 164.
-
Narasimhan P, Wood J, MacIntyre CR, Mathai D (2013) Risk Factors for Tuberculosis. Pulmonary Medicine 2013: 1-12.
-
Wong MK, Yadav RP, Nishikiori N, Eang MT (2013) The association between household poverty rates and tuberculosis case notification rates in Cambodia, 2010. Western Pac Surveill Response J 4(1): 25-33.
-
Hill PC, Sillah DJ, Donkor SA, Otu J, Adegbola RA, et al. (2006) Risk factors for pulmonary tuberculosis: a clinic- based case control study in The Gambia. BMC Public Health 6: 156.
-
(2021) SDG indicator metadata. United Nations.
-
Glaziou P, Sismanidis C, Zignol M, Floyd K (2020) Methods used by WHO to estimate the global burden of TB disease. WHO.
-
Hollar DW (2009) Progress along developmental tracks for electronic health records implementation in the United States. Health Res Policy Syst 7: 3.
-
Bradley CJ, Penberthy L, Devers KJ, Holden DJ (2010) Health services research and data linkages: issues, methods, and directions for the future. Health Serv Res 45(5pt2): 1468-1488.
-
Umer MF, Zofeen S, Hu W, Qi X, Zhuang G (2020) Spatiotemporal clustering analysis of Expanded Program on Immunization (EPI) vaccination coverage in Pakistan. Scientific Reports 10(1): 10980.
-
Nurjannah N, Baker KM (2020) Using GIS and death records to inform statewide school-based diabetes prevention interventions in Michigan. J Public Health Res 9(4): 1887.
-
Agegnehu CD, Alem AZ (2021) Exploring spatial variation in BCG vaccination among children 0-35 months in Ethiopia: spatial analysis of Ethiopian Demographic and Health Survey 2016. BMJ open 11(4): e043565.
-
(2020) Indonesian health profile, 2020. Indonesian Ministry of Health.
-
(2020) District/City Poverty Data and Information in 2020. Central Bureau of Statistics.
-
Indonesian Geospasial Website (2020) Peta Wilayah.
-
Indonesian Ministry of Health (2020) Menteri Kesehatan Republik Indonesia. Peraturan Menteri Kesehatan Republik Indonesia Nomor 43 Tahun 2019.
-
National Development Planning Agency (2020) Indonesia’s National Medium-Term Development Plan 2020-2024.
-
(2019) Global Vaccine Action Plan and Decade of Vaccines Review and lessons learned reports. World Health Organization.
-
van Gurp M, Rood E, Fatima R, Joshi P, Verma SC, et al. (2020) Finding gaps in TB notifications: spatial analysis of geographical patterns of TB notifications, associations with TB program efforts and social determinants of TB risk in Bangladesh, Nepal and Pakistan. BMC Infectious Diseases 20: 490.
-
Asalde CB, Rivera Lozada IC, Lozada OR (2020) Barriers to Accessing Health Services and their association with treatment adherence in tuberculosis patients at a hospital in Peru. Pak J Med Health Sci 14(3): 1296-1304.
-
Whitney CG, Zhou F, Singleton J, Schuchat A (2014) Benefits from immunization during the vaccines for children program era-United States, 1994-2013. Morb Mortal Wkly Rep 63(16): 352-355.
-
(2020) The Number of BPJS Health Participants Reaches 222.5 Million People by 2020. Katadata.
- Epidemiological Surveillance and Rumors on Social Media
- Awareness and Treatment of Uncontrolled Hypertension in US Overweight/Obese Youths Aged 16–24 Years, NHANES 2021–2023
- Strengthening EPI Through Parental Engagement: Lessons from Dhaka Slums for IA-2030
- Mothers Knowledge of the Prevalence, Causes, Effects, Prevention and Control of Diarrhoea among Children in Ife East Local Government Area, Ile Ife, Osun State, Nigeria
- Covid-19 Reinfections Case Series from October 2023 to October 2024 in A General Medicine Office in Toledo (Spain)
- Water Contact! One Risk Too Many: Risk Factors Associated with Schistosoma haematobium infection in Osun State, Nigeria