Effect of Climate and Weather on the Spread of Covid-19 in the United States Areas of Major and Less Spread
Objective: This research article seeks to know the influence of the spread of the COVID-19 virus through temperature and humidity in the USA. Methods: To calculate the monthly variation of the COVID-19 virus spread index by states with the 1979-2019 climate series of the National Oceanic and Atmospheric Administration of the United States Department of Commerce. The corresponding means have been extracted and then the data have been subjected to a homogenization process, to later be able to calculate the monthly increase in temperature and humidity by provinces and states. This methodological process establishes a directly proportional relationship between the increase in temperature and humidity and the rate of spread of the COVID-19 virus. Results: We understand, based on the data collected, that the spread of the virus in climatic zones between latitude 30-50º continues to be the common growing factor since the pandemic began between the months of October and March. In the USA, the climatic conditions will favor the decrease or increase of the reproductive index of the virus. Conclusion: Climate influences the spread of the virus.
Introduction
The COVID-19 disease was made public for the first time in December 2019 in the Chinese city of Wuhan [1], a town that was confined when the outbreak turned into an epidemic [2, 3]. On March 11, 2020, the World Health Organization declared the COVID-19 outbreak a global pandemic [4, 5]. Currently, the virus is or has been found in all countries of the world, although with the advent of vaccines, its spread has been sustained. However, the different mutations [6] are causing a real headache for the authorities of the affected states. The inoculation process is accelerating, mainly in the states with the highest gross domestic product (GDP), lagging behind the countries with the lowest economic resources or unsustainable policies as directed by the World Health Organization.
In this article we carry out a scientific study on the influence of the spread of the COVID-19 virus through climatic conditions in Spain and Brazil. A cool and dry environment is the most suitable for the spread of SARS- CoV-2. In addition, climatic conditions condition social behaviors [7] and they mark the transmission of the disease. This research article seeks to know the influence of the spread of the COVID-19 virus through temperature and humidity in the United States of America, according to data from the averages of temperature and relative humidity by states of the climatic series 1979- 2019 from the National Oceanic and Atmospheric Administration of the United States Department of Commerce [8, 9].
Considering the large geographical area of the object of study, a land area of 9,147 km2 and the differentiation of the multiple climatic zones of the country, it is an arduous and extensive work where we have worked meticulously on a scale that allows us to have visible results. In addition, we have collected information from different sources and we have applied our own mathematical expression, which allows the information to be digitized by province to later be mapped. In this way, we locate the areas with the highest incidence of spread due to climatic factors.
From these variables we have created a mathematical expression to see the degree of spread depending on the climate that exists in the United States of America through state demarcations and to know which are the areas of lower risk, exclusively according to climatic factors. With the ensemble of the documentation acquired and processed, both its own and that of the documentary source, a series of maps have been generated for each of the months of the year representing the increase in the reproductive index as a function of climatic factors.
Methods
To calculate the monthly variation of R (basic number of reproduction of an infection) by provinces in Spain, the climatic series 1979-2019 of the National Oceanic and Atmospheric Administration of the Department of Commerce of the States have been used. United [8, 9]. The corresponding averages of temperature and humidity have been extracted, and then the data have been subjected to a homogenization process, to later be able to calculate the monthly increase in temperature and humidity by provinces and states. The contrasted data provided by Chinese studies [10] are of capital importance for this methodological process, since they establish a directly proportional relationship between the increase in temperature and humidity with the R number. Prior to the data digitization process with desktop GIS software, the following mathematical expression of our own elaboration is applied to the previously treated series provided by NOAA [8, 9]:
( ) ( ) ( ) ( ) ( ) ( ) 1 1 R HRm HRm hr Tm Tm t ω ω ∆ = − − × + − − × Where: ∆R is the increment of the number R; HRm is the monthly mean humidity of “m” month; HRm-1 is the monthly average humidity of “m” month minus 1, that is, of the previous month; Tm is the mean monthly temperature of “m” month; Tm-1 is the average monthly temperature of “m” month minus 1, that is, of the previous month; ω (hr) is the increase in R relative to humidity [10]; ω (t) is the increase in R relative to temperature [10, 11].
Finally, having obtained the increase in the R number by provinces using the previous formula, the data obtained is exported to a database, which will be linked by desktop GIS software to a polygonal layer “.shp” containing the Spanish provinces. This provincial layer is obtained by NOAA [12]. Finally, the resulting maps are processed and layout. The temperature averages, previously mentioned, come from reliable climatic series (T = 30 years), and have been obtained from NOAA observatories [13].
Climate in the United States of America
The enormous geographic extension of the United States, the climate varies from region to region, predominating temperate, tropical and even monsoon temperatures in Florida, arctic in Alaska, semi-arid in the area of the great plains and the west of the Mississippi River, arid in the large basins in the Southwest, and moderate winters in the Northwest. Most states enjoy all four seasons. Temperatures vary from temperate to tropical, depending on the proximity of the coast, the altitude and the time of year.
In the United States we can find examples from almost every climate in the world. Most of the territory has temperate climates, but there are many exceptions that range from the arctic of Alaska to the tropical of Hawaii. Below we review the different types that can be found: • Arctic tundra climate. It is found only in northern Alaska.
• Climate of boreal forests. We find it throughout central Alaska, modified by the mountainous terrain of the region.
• Humid continental climate. It exists east of the Mississippi River and the Appalachian Mountains. It is also found west of the Rockies, but it is highly distorted.
• Dry climate of middle latitudes. It occurs in the central United States, east of the Mississippi River, and in many of the depressions of the Rockies.
• Oceanic climate. It is confined to a narrow strip of the Pacific coast, from northern California to the Canadian border, and to the coast of Alaska.
• Mediterranean climate. We find it in a very narrow geographic space on the west coast, in central and southern California. Both east and ocean are underdeveloped due to the immediate presence of the Rocky Mountains as they enter inland.
• Humid subtropical climate. It is found throughout the southeastern United States, from the southern half of the east coast to almost the border with Mexico, along much of the Gulf of Mexico, and moving well into the interior through the south of the central plains.
• Dry subtropical climate. It is offered in the vicinity of the deserts of the southern United States, more specifically in the states of Texas, New Mexico, Arizona and California.
• Dry tropical climate. Located in very specific places, in the deep valleys of the southern Rockies and downwind from the westerly winds.
• Monsoon weather. It is found in the southern tip of Florida but is very poorly represented.
• Tropical climate. On the island of Hawaii.
Given the variety of climates available in the North American country, applying the reproductive index to the averages of relative humidity and temperature, a very reliable mapping is created at an average scale of the greater or lesser spread of the virus in each of the states included in the study (we omitted Hawaï in the study due to having a very homogeneous climate throughout the year).
Results
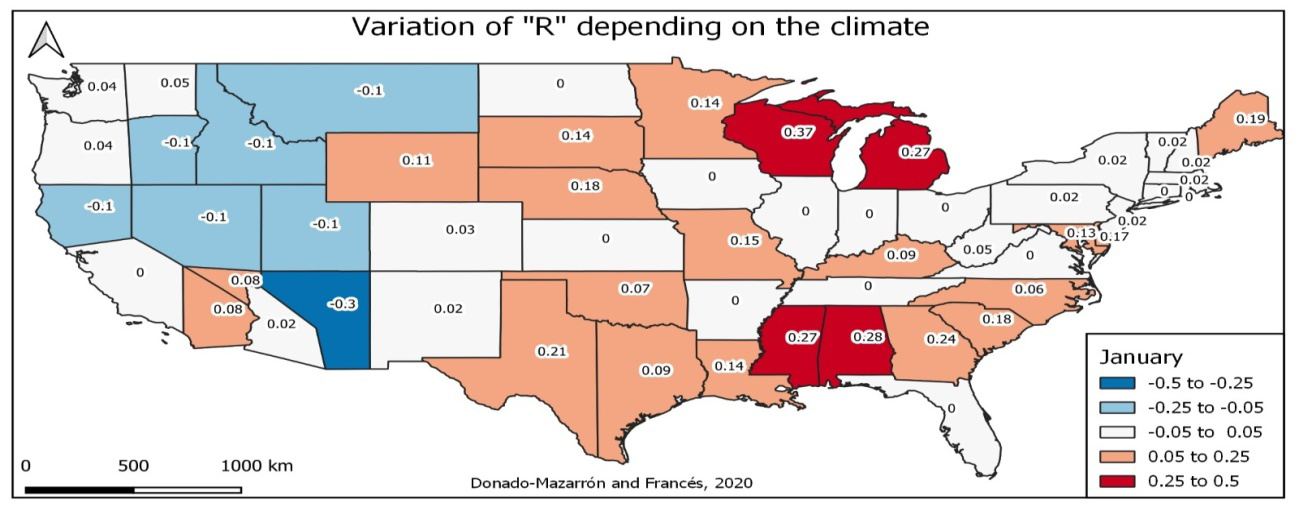
The data collected on averages of temperature and relative humidity from the NOAA 1979-2019 series come mainly from stations located in peri-urban areas, so these data applied to the propagation index contribute, as has already been done. Indicated above, an added value to the reliability of the study. We use the 1979-2019 climate series January because long quality climate records form the basis for climate research [13]. The preparation of homogeneous climatic data with a long time course and proven quality is, therefore, an essential preliminary step for carrying out any climatic study. Therefore, it is necessary to attend to climatic series to relate the spread of the COVID-19 virus according to climatic conditions. In the cartographic series, by months, the evolution of the variation of the R index as a function of the climate over the United States is observed and interpreted.
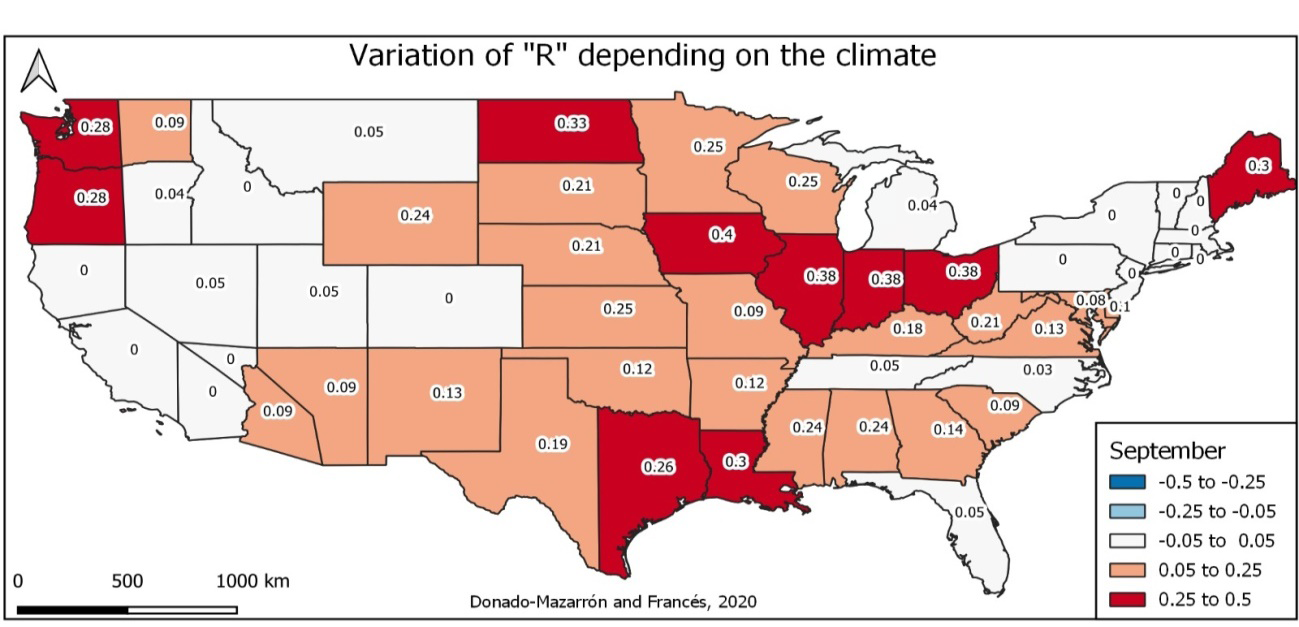
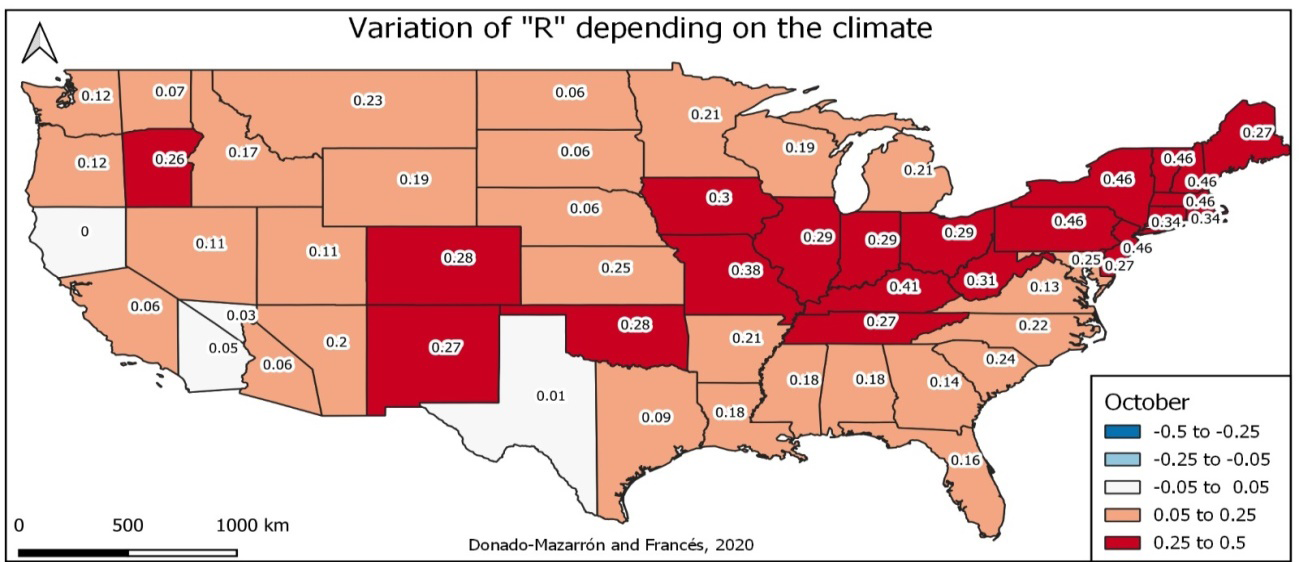
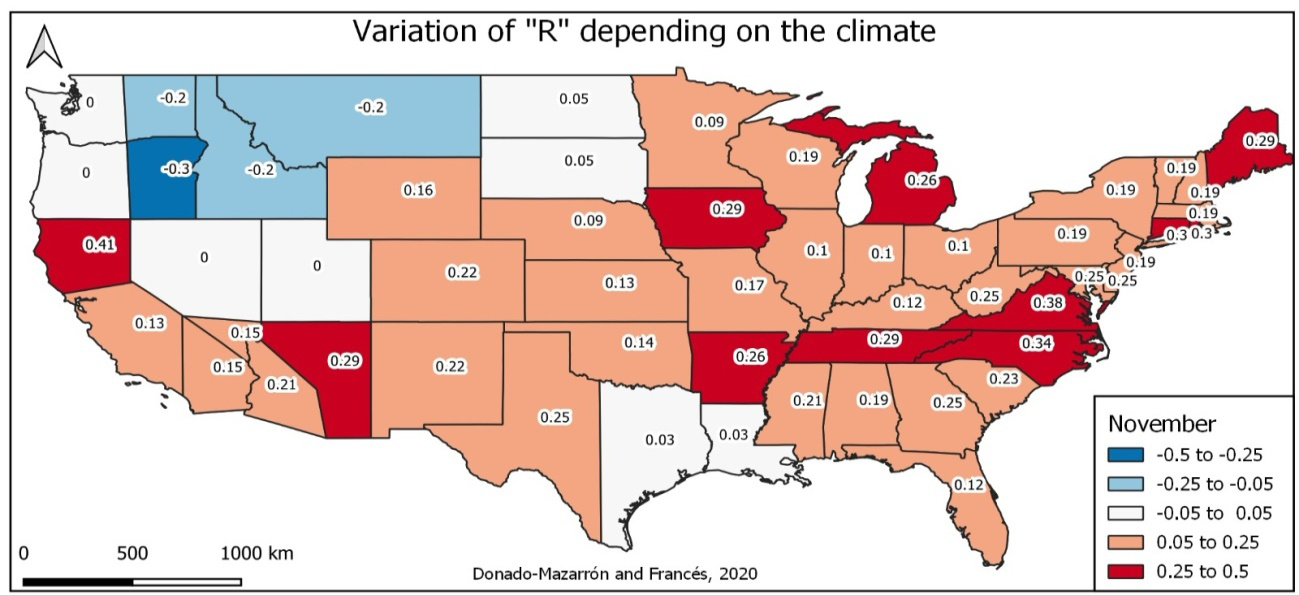
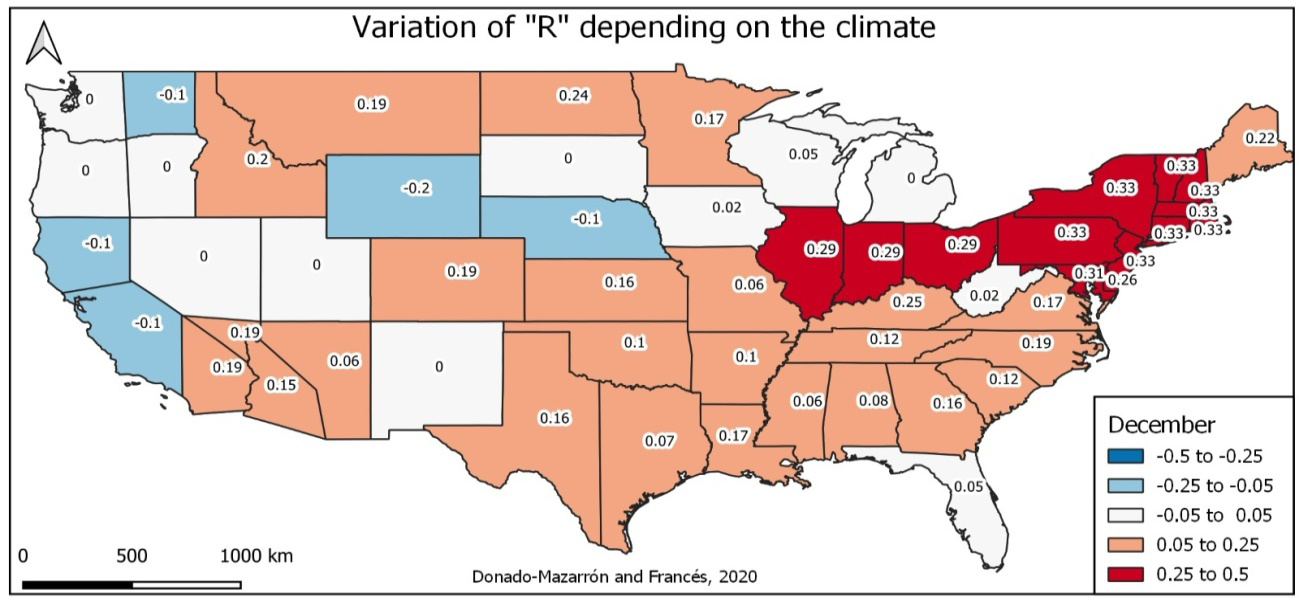
From September to December (Figures 9-12) are, in general, the months with the highest rate of positive spread, in all the states. All of course referring to the variation of R exclusively in terms of climatic factors. We attend to variables according to climatic connotations of each study area (orography, wind regimes, temperature, relative humidity, altitude, solar radiation, insolation index, etc.), which we find in the climatic averages for the process of homogenizing the reproductive index of the virus with the climatic conditions of each urban area of study.
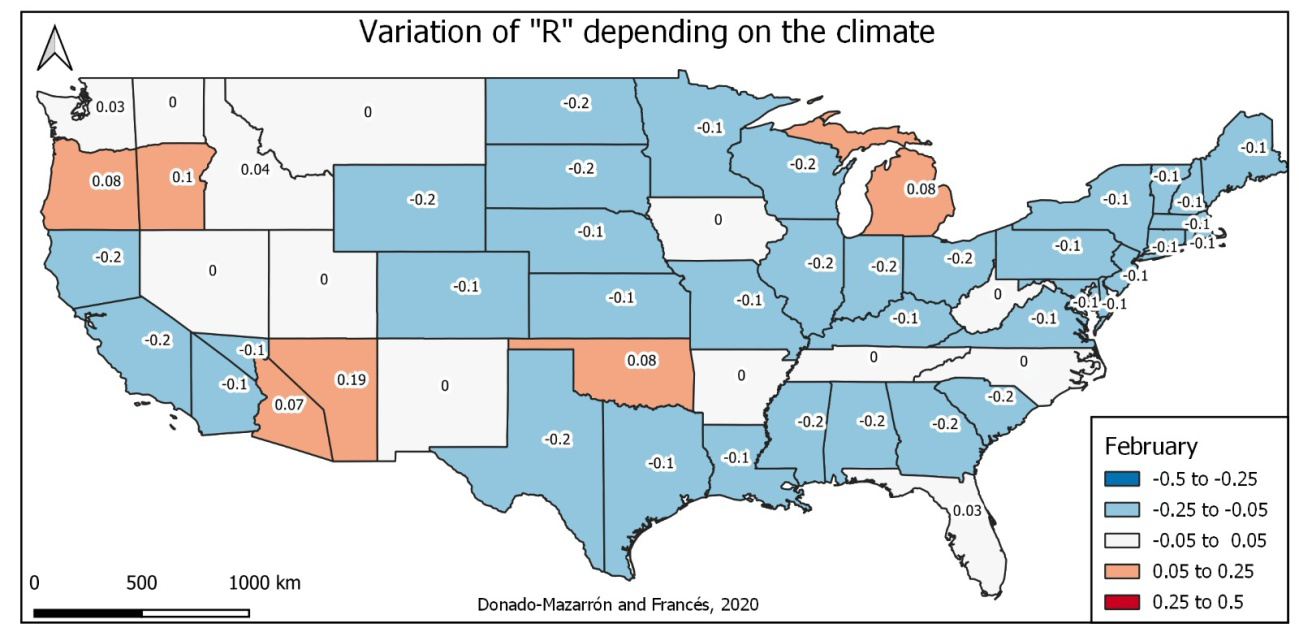
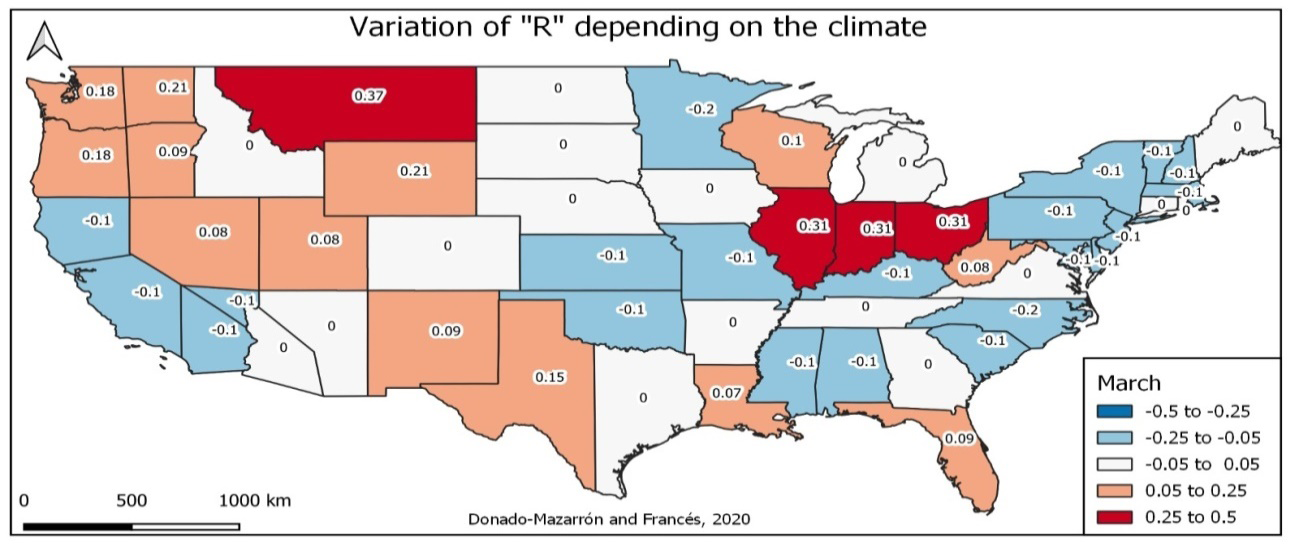
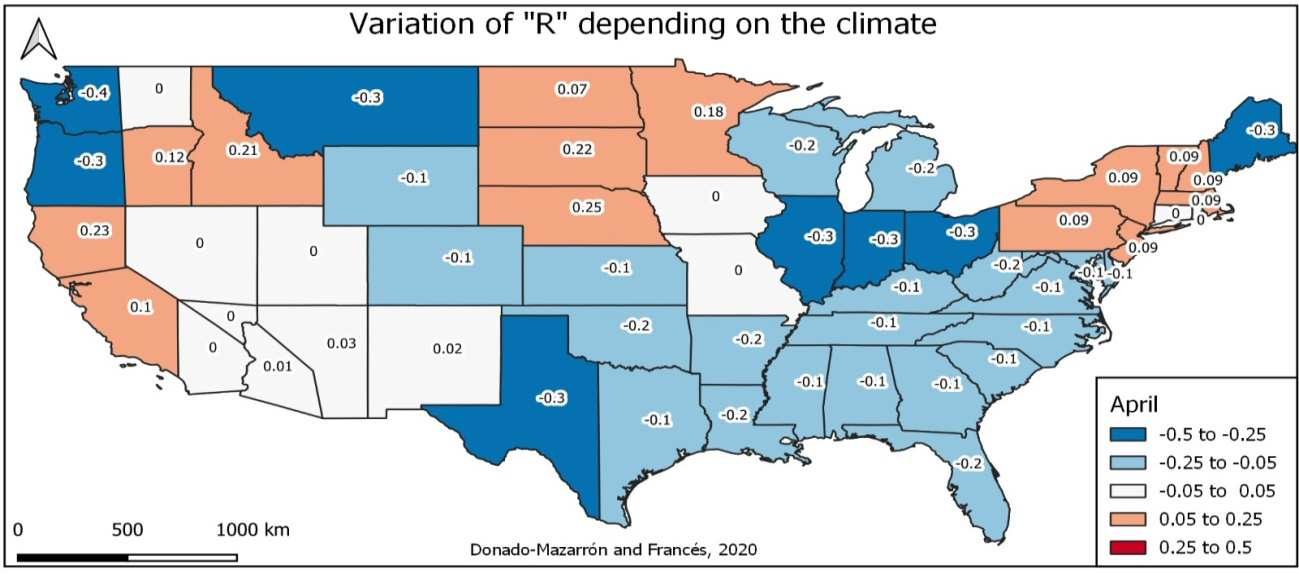
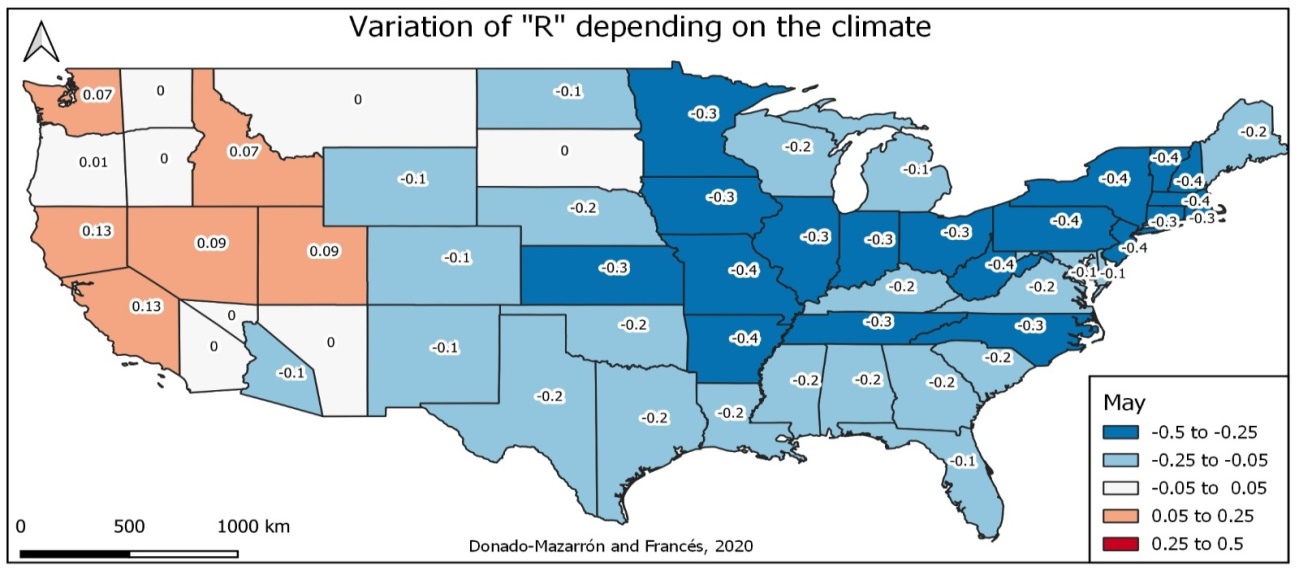
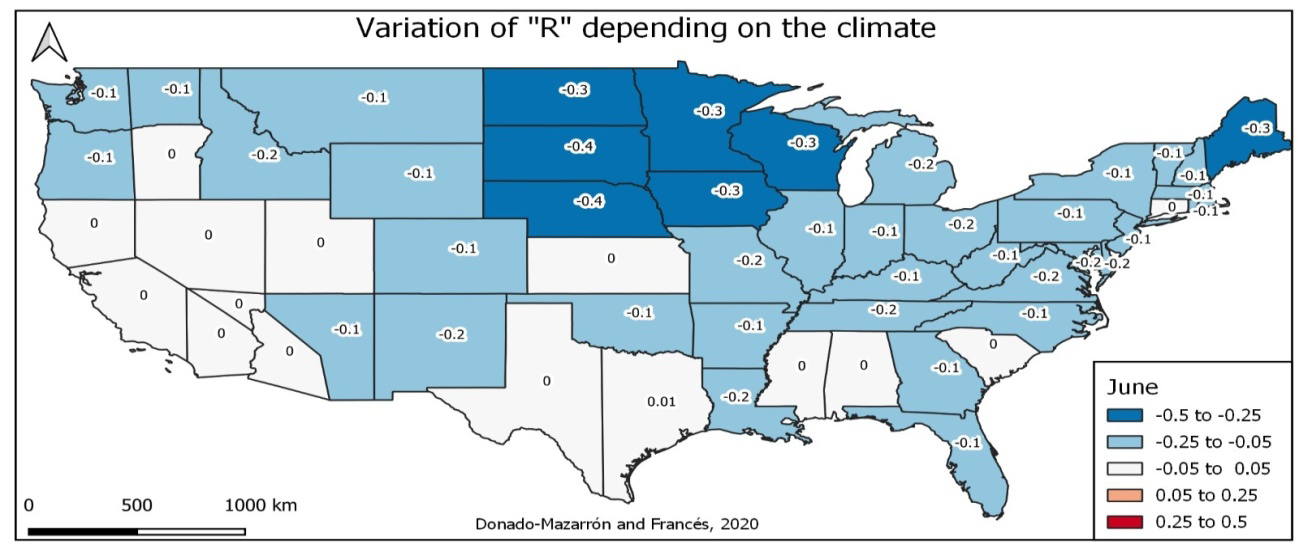
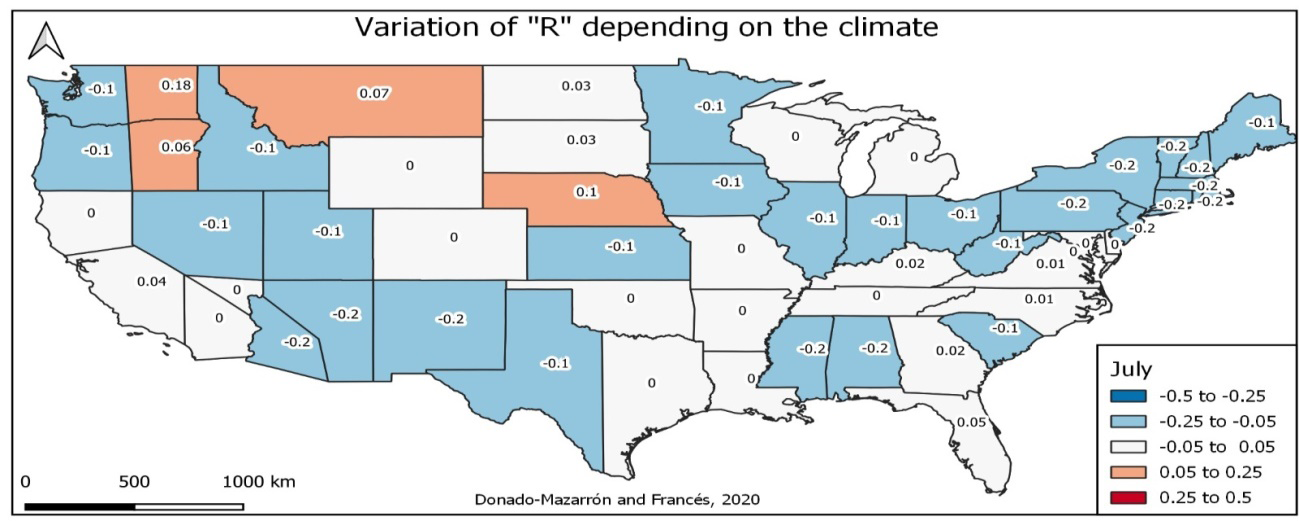
Making a general summary of what the annual cartographic series shows during the first months of the year, which frames from January to July, the positive monthly variation of the index is accentuated according to large state demarcations and with a marked difference between east and west coast (Figures 1-8), produced exclusively by climatic conditions. The months with the highest incidence of the virus would be from September to December (Figures 9-12):
February
March
April
May
June
July
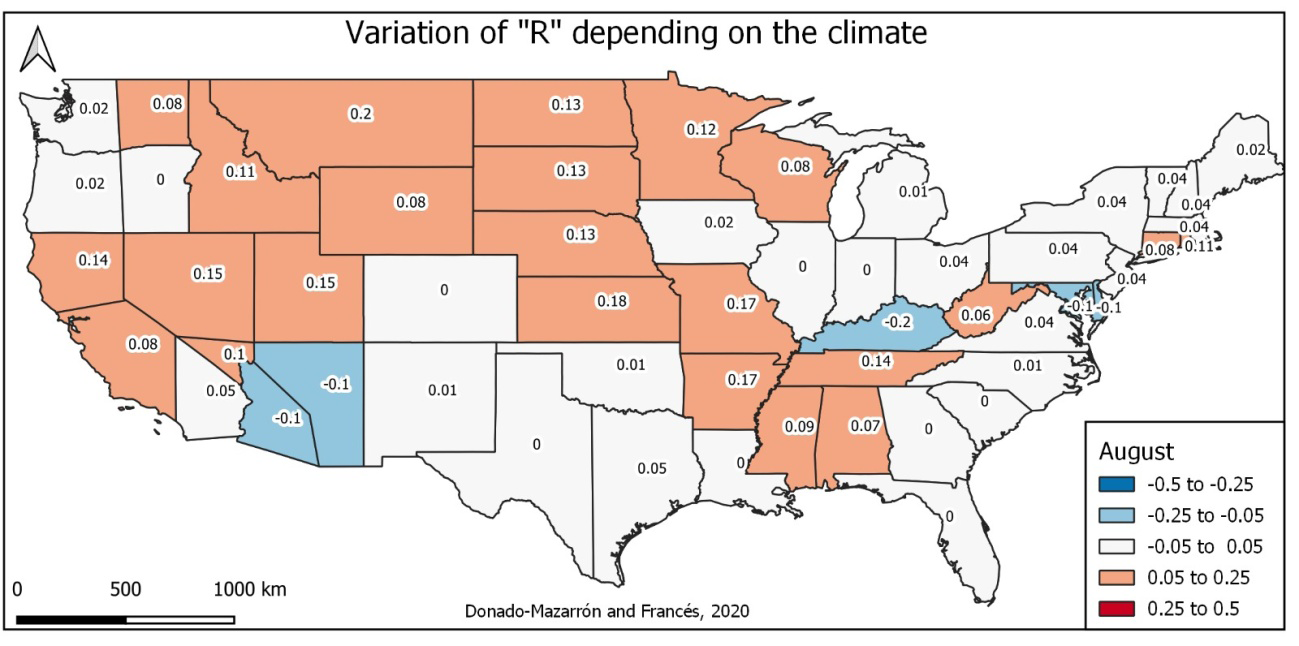
August
September
October
November
December
Discussion
Within this area we will extend the results from a perspective solely based on weather conditions. The most important point that we deal with in this research work are the main factors related to weather and climate: temperature and relative humidity of the air. It is irrefutable that the state of temperature and relative humidity influence the incidence of the spread of SARS-CoV-2, in outdoor spaces during the climatic seasons. With our work we provide conclusive data for outdoor spaces since, only through the incidence value applied to a climatic space of anthropic incidence [13], we generate a synoptic cartography with the spread rates of SARS-CoV-2, a circumstance that does not contributes no scientific work to date. In relation to interior spaces and how the variables multiply and have a clear social connotation, it is verified that the variables multiply for a greater or lesser spread of SARS-CoV-2 [14].
The studies we analyze show that a cool and dry environment is more prolific for SARS-CoV-2 [15]. It is demonstrated under experimental and climatic conditions [16], and that between latitudes 30º and 50º [17], the spread of the virus is mainly seasonal. A very important point, coronaviruses are within the family of lipophilic viruses, covered by a fatty layer [17], research on other enveloped viruses is an indicator that the fatty layer causes these viruses are more susceptible to heat than those without it, which explains their seasonality [18]. After more than a year of pandemic, it has been verified that summer and social containment actions stop the transmission of the virus [14]. Especially, the harsh social restrictions that abruptly paralyze said spread regardless of weather conditions, so we rely on a symbiosis between both parameters to improve social conditions in times of the SARS-CoV-2 pandemic.
Virtually all observational studies have been based on human-to-human infections, so population density and social behaviors are the most important values in the spread of SARS-CoV-2, however, we must insist and, with much emphasis, that the climate conditions social behaviors [7] and this is a scale of measurement of actions to stop the transmission of SARS-CoV-2. We have a disparity of climatic spaces in the work carried out and consulted. However, we clarify that the incidence of SARS-CoV-2, outside the human body, depends on weather conditions. It is a no-brainer and is revealed for other viruses such as SARS-CoV, MERS-CoV, DENV-1, DENV-2, DENV-3 and DENV-4 and influenza [19, 20, 21, 22]. The experimental conditions are maintained and everything indicates that SARS-CoV-2 is stabilized with aerosols for a period of time; however, it remains for a longer period on solid surfaces [23, 24, 25]. Another point to which we are going to place greater emphasis is that of the spread of the virus in open and closed environments. Depending on the climatic conditions and the time of year, we are led towards a different social behavior by cultures or traditions, either indoors when it’s cold or outdoors when the weather is good. It is obvious, but it is still an essential conditioner when transmitting the virus between human beings. Not only directly in closed spaces but indirectly, if there is no continued sanitation and cleaning conditions.
Thanks to the work we have carried out, we offer sufficient and unambiguous evidence towards the scientific method that climatic conditions condition the spread of SARS-CoV-2 and as an example we offer the comparison between Spain and Brazil [26]. For Spain, climatic conditions and containment measures [27] have managed to regulate the spread of the virus, while in Brazil there is no optimal period to control the spread of the virus (in terms of climatic conditions) since As mentioned above, the oscillation/ climatic variation throughout the year is practically nil. This makes it necessary to control social movements by public institutions in general while there is no herd immunity to contain the viral spread and maintain the vaccination process [28]. In latitudes 30º-50hº it is necessary to take advantage of the months of low transmission to adapt to the virus in case of not having vaccines. Climatologically, the summer period is optimal for a supposed de-escalation, control of normality or adaptation to the virus in the USA.
Conclusion
The monthly synoptic mapping applied to the effect of climate and atmospheric weather on the spread of the SARS- CoV-2 virus is a very effective tool for any study that seeks to rationalize prevention methods and strategies to contain the spread of the virus in its territory according to climatic factors that condition society. In summary, weather and climate influence the spread of the SARS-CoV-2 virus due to its biological condition. Climatic variations condition social behavior and thanks to them a greater or lesser spread of SARS-CoV-2 is generated. It is understood, according to the data collected, that the spread of the virus in climatic zones between latitude 30-50º continues to be higher with respect to other zones since the pandemic began and between the months of October to March in the northern hemisphere. In addition, according to the report and its interpretations, as the winter season in the Southern Hemisphere advances, the spread in terms of climatic factors will also suffer an upward peak between the same parallels. However, we have to attend to variables according to climatic connotations of each study area (orography, wind regimes, temperature, relative humidity, altitude, solar radiation, insolation index, etc.), which we find in the climatic averages.
References
-
Hui DS, Azhar EI, Madani TA, Ntoumi F, Kock R, et al. (2020) The continuing 2019-nCoV epidemic threat of novel coronaviruses to global health - The latest 2019 novel coronavirus outbreak in Wuhan, China. Int J Infect Dis 91: 264-266.
-
World Health Organization (2020) Naming the coronavirus disease (COVID-19) and the virus that causes it.
-
Zhou P, Yang XL, Wang XG, Hu B, Zhang L, et al. (2020) A pneumonia outbreak associated with a new coronavirus of probable bat origin. Nature 588(7836): E6.
-
World Health Organization (2021) Novel Coronavirus (COVID-19).
-
Callaway E (2020) Time to use the p-word? Coronavirus enters dangerous new phase. Nature.
-
Quiroga S (2021) SARS-CoV-2 mutations: rapid vaccination is urgent. Gaceta Médica.
-
Bernal FJV (2021) Weather and climate as a conditioning factor for human activities. Divulgameteo.
-
Average temperatures by states of the United States of America. In: Mazarrón Morales CD, Martínez LF (Eds.), NOAA. Climate series 1979-2019.
-
Average relative humidity by provinces of Spain. In: Mazarrón Morales CD, Martínez LF (Eds.), NOAA. Climate series 1979-2019.
-
Wu F, Zhao S, Yu B, Chen YM, Wang W, et al. (2020) A new coronavirus associated with human respiratory disease in China. Nature 579(7798): 265-269.
-
Wang J, Tang K, Feng K, Lin X, Lv W, et al. (2021) Impact of Temperature and Relative Humidity on the Transmission of COVID-19: a Modeling Study in China and the United States. BMJ Open 11(2): e043863.
-
Unitet States Geological Survey (2021) Cartography and geographic data.
-
NOAA (2021) Climatic records.
-
Dalziel B, Kissler S, Gog J, Vivoud C, Bjørnstad O, et al. (2018) Urbanization and humidity shape the intensity of influenza epidemics in U.S. cities. Science 362(6410): 75-79.
-
Cowling B, Fang V, Riley S, Peiris JM, Leung G (2009) Estimation of the serial interval of influenza. Epidemiology 20(3): 344-347.
-
Shaman J, Kohn M (2009) Absolute humidity modulates influenza survival, transmission, and seasonality. PNAS 106(9): 3243-3248.
-
Chin AWH, Chu JTS, Perera MRA, Hui KPY, Yen HL, et al. (2020) Stability of SARS-CoV-2 in different environmental conditions. The Lance Microbe 1(1): e10.
-
Cavanagh D (1997) The Molecular Biology of Coronaviruses. Adv Virus Res 48: 1-100.
-
Price RHM, Graham C, Ramalingan S (2019) Association between viral seasonality and meteorological factors. Scientific Reports 9: 929.
-
Lowen A, Steel J, Mubareka S, Palese P (2008) High temperature (30ºC) blocks aerosol but not contact transmission of influenza virus. J Virol 82(11): 5650- 5652.
-
van Doremalen N, Bushmaker T, Morris DH, Holbrook MG, Gamble A, et al. (2020) Aerosol and Surface Stabilityof SARS-CoV-2 as Comparedwith SARS-CoV-1. N Engl J Med 382(16): 1564-1567.
-
Steel J, Palese P, Lowen AC (2011) Transmission of a 2009 pandemic influenza virus shows a sensitivity to temperature and humidity similar to that of an H3N2 seasonal strain. J Virol 85(3): 1400-1402.
-
van Doremalen N, Bushmaker T, Munster VJ (2013) Stability of Middle East respiratory syndrome coronavirus (MERS-CoV) under different environmental conditions. Euro Surveill 18(38): 20590.
-
Martinez LF, Morales CDM (2021) The spread of COVID-19 in Spain and Brazil according to time and climate. Rev Bras Promoç Saúde 34: 12455.
-
(2021) Health crisis COVID-19-Attention and information. General Directorate of Public Governance.
-
Wallinga J, Teunis P (2004) Different epidemic curves for severe acute respiratory syndrome reveal similar impacts of control measures. Am J Epidemiol 160(6): 509-516.
-
World Health Organization (2020) Responding to community spread of COVID-19: interim guidance.
-
Boland B (2020) What is Herd Immunity?. Banner Health.
- Epidemiological Surveillance and Rumors on Social Media
- Awareness and Treatment of Uncontrolled Hypertension in US Overweight/Obese Youths Aged 16–24 Years, NHANES 2021–2023
- Strengthening EPI Through Parental Engagement: Lessons from Dhaka Slums for IA-2030
- Mothers Knowledge of the Prevalence, Causes, Effects, Prevention and Control of Diarrhoea among Children in Ife East Local Government Area, Ile Ife, Osun State, Nigeria
- Covid-19 Reinfections Case Series from October 2023 to October 2024 in A General Medicine Office in Toledo (Spain)
- Water Contact! One Risk Too Many: Risk Factors Associated with Schistosoma haematobium infection in Osun State, Nigeria