Incidence Rate of Acute Respiratory Infections in General Medicine as a Tool to Correcting Official Data of Covid-19 in Places where the Tests of Polymerase Chain Reaction are not Accessible
The limitations of incidence rates (IR) studies because of the severe deficit in COVID-19 testing capacity worldwide, implies that these data are “minimum” rates. It is required alternative options to evaluate the real incidence, and performance of infection control strategies. COVID-19 occurs in the general practitioner (GP) practice frequently as acute respiratory infection (ARI), and these ARI (such as the flu) share similar routes of transmission (mainly through droplets and fomites) with COVID-19. So, incidence rates of ARI in GP practice during the COVID-19 outbreak represent “maximum” rates of COVID-19, and these figures allow us to estimate the true incidence of COVID-19 (for example, considering that 50% of ARI in the GP during the outbreaks are actually COVID-19), which is useful for epidemiological, planning and management purposes, including evaluation of control measures which should have qualitatively similar effects on ARI. This study shows incidence rates of ARI obtained at a GP practice, during March-April 2020 (most intense phases of the COVID-19 outbreak) in Toledo (Castilla La Mancha, Spain), and based on it, incidence rates real or reasonable are estimated for Spain, Castilla La Mancha (a region of Spain), Toledo province, the work area of a Health Center in Toledo capital, and in the list of patients of the GP. These data are compared with "official" COVID-19 incidence rates. It is suggested that the "official" COVID-19 incidence rates, should be multiplied by 3 or 5 to obtain the real or reasonable rate of COVID-19 in these places where diagnostic tests are not performed in all possible cases during the outbreak. The actual probable incidence is 3-5% of COVID-19 infections in the population analyzed in March-April 2020.
Introduction
The world is currently experiencing an outbreak of a pandemic caused by the SARS-CoV-2 severe acute respiratory syndrome coronavirus causing the disease called COVID-19, first reported in Wuhan, Hubei Province, China on December 2019 [1]. As of this writing, May 15, 2020, more than 4.5 million confirmed cases of COVID-19 have been reported worldwide and more than 300,000 deaths [2]. The clinical and epidemiological features of COVID-19 have been repeatedly published in the last few weeks. Common
symptoms at onset of illness are fever, malaise, dry cough (less common symptoms were sputum production), myalgia or fatigue and dyspnea, and often signs of pneumonia can be found [3, 4].
Respiratory symptoms are normally the most frequent at the beginning of the disease, independently of the non- respiratory symptoms that seem to be less frequent, or that they appear later in the evolution, such as dermatological [5], digestive [6], ageusia and anosmia [7, 8, 9, 10], cardiologic [11], and nervous system involvement [12]. Thus, in 80% of cases, COVID-19 produces mild respiratory symptoms as initial clinical manifestations. Patients have symptoms similar to those of the flu or the common cold, although there may be some differences [13]. Therefore, in usual practice, COVID-19 disease is frequently presented to the general practitioner (GP) as an acute respiratory infection (ARI).
ARI is a group of diseases that occur in the respiratory system, caused by different microorganisms such as viruses and bacteria, which start suddenly. It is the most frequent infection in the world and represents an important public health issue. The respiratory viruses involved in ARIs are the Rhinovirus, Coronavirus, Influenza, Parainfluenza, Adenovirus; Respiratory Syncytial Virus and Enterovirus. The main symptoms are fever, malaise, stuffy and runny nose, cough, sore throat, expectoration, and difficulty breathing [14, 15]. Consequently, the SARS-CoV-2 virus causing the current outbreak of coronavirus disease 2019 (COVID-19) [16, 17] is one more etiological agent of the ARI, and as such ARI is initially attended by the GP.
The person is the center of the GP’s interest, but the person in its context. To carry out this task correctly, the GP must adequately assess not only “what health problems there are” - the diagnoses - but also “how many there are and where” (incidence and prevalence). When the GP does that, it can take on a new awareness that changes the value of sanitary measures, planning and management. It is like “looking at the land from the sea”: things seen from that perspective are placed in their exact place. On the other hand, the GP performs continuous care, which provides, among other things, the advantage of being able to know the Incidence Rates of diseases [18, 19].
COVID-19 outbreak is major global health challenge; WHO is urging governments to conduct more tests for COVID-19 due to concerns about the lack of case notification in many countries around the world. As more and more nations have introduced stringent measures to try to delay the spread of the virus, the WHO cautions that evaluating the impact of these measures will only be possible with accurate data on the disease. He also warns that a lack of data on how many people have the disease could undermine containment and mitigation efforts in many countries [20, 21].
However, the reality is that there is a lack of diagnostic tests or that in many places Health Authorities have a limited ability to test, so the criteria of many countries such as in Spain, or in the United States according to the CDC, to determining who will be tested they remain extremely strict, at least during March and April 2020: only the diagnostic test will be done in people who had recently travelled or had contact with someone who had the virus, or people with a clinical picture of acute respiratory infection admitted to the hospital, or respiratory infection of any degree in health personnel; and similarly, routine diagnostic tests are not performed on contacts [22]. In this situation, at the primary care level where COVID-19 is presented as ARI, for the GP all ARI are considered as COVID-19 for the purpose of isolation and medical follow-up.
Compartmental models are simplified ways of representing the evolution of an epidemic in a large population. These models separate the population into different states or “compartments” and try to explain the way in which the individuals in that population evolve from one to the other [23]. The limitations of compartment model studies and the severe deficit in COVID-19 testing capacity worldwide, especially in low and middle income countries, have required alternative options to evaluate the performance of infection control strategies. Common respiratory infections (such as the flu) share similar routes of transmission (mainly through droplets and fomites) with COVID-19, so most infection control measures should have qualitatively similar effects on these diseases (although covid-19 is inherently more contagious). Therefore, examination of reliable surveillance data for ARI or influenza offers a simple approach to indirectly assess the overall effectiveness of a population’s overall infection control strategies [24]. In any case, surveillance of influenza as an alternative method to the knowledge of COVID-19 cases also requires serological diagnostic tests, which may be a limiting factor of the method.
In this scenario, this article shows a study on the incidence rates of ARI based on clinical symptoms, in the GP consultation, in Toledo (Spain), what is possibly a “maximum” incidence rate of COVID-19 cases, as an indicator or tool to correct the official incidence rates that show cases with test performed, but that are carried out only in some patients, and therefore are “minimal” incidence rates. This estimation of the true or reasonable incidence rates (with the correction of official or minimum incidence rates), based on ARIs diagnosed by clinical symptoms may have epidemiological, clinical, planning and management value, as well as for the evaluation of control measures of COVID-19.
Material and Methods
A retrospective study was carried out identifying new cases ARIs in patients who consulted in a surgery of general medicine in the Santa Maria de Benquerencia Health Center, Toledo, Spain (the dependent neighborhood of the Health Center has a population of 20,000 inhabitants; the GP has a patient list of 2,000 patients> 14 years of age; in Spain GPs care for people> 14 years of age), from March 1 to April 30, 2020, which were the times of greatest increase exponential of the COVID-19 outbreak in that region and in Spain.
The GPs in Spain work within the National Health System, which is public in nature, and are the gateway for all patients to the system, and each person is assigned a GP [25]. ARI diagnoses were grouped according to ICD-10 (J00 to J22) [26]. Therefore, the ARI diagnoses considered in this study were: acute bronchitis, pharynx-tonsillitis, common cold, flu, pneumonia, sinusitis, other upper respiratory infections, other respiratory infections [26]. During the study period, no diagnostic test on patients with mild respiratory symptoms in the community in Spain was performed (that diagnostic test for SARS-CoV-2 was reserved at people with a clinical picture of acute respiratory infection admitted to the hospital, or respiratory infection of any degree in health personnel; similarly, routine diagnostic tests are not performed on contacts). Thus, COVID-19 cases were presented as ARIs in the general medicine practice. It can be assumed that not all IRA cases were cases of COVID-19, but in the absence of a diagnostic test and in the epidemiological context of the COVID-19 outbreak, all ARI were actually considered as cases of COVID-19 in clinical practice for isolation and monitoring purposes.
After accounting for new ARI cases in the study period, ARI Incidence Rates were calculated for the general medicine consultation and for the neighborhood attended by the Health Center, as follows: Incidence Rate in GP consultation = Incidence (new cases during March and April 2020) x List of patients of the GP (2,000 patients) / Population (20,000 inhabitants) [27, 28].
Furthermore, the incidence rates (new cases) of COVID-19 per 100,000 inhabitants were calculated based on “official” data during the same period of time (March 1 to April 30, 2020) [29, 30, 31]. They were taken into account, as denominators, for Spain 46,094,000 inhabitants; for Castilla La Mancha 2,038,440 inhabitants; and for Toledo (one of the provinces of Castilla La Mancha) 687 391 inhabitants. Finally, the “official” incidence rates were compared with those of ARI of the general medicine consultation and with projections made on for the dependent neighborhood of the Health Center, of Toledo, of Castilla La Mancha and of Spain populations.
Results
The results of the number of new cases and the “official” incidence rates COVID-19 in Spain, “official” incidence rates COVID-19 in Castilla La Mancha, “official” incidence rates of COVID-19 in Toledo, “official” incidence rates of COVID -19 in the neighborhood of the Health Center, “official” incidence rates in the GP consultation, and IRA incidence rates in the GP consultation, are presented in (Tables 1 & 2).
| COVID-19 “official” cases in Spain | COVID-19 “official” cases in Castilla La Mancha (Spain) | COVID-19 “official” cases in Toledo (Spain) | COVID-19 “official” cases in the neighborhood of the Health Center | COVID-19 “official” cases in the GP consultation | IRA cases GP consultation | |
|---|---|---|---|---|---|---|
| TOTAL | 213.435 | 20.071 | 4635 | 126 | 6 | 120 |
Table 1: Incidence Rates Of Covid-19 Confirmed In Spain, Castilla La Mancha, Toledo, Area Of The Health Center, And Consultation
- Table 1: Cases Of Covid-19 Confirmed In Spain, Castilla La Mancha, Toledo, Area Of The Health Center, And Consultation Of The
- Gp, And Cases Of Wrath In The Consultation Of The Gp, In The Months Of March And April 2020.
- “Official”
- COVID-19 incidence rates in Castilla La
- Mancha (Spain) per 100,000 inhabitants
- “Official”
- COVID-19 incidence rates in Toledo
- (Spain) per
- 100,000 inhabitants
- “Official”
- COVID-19 incidence rates
- ”in the GP consultation per 100,000 inhabitants
- “Official”
- COVID-19 incidence rates in Spain per 100,000 inhabitants
- “Official” COVID-19 incidence rates in the neighborhood of the Health
- Center per 100,000 inhabitants
- TOTAL
- 463
- 984
- 674
- 630
- 300
- 6
Table 2: Incidence Rates Of Covid-19 Confirmed In Spain, Castilla La Mancha, Toledo, Area Of The Health Center, And Consultation
During the COVID-19 pandemic, in scenarios where diagnostic by polymerase chain reaction (PCR) testing is not done in the community, new confirmed cases shown in official statistics represent “minimal incidence rates of COVID-19” (patients treated or admitted to the hospital, or health personnel with symptoms); on the contrary, the number of new cases of ARIs attended in GP consultation (in places with a public health system, where everyone is assigned a GP, which is the gateway to the system, and who is responsible for a given geographic area), they represent the “maximum incidence rates of COVID-19”.
In the case presented here for Toledo, Castilla La Mancha,
and Spain, the “maximum incidence rate” (considering that all ARI cases are COVID-19) is approximately 5-10 times greater than the minimum incidence rate “official.” Almost in all probability, not all ARI cases attended in the GP consultation will be COVID-19. On a conservative approach, only 50% of them will possibly be COVID-19 during the outbreak. That is, the COVID-19 “reasonable” incidence rate estimated from 50% of the ARI incidence will be 3,000 per 100,000. In other words, the incidence rate of cases with COVID-19 “official” (positive PCR in selected people) must be multiplied by 3 or 5 to obtain the real or reasonable rate of COVID-19 (Figure 1).
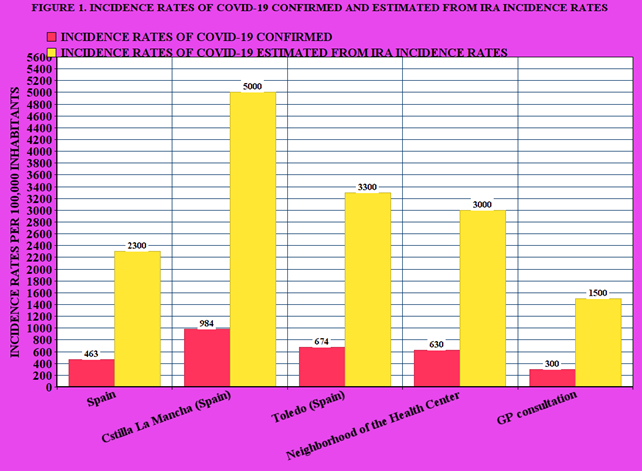
Table 3 shows the predictable or “reasonable” Incidence Rates estimated from 50% of the IRA rate in the GP consultation. Our calculations indicate a 3-5% incidence of COVID-19 infections in the population in March-April 2020 (a figure that comes from considering between 50% and slightly less than 100% of the ARI cases attended in the GP consultation).
- “Reasonable” incidence rates of
- COVID-19 in the neighborhood of the Health
- Center per
- 100,000 inhabitants
- “Reasonable” incidence rates of COVID-19 in Cstilla La
- Mancha (Spain) per 100,000 inhabitants
- “Reasonable” incidence rates of COVID-19 in the GP consultation per 100,000 inhabitants
- “Reasonable” incidence rates of COVID-19 in Spain per
- 100,000 inhabitants
- “Reasonable” incidence rates of COVID-19 in
- Toledo (Spain) per 100,000 inhabitants
- TOTAL
- 1.400-2.300
- 3.000-5.000
- 2.000-3.300
- 1.800-3.000
- 900-1.500
- 6
Table 3: “Reasonable” Or Probable Incidence Rates of Covid-19 Estimated From Ira Incidence Rates In The Gp Consultation For
Table 4 presents the confirmed, probable and hidden cases of COVID-19 in the months of March and April 2020 in Spain, Castilla La Mancha, Toledo, area of the health center, and GP consultation. In this way, the “maximum incidence rate” (new cases of ARI in the GP consultation; or in a conservative view, the 50% of that rate) and its projections at the population level, less the minimum or official Incidence Rate ( cases confirmed with PCR in hospitals or health personnel only), shows us a very important hidden or undiagnosed incidence.
| MARCH-APRIL 2020 | |
|---|---|
| Proven (“official”) cases with PCR in Spain | 213.435 |
| Real or reasonable cases in Spain | 540.000-1.000.000 |
| Hidden undiagnosed cases in Spain | 320.000-780.000 |
| Proven (“official”) cases with PCR in Castilla La Mancha | 20.071 |
| Real or reasonable cases in Castilla La Mancha | 60.000-100.000 |
| Hidden or undiagnosed cases in Castilla La Mancha | 40.000-80.000 |
| Proven (“official”) cases with PCR in Toledo | 4.635 |
| Real or reasonable cases in Toledo | 14.000-23.000 |
| Hidden undiagnosed cases in Toledo | 9.000-18.000 |
| Proven cases (“official”) with PCR in the neighbourhood of the Health Center | 126 |
| Real or reasonable cases in the neighbourhood of the Health Center | 360-600 |
| Undiagnosed hidden cases in the neighbourhood of the Health Center | 230-470 |
| Proven (“official”) cases with PCR in the GP consultation | 6 |
| Real or reasonable cases in the GP consultation | 20-30 |
| Undiagnosed hidden cases in the GP consultation | 14-24 |
Table 4: Confirmed, “Reasonable” Or Probable And Hidden Cases Of Covid-19 In Spain, Castilla La Mancha (Spain), Toledo (Spain), A
Discussion
Presentations of COVID-19 range from asymptomatic/ mild symptoms to severe illness and mortality. Common symptoms included fever, cough, and shortness of breath. Other symptoms, such as malaise and respiratory distress, have also been described [32]. COVID-19 disease is frequently presented to the GP as an ARI, which is the most common type of infection in the world. So, at present, the SARS-CoV-2 virus is one more aetiological agent of ARI [33].
Diagnostic Tests and Clinical or Epidemiological Utility
At present, a confirmed case of COVID-19 requires a positive PCR test for SARS-CoV-2, based on nasopharyngeal or throat swab. WHO is urging governments to conduct more tests for COVID-19 due to concerns about the failure to report cases in many countries around the world; As more and more nations have introduced stringent measures to try to delay the spread of the virus, the WHO cautions that evaluating the impact of these measures will only be possible with accurate data on the disease. It also warns that a lack of data on how many people have the disease could undermine containment and mitigation efforts in many countries [20].
But, from the clinical and epidemiological point of view, it must be taken into account that there may be false negative results of the PCR tests. PCR tests provide little diagnostic value immediately after exposure to SARS- CoV-2. The probability of false negative results is 100% on the day of exposure, falling to 38% when symptoms begin approximately 4 days later, and then to 20% 3 days after the onset of symptoms. Then it starts to increase again. Therefore, care should be taken in interpreting the PCR tests for SARS- CoV-2 infection, done early in the course of infection. If the clinical suspicion is high, the infection should not be ruled out based only on PCR, but the clinical and epidemiological situation should be carefully considered [34].
Furthermore, the importance of antibody testing lies in providing information to help track the spread of the virus at the community level, and assess the impact of public health efforts. Knowing how widespread the infection has been in a population could guide research and possibly public health decisions [35]. However, the reality is that there is a lack of diagnostic tests (PCR and antibody) or that in many places Health Authorities have a limited ability to test. So, in many countries such as Spain, or the CDC in the United States, the criteria to determine who is tested remain extremely strict, at least during March and April 2020: only people who had recently traveled or had contact with someone who had the virus, or people with a clinical picture of acute respiratory infection admitted to the hospital, or respiratory infection of any degree in health personnel; and similarly, routine diagnostic tests are not performed on contacts [36, 37, 38].
But, in addition there is the problem of test validity. There appears to be no known antibody test to date that has been validated for the diagnosis of SARS-CoV-2 infection. Tests measure IgM or IgG antibodies, but IgM antibodies may not develop at all, and IgG antibodies generally do not develop until later in the disease process. Therefore, the use of such tests to diagnose COVID-19 will bypass some infections [39]. No test is better than a bad test; a high-quality test should achieve 99% or more sensitivity and specificity. That means that testing should turn up only about 1 false positive and 1 false negative for every 100 true positive and true negative results. Without reliable tests, it can end up doing more harm than good [40].
Incidence and Prevalence are two ways of expressing the morbidity rate. Incidence is new cases in a certain time unit as numerator, and the population estimated at the center of the period as denominator; it is the healthy-sick transit within the specified period; 100,000 is generally used as the coefficient in open populations, but in other populations another coefficient may be used. The Incidence Rate can be useful to intuitively measure the weight of a disease outbreak [41].
Epidemiological data when all possible cases cannot be tested. Since the tests are not available to everyone, the morbidity rates do not accurately reflect the extent of transmission in communities around the world. For Spain, the official incidence figures (213,435 positive as of April 30, 2020) are therefore false; perhaps, one could speak of “minimal incidence” [36]. Very recently it has been reported that examining reliable data from influenza surveillance offers a simple approach to indirectly assess the overall effectiveness of population control strategies for COVID-19 infection [24]. In this sense, taking into account the great accessibility of patients to the GP, and the fact of the continuity of care that characterizes their work (which has important epidemiological connotations) [25], an indirect indicator of real COVID-19 cases (new cases of ARI with diagnosis based exclusively on symptoms), it will be even easier to use, as since the safe diagnosis of influenza requires a positive result in samples of the respiratory tract analyzed in the laboratory. Our proposal is to use clinical data, not serological, of ARI cases in the GP consultation, which is much easier and accessible.
Thus, new cases of ARI in GP practice (where COVID-19 cases without diagnostic tests are included) indicate the maximum incidence. A conservative estimate may be to consider that half of the ARI cases during the COVID-19 outbreak are actually COVID-19 cases (although this “maximum COVID-19 incidence does not include asymptomatic or presymptomatic or paucisymptomatic cases; therefore, considering the actual incidence rate of COVID-19 as half the incidence rate of ARI in a given period is probably too conservative).
The Incidence/Prevalence Rate of COVID-19 in the Community
Currently, the infection rate is unknown. Further, the percentage of infected individuals who seroconvert is still an open question [42]. Of course, it is suspected that the official data on those infected is low; We also know that some new coronavirus infections are asymptomatic. All of this means that confirmed case counts are low, but we don’t know exactly how low. Immunological studies could give us an idea of the true infection rates in the community. But only very recently have general population tests been carried out in different places to detect the virus. On the other hand, in some places, there are reservations about the precision of the tests: serological tests have the problem of their validity (false positives and false negatives); Furthermore, the studies must be well designed and have no sampling biases [43].
The first studies of the number of cases in the community begin to be published. These data, usually, show the number of participants who have had COVID-19 (the prevalence); although some refer only to the number of participants who were positive for COVID-19 at the time of swabbing (the positivity rate). Among the preliminary data known are the following: In a Boston suburb, a sample of people tested on the street showed that about a third of the 64 people tested were exposed to the virus [43]. As of April 20, the European Center for Disease Prevention and Control counted more than 300 cases of COVID-19 per million people worldwide, or about 0.03% of the world population. In the United States, nearly 2300 people per million have been infected, about 0.2% of the population nationwide, but the proportion of people who have had COVID-19 varies by state. Cumulative COVID-19 cases range from less than 45 infected people per 100,000 in Alaska (less than half a percent of the population), passing 0.8% in a screening of 6% of the Icelandic population, using PCR on nasopharyngeal and oropharyngeal samples, to nearly 1220 per 100,000 in New York (about 1.2% of the state population), according to US Centers for Disease Control and Prevention data. On the other hand, the WebMD survey WebMD poll of 6,343 readers to the homepage on desktop and mobile, April 20-21, 2020 suggested that around 26% of residents of the City of New York are positive for COVID-19, which show that infection is more widespread than current data suggests. But these data refer to confirmed cases with diagnostic tests. However, the confirmed case count depends on the availability -and the reliability- of diagnostic and antibody testing, which can’t be taken for granted [44, 45, 46].
According to the so-called Heinsberg study, the authors assume that up to 1.8 million people with the new coronavirus may be infected in Germany (an amount ten times higher than the 163,000 official records as of May 4). In Gangelt, Heinsberg district (North Rhine-Westphalia), a carnival event took place on February 15; the study of a random sample of Gangelt resulted in 15.5% (95% CI: 12.3% -19.0%) were infected; a total of 5 times more residents were infected than was officially reported. 22% of patients who tested positive in Heinsberg’s study were asymptomatic [47, 48]. 5% of the Spanish population has been infected with SARS-CoV-2, which represents around 2.3 million citizens (with “official” data of infected as of May 14, of 229,540 cases). However, the impact of the virus varies greatly according to the Spanish province, from Scoria where the percentage of people who have been infected is 14.2%. Madrid reaches
11.3%, Barcelona the prevalence reaches 7.1%, but in Huelva it is 1.5%, Murcia 1.4%, Tarragona 1.6% or La Corona 1.8%. Thus, it can be said regarding Spain, that the official data indicates that they have barely detected around 10% of the total number of actual cases in the community. On the other hand, this study in Spain indicates that 33% of the respondents positive in SARS-CoV-2 are asymptomatic.
The European Center for Disease Control has compiled the first seroprevalence studies published in Europe, and by now almost all are below 5%: 1.9% in Denmark, 3.4% in Helsinki, 3% in France 4.4%, in Oise (France), 3.2% in the Netherlands, 1% in Scotland. A study among the general population, carried out on patients from a health center in Barcelona (Spain), also indicated that 5% of those analyzed (311) through rapid tests had antibodies against the virus [49, 50]. The community prevalence of antibodies to SARS- CoV-2 was 4.65% in Los Angeles County in early April. Based on this prevalence, the authors estimate that approximately 367,000 county residents had antibodies to SARS-CoV-2. The official number of confirmed infections was only 8,430. However, the authors caution that there is likely to be selection bias [51]. In summary, most seroprevalence studies show that less than 5% of the population has antibodies.
What the ARI Incidence Rate Contributes to the Knowledge of the Epidemiology of COVID-19
Our calculations indicate a 3-5% incidence of COVID-19 infections in the population in March-April 2020. This coincides with some data from other places and with the mathematical models built from the case fatality rate of COVID-19 (the number of confirmed deaths due to COVID-19 divided by the total number of confirmed cases of infections with SARS-CoV-2). Other experts have stated that we must multiply by 27, at least, those detected, to approximate the actual number of infected [52, 53, 54, 55, 56].
In our study, using the conservative estimate that half of the ARI are cases of COVID-19 in the GP clinic during the study period, the incidence rate can be assessed as “real” or “reasonable”, which will reach 3,000 per 100,000 inhabitants. In other words, the incidence rate of cases with COVID-19 “official” PCR must be multiplied by 3 or 5 to obtain the real or reasonable rate of COVID-19. Thus, we estimate a number of “real” cases for Spain in the study period of between 540,000- 1,000,000 cases. This figure coincides with other authors. It has been estimated at 900,000 the number of cases with a clinical picture of COVID-19, with mild symptoms and without confirmation that GPs have attended in Spain, and that they have not been mostly referred to hospitals [57, 58]. Based on a survey, the Spanish Society of Family and Community Medicine estimated 65,149 positive cases for COVID-19 that was being monitored by health centers as March 27. Thus, it was calculated that each GP controls two people diagnosed with COVID-19 and 36 people who they suspect to have COVID-19. Other authors had calculated similar figures, which could be between 26 and approximately 40 hidden real cases in each Spanish general medicine consultation, as of April 9, 2020 (12, 36), which again coincides with our conservative estimates of 50% ARI cases: each GP can have between 20-30 cases of COVID-19.
Limitations and Strengths of the Study and the Proposal to Use the ARI Rates to Know the Incidence Rates of COVID-19 in the Community
Limitations
- There is an underestimation based only on symptomatic cases. The proportion of undetected, mild or asymptomatic cases, which could represent a substantial proportion of community transmission, remains largely uncertain. More than half of a population (residents of a skilled nursing facility) who tested positive is reported to be asymptomatic. These results not only indicate that asymptomatic individuals are playing an important role in the transmission of SARS-CoV-2, but that symptom- based detection alone was unable to detect a high proportion of infectious cases and were not sufficient to control the transmission in this context [59]. Therefore, the estimates of the incidence of COVID-19 based on the new cases of ARI in the GP consultation, that is, on the symptoms of ARI, do not include asymptomatic patients.
- In our study, the “raw” rates are shown, that is, those that refer to the population as a whole. Consequently, its interpretation, especially for comparison purposes, should be done with caution, since there is a danger of reaching erroneous conclusions. But presenting the rates more specifically, with very small population bases (the list of patients in the consultation; 2,000 people), would increase the random variation [40].
- Random variation. The study was carried out in a single GP office, with a demographic base small (2,000 people). In epidemiological analyzes of small populations, it is advisable to take the demographic base of about 10,000 people, that is, about 5 GPs practices [60, 61].
- The epidemics curves of different populations are not comparable and do not necessarily approximate the underlying transmission dynamics [24].
- The ecological and descriptive nature of our proposal for analysis between ARI cases and COVID-19 cases, assuming that it be used to assess the results of public health interventions, it must be taken into account that association or correlation does not indicate causality [24].
But, the study has some strength
- Prevalence studies can be expensive: they require good design, valid testing, and the infrastructure and logistics to perform them; in addition in seroprevalence studies, it should be borne in mind that in a population whose infection rate is 5%, a test that is 90 percent accurate could deliver a false positive nearly 70 percent of the time [62]. Instead, the detection of ARI by GPs is part of their daily work and does not need any additional infrastructure or cost, and may be more accurate.
- The convergence of results: There is a similarity of results with other population studies aimed at obtaining the frequency of COVID-19 in the population, which gives consistency to the method.
- It is required alternative options to evaluate the real incidence, and performance of infection control strategies, in the situation of lack of diagnostic tests, and the estimation of incidence rates of COVID-19, based on the ARI incidence rate based on clinical criteria, it is a very feasible and simple alternative; even more than using serological diagnoses of other diseases, as for example influenza as rate marker, as other authors suggest [24].
- Epidemiological plausibility: ARI (such as the flu) share similar clinical presentation (mainly as acute respiratory infection) and routes of transmission (mainly through droplets and fomites) with COVID-19.
- Validity: Although the fact of relying on a single GP practice has drawbacks, on the other hand, it has the advantage that since the same GP performs and records all ARI diagnoses, this increases its homogeneity and consistency.
- Probably the data is accurate: During a pandemic, patients may stop (or be told to stop) attending clinics for minor problems, and the amount of tests ordered for influenza surveillance may also be reduced. But, it is unlikely to happen in the GP consultation, in the conditions of the gateway to the public and universal health system, and within its role of continuity of care; and considering that consultations can be made by phone, without a face-to-face visit, and that it is very likely that all respiratory symptoms will be consulted during the COVID-19 pandemic, given that it is widely reported that it produces respiratory symptoms and patients need to, among other things, sick leave that your GP must authorize [63].
- The underestimation based on symptomatic cases can be corrected by taking higher proportions of IRA as an indicator of the COVID-19 model. In our study we present a conservative estimate of 50% of ARI as cases of COVID-19, but other figures could be used, such as, for example, the interval between 50-75% of ARI cases as an indicator of cases of COVID-19, for correct the possible underestimation for asymptomatic cases of COVID-19 (which obviously have not consulted the GP as IRA).
Finally, it is suggested to reproduce this approach to the knowledge of the epidemiology of COVID-19 from large computerized and validated databases of GP practices to validate or refute the proposal that emerges from our study.
Conclusion
The incidence rates of ARI in the GP consultation represent the “maximum” incidence rate of COVID-19 cases during the outbreak, and can be used as an indicator or tool to correct the official incidence rates that show cases with tests, but which are performed only in some patients, and therefore are “minimal” incidence rates. The use of the incidence rates of COVID-19 estimated from the incidence rates of ARI in GP practice is an easy, cheap and useful method to improve epidemiological knowledge of COVID-19 in those places where diagnostic tests are not performed at all possible cases. The incidence rates of ARI in the GP consultation may have epidemiological, clinical, planning, management, and control measures value in COVID-19 outbreaks.
References
-
Zhu N, Zhang D, Wang W, Xingwang L, Yang B, et al. (2020) A novel coronavirus from patients with pneumonia in China, 2019. N Engl J Med 382(8): 727-733.
-
(2020) COVID-19 Dashboard by the Center for Systems Science and Engineering (CSSE) at Johns Hopkins University of medicine.
-
Huang C, Wang Y, Li X, Ren L, Zhao J, et al. (2020) Clinical features of patients infected with 2019 novel coronavirus in Wuhan, China. Lancet 395(10223): 497-506.
-
Cascella M, Rajnik M, Cuomo A, Dulebohn SC, Napoli RD (2020) Features, Evaluation and Treatment Coronavirus (COVID-19). Stat Pearls.
-
Galvan CC, Catala A, Hernandez CG, Jimenez RP, Nietoet FD, et al. (2020) Classification of the cutaneous manifestations of COVID‐19: a rapid prospective nationwide consensus study in Spain with 375 cases. Br J Dermatol.
-
Pan L, Mu M, Yang P, Sun Y, Wang R, et al. (2020) Clinical Characteristics of COVID-19 Patients with Digestive Symptoms in Hubei, China: A Descriptive, Cross- Sectional, Multicenter Study. Am J Gastroenterol 115(5): 766-773.
-
Vaira LA, Salzano G, Deiana G, De Riu G (2020) Anosmia and Ageusia: Common Findings in COVID-19 Patients. Laryngoscope 130(7): 1787.
-
Yan CH, Faraji F, Prajapati DP, Boone CE, DeConde AS (2020) Association of chemosensory dysfunction and Covid-19 in patients presenting with influenza-like symptoms. Int Forum Allergy Rhinol.
-
Kaye R, Chang CWD, Kazahaya K, Brereton J, Denneny JC (2020) COVID-19 Anosmia Reporting Tool: Initial Findings. Otolaryngol Head Neck Surg.
-
Ault A (2020) Sudden Loss of Taste and Smell Should Be Part of COVID-19 Screen. Medscape.
-
Inciardi RM, Lupi L, Zaccone G, Italia L, Raffo M, et al. (2020) Cardiac Involvement in a Patient with Coronavirus Disease 2019 (COVID-19). JAMA Cardiol.
-
Wu Y, Xu X, Chen Z, Duan J, Hashimoto K, et al. (2020) Nervous system involvement after infection with COVID-19 and other coronaviruses. Brain Behav Immun 87: 18-22.
-
Turabian JL (2020) Clinical-Epidemiological Characteristics That May Help the General Practitioner to Consider Covid-19 Diagnosis in Acute Respiratory Infections When Diagnostic Tests Are Not Accessible. Epidemol Int J 4(2): 1-10.
-
(2020) Nuevo Coronavirus COVID-19: Acute Respiratory Infections (ARI).
-
Valero N, Larrea Y, Arocha F, Gotera J, Mavarez A, et al. (2009) Viral etiology of acute respiratory infections. Invest Clin 50(3).
-
Wei X, Li X, Cui J (2020) Evolutionary Perspectives on Novel Coronaviruses Identified in Pneumonia Cases in China. Natl Sci Rev 7(2): 239-242.
-
(2020) COVID-19, a pandemic or not?. Lancet Infect Dis 20: 383.
-
Turabian JL, Baez Montiel B, Gutierrez IE (2016) Implications of Incidence Rates of Diseases at Local Level in Family Medicine. Arch Fam Med Gen Pract 1(1): 7-11.
-
Turabian JL (2020) Epidemiological Value of Continuity of Care in General Medicine (Part one of Two). Epidemol Int J 4(1): 1-6.
-
Offord C (2020) Governments Must Ramp Up COVID-19 Testing, Says WHO. The Scientist.
-
WHO (2020) WHO Director-General’s opening remarks at the media briefing on COVID-19. World Health Organization.
-
Shear MD, Goodnough A, Kaplan S, Fink S, Thomas K, et al. (2020) The Lost Month: How a Failure to Test Blinded the US to Covid-19. The New York Times.
-
Alvarez Esteban PC, Barrio ED, Rueda C (2020) Compartmental models: a comparative study of the evolution of the COVID19 pandemic in China and Castilla y Leon. Department of Statistics and Operations Research.
-
(2020) “The Mathematics of Planet Earth”. 7th (Edn.), Mathematics Research Institute. Institute of Research in Mathematics (IMUVA). University of Valladolid.
-
Hung CK, Pak wing L, Ying CC, Hubert LKB, Pak leung H (2020) Monitoring respiratory infections in covid-19 epidemics. BMJ 369: 1628.
-
Turabian JL (1995) Family and Community Medicine. College of Medicine.
-
(2019) International Statistical Classification of Diseases and Health-Related Problems 10th Revision. ICD-10.
-
Moreno CW, Tenorio JP, Gatica SQ, Sanchez HR (2002) Incidence of respiratory diseases in vaccinated and unvaccinated officials against influenza. South East Metropolitan Health Service, year 2000. Rev chil Sick Breathe 18(1).
-
Cauthen DB (1994) Family practice incidence rates. J Am Board Fam Pract 7(4): 303-309.
-
Nandi Lozano E, Espinosa LE, Vinas Flores L, Avila Figueroa C (2002) Acute respiratory infection in children who go to a child development center. SciELO Public Health 44: 201-206.
-
(2020) TOLEDO. Coronavirus: Updated information on COVID-19. Leyendas de Toledo.
-
(2020) COVID-19 in Spain. National Center of Epidemiology.
-
Cennimo DJ (2020) Coronavirus Disease 2019 (COVID-19) Clinical Presentation. Medscape.
-
Turabian JL (2020) Acute respiratory infections in children during coronavirus disease 2019: without reverse transcriptase-polymerase chain reaction test and with risk of over-prescription of antibiotics. The perfect storm. Pediatric Infectious Diseases: Open Access 5(2): 1-5.
-
Kucirka LM, Lauer SA, Laeyendecker O, Boon D, Lessler J (2020) Variation in False-Negative Rate of Reverse Transcriptase Polymerase Chain Reaction-Based SARS- CoV-2 Tests by Time Since Exposure. Ann Intern Med.
-
Johnson K (2020) COVID-19 antibody tests proliferate: what do they show?. Medscape.
-
Turabian JL (2020) Micro-Impact of the Pandemic by Covid-19 in the General Medicine: Clinical and Epidemiological Reflections from the Situation in Spain March 2020. Epidemol Int J 4(2): 1-11.
-
Voorn S (2020) COVID-19: Who to Test and When?. Medscape Education Clinical Briefs.
-
(2020) Important Information on the Use of Serological (Antibody) Tests for COVID-19-Letter to Health Care Providers. US Food & Drug Administration.
-
Mallapaty S (2020) Will antibody tests for the coronavirus really change everything?. Nature.
-
Armijo Rojas R (1994) Basic epidemiology in primary health care. Madrid: Diaz de Santos SA.
-
Wajnberg A, Mansour M, Leven E, Bouvieret NM, Patel G, et al. (2020) Humoral immune response and prolonged PCR positivity in a cohort of 1343 SARS-CoV 2 patients in the New York City region. MedRxiv.
-
Lopatto E (2020) The disappointing truth about antibody testing: There’s still a lot we don’t know about COVID-19. The Verge.
-
(2020) What Do You Think About the Reported Rates of COVID-19?. Medscape.
-
Gudbjartsson DF, Helgason A, Jonsson H, Magnusson OT, Melsted P, et al. (2020) Spread of SARS-CoV-2 in the Icelandic population. N Engl J Med 382: 2302-2315.
-
Crist C (2020) WebMD Poll: 93% with COVID-19 Symptoms Didn’t Get Test. Medscape.
-
Heuvel MVD (2020) Heinsberg study in the “preprint”: high number of unreported infections, death rate only 0.36%-does this apply to all of Germany?. Medscape.
-
Streeck H, Schulte B, Kümmerer NM (2020) Infection fatality rate of SARS-CoV-2 infection in a German community with a super-spreading event. MedRxiv.
-
Sevillano EG (2020) Only 5% of Spaniards have been infected with coronavirus, according to the first data from the prevalence study.
-
Salje H, Kiem CT, Lefrancq N, Courtejoie N, Bosetti P, et al. (2020) Estimating the burden of SARS-CoV-2 in France. Science, pp: 1-9.
-
Sood N, Simon P, Ebner P, Eichneret D, Reynolds J, et al. (2020) Seroprevalence of SARS-CoV-2–Specific Antibodies Among Adults in Los Angeles County, California, on April 10-11, 2020. JAMA 323(23): 2425- 2427.
-
Fauci AS, Lane HC, Redfield RR (2020) Covid-19- Navigating the Uncharted. N Engl J Med 382: 1268-1269.
-
Zhou F, Yu T, Du R, Fan G, Liu Y, et al. (2020) Clinical course and risk factors for mortality of adult inpatients with COVID-19 in Wuhan, China: a retrospective cohort study. The Lancet 395(10229): 1054-1062.
-
Lewis R (2020) Risk Factors for Death From COVID-19 Identified in Wuhan Patients. Medscape.
-
Adam D (2020) Modelers Struggle to Predict the Future of the COVID-19 Pandemic: Disease experts have largely focused on how we got to where we are now with coronavirus infections. Improved data collection and sharing can enhance projections of what’s to come. The Scientist.
-
Backhaus A (2020) Coronavirus: Why it’s so deadly in Italy: Demographics and why they are a warning to other countries. Medium.
-
(2020) The sem FYC quantifies in close to a million those affected by a clinical picture of COVID-19 in Spain, with more than 900,000 mild and without tests attended in Primary Care. SemFYC.
-
Mouzo J (2020) Primary care estimates that 2% of the population has symptoms of Covid-19. EL PAIS.
-
Gandhi M, Yokoe DS, Havlir DV (2020) Asymptomatic Transmission, the Achilles’ Heel of Current Strategies to Control Covid-19. N Engl J Med 382: 2158-2160.
-
Fry J (1992) Common Diseases: Their Nature Incidence and Care. Lancaster, England.
-
Pereira GD (1982) Epidemiology and research in a general practice. London: The Royal College of General Practitioners 32(245): 724-725.
-
Haugh T, Bedi S (2020) Just Because You Test Positive for Antibodies Doesn’t Mean You Have Them. The New York Times.
-
Saultz JW (2003) Defining and Measuring Interpersonal Continuity of Care. Ann Fam Med 1(3): 134-143.
- Epidemiological Surveillance and Rumors on Social Media
- Awareness and Treatment of Uncontrolled Hypertension in US Overweight/Obese Youths Aged 16–24 Years, NHANES 2021–2023
- Strengthening EPI Through Parental Engagement: Lessons from Dhaka Slums for IA-2030
- Mothers Knowledge of the Prevalence, Causes, Effects, Prevention and Control of Diarrhoea among Children in Ife East Local Government Area, Ile Ife, Osun State, Nigeria
- Covid-19 Reinfections Case Series from October 2023 to October 2024 in A General Medicine Office in Toledo (Spain)
- Water Contact! One Risk Too Many: Risk Factors Associated with Schistosoma haematobium infection in Osun State, Nigeria